
Key Takeaways
- Margin pressure in 2026 is a delivery-model design problem, not a staffing question, with Forrester projecting a 15% cut in agency jobs as AI reshapes production 2.
- Utilization dashboards mislead when read as idle-capacity signals; the real lever is expanding the denominator by redesigning the signal-to-measurement production loop, not pushing billable hours higher 8.
- AI captures roughly 24% in marketing labor time when applied to coordination, data consolidation, and first-draft work, while approval gates keep creative judgment and client trust intact 5, 7.
- Owners should sequence a 90-day rebuild: instrument utilization and handoffs, redesign one pod against one workstream, then extend with governance and approval logs before scaling further 9.
The Margin Squeeze Facing Agency Owners in 2026
Agency profit and loss statements are getting compressed from three directions at once. Client fee expectations are dropping: the Santiago Company brief found that 58% of consulting clients expected professional services fees to decline by Q4 2024, compared with just 5% pre-pandemic 10. Labor costs for senior producers and strategists have not softened at the same pace. And a growing share of client work is now benchmarked against what the client's own in-house team can produce with generative AI, with McKinsey's early-2024 survey showing 65% of organizations regularly using gen AI and marketing and sales leading the adoption curve 6.
Forrester frames the operational consequence directly. Its 2026 predictions call for a 15% reduction in agency jobs and an 8% average headcount cut already recorded in 2025, driven by AI and automation reshaping delivery 2. Owners who read that as a simple staffing question will trim the wrong roles and lose institutional knowledge. The more useful reading is that the underlying production model no longer supports the old cost structure.
The rest of this analysis treats efficiency as a delivery-model design problem. Utilization math, production loop redesign, workstream orchestration, and governance each get examined in the terms an owner or COO can act on in the next two quarters.
Why Utilization Math Alone No Longer Diagnoses the Problem
The Utilization Benchmark and Where Most Agencies Sit Today
Utilization rate remains the default diagnostic that operations leaders reach for when margins slip. Harvest's professional services guidance places a healthy billable utilization band between 70% and 90%, with the caveat that non-billable time for training, business development, and internal work must still be protected 8. Agencies that ran hot at 78-82% during the 2021 hiring boom have watched that number drift into the high-60s across 2024 and 2025 as project scopes tightened and freelance benches got trimmed unevenly against staff capacity.
The drift matters because the standard remediation playbook no longer produces the expected margin recovery. Cutting bench, raising billable targets, and re-forecasting quarterly capacity used to close a two- to four-point gap. Owners running that playbook in 2025 are reporting the same interventions clawing back roughly half of what they used to. Producers hit their hours, but the hours themselves are absorbing more revision cycles, more coordination touchpoints, and more client-side AI-augmented review, so the effective output per billable hour has quietly compressed.
A utilization dashboard reading 68% in this environment is not diagnosing an idle-capacity problem. It is a lagging indicator of a production model that has more billable friction inside each hour than it did three years ago. Treating the number as a staffing question, rather than a workflow question, is where most efficiency projects go wrong before they start.
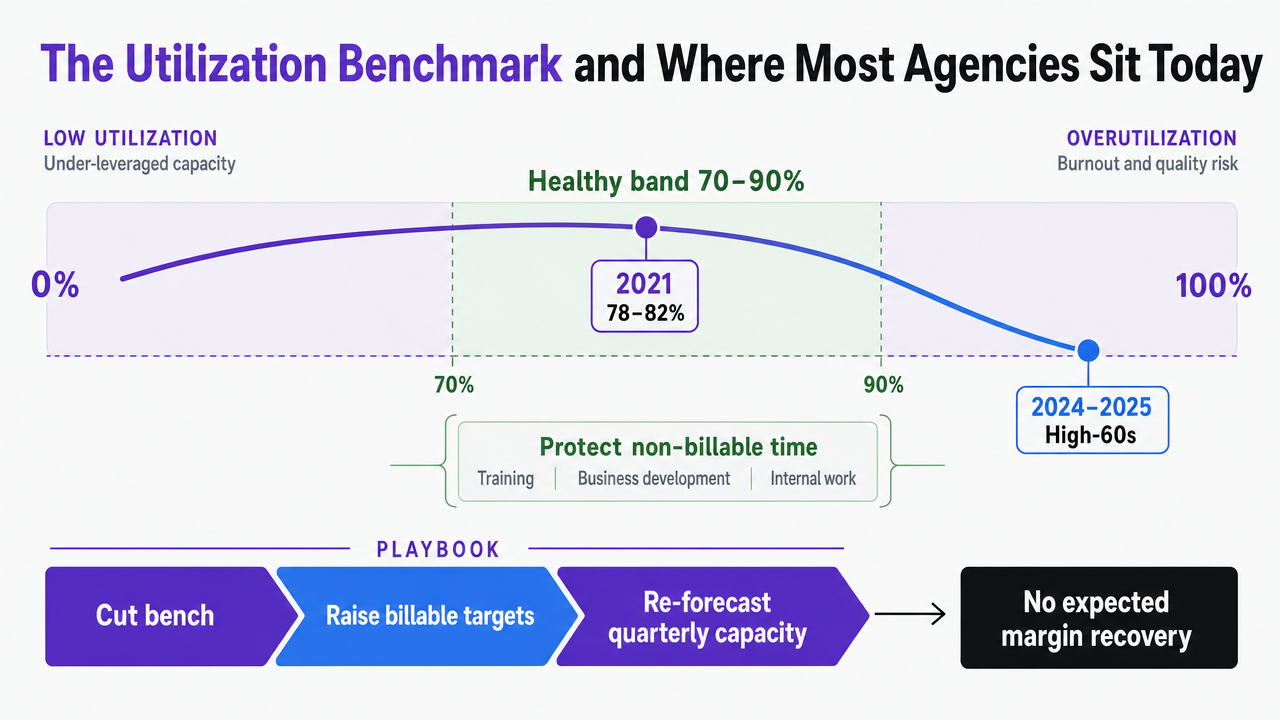 Show the healthy utilization band (70-90%) from Harvest against the drift from 78-82% in 2021 into the high-60s in 2024-2025 described in the section prose
Why the Denominator Is the Real Problem
Utilization is a ratio: billable hours over total available hours. Every efficiency conversation in agencies for the past two decades has focused on lifting the numerator. Push senior producers to 80% billable, tighten timesheet discipline, kill low-margin retainers. The denominator was treated as fixed at roughly 40 hours per FTE per week.
AI-driven production changes that assumption. When a content specialist can supervise the drafting of a 12-asset sprint in the time previously spent writing four, the productive denominator per person expands even if the clock does not. The Harvest range still applies as a governance metric, but a 75% utilization figure now sits on top of a larger capacity base than it did in 2022 8. Two agencies with identical utilization dashboards can have materially different economics depending on how much of the production loop each has redesigned.
This reframes the operator question. Instead of asking whether utilization can be pushed from 68% to 74%, the more useful question is which workstreams inside the denominator have been restructured so that a billable hour produces more finished, client-ready output. Sections three through five walk through the workstreams where that restructuring has the largest measurable effect, starting with the production loop itself.
Trial access: Scale agency output instantly
Test-drive automated client delivery and publish real work before any commitment.
The Production Loop Redesign: Signal, Recommendation, Approval, Execution, Measurement
Mapping the Five Stages Against Current Agency Waste
Every client engagement inside an agency runs through the same five stages, whether or not the operations team has ever named them: a signal arrives (a keyword drop, a CPL spike, a client request, a competitor launch), a recommendation gets shaped, someone approves the work, production ships it, and measurement closes the loop. In most 10-150 FTE agencies, waste concentrates in the transitions between those stages rather than inside any single stage.
The signal stage leaks time because data lives in six places: the ad platforms, the SEO tool, the call tracking system, the CRM, the social scheduler, and the client's own reporting exports. A strategist spends two to four hours per client per week just consolidating what actually happened before recommendations can start. The recommendation stage leaks time because it gets written twice, once as an internal deck and once as a client-facing brief. Approval leaks time because it moves through email, Slack threads, and a weekly status call rather than a single decision log. Execution leaks time because producers are handed briefs that lack the underlying data context, so revision cycles multiply. Measurement leaks time because the person who ran the campaign is rarely the person who reports on it.
Deloitte's workflow automation outlook frames this exact pattern as the shift “from insights to orchestration,” where end-to-end processes get automated rather than individual steps 9. For an agency, that reframes efficiency work as reducing handoffs, not accelerating any single stage in isolation.
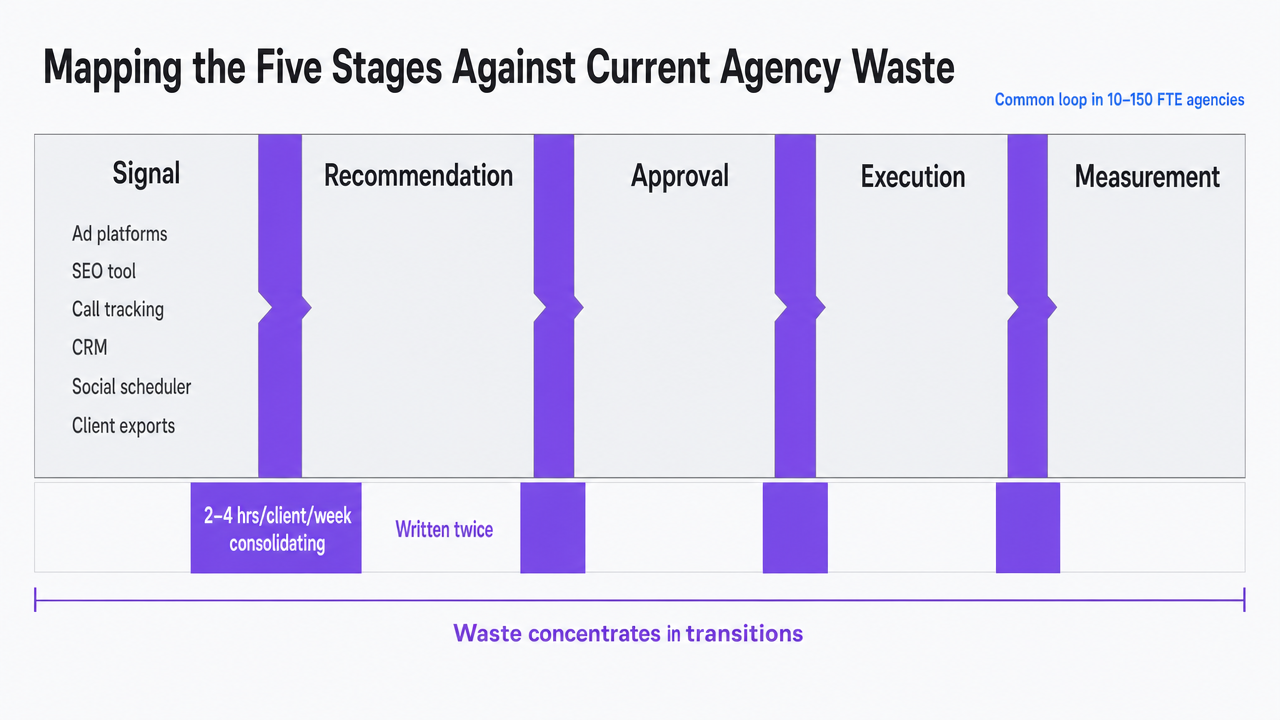 Visualize the five-stage production loop (Signal, Recommendation, Approval, Execution, Measurement) described in the section as the operating model redesign
Where AI Absorbs Labor Without Losing Creative Control
Bain's analysis of marketer-agency relationships puts a specific number on the redesign opportunity: companies could save 24% in marketing labor time using generative AI, corresponding to a roughly 30% gain in productivity for marketing work 5. Those figures are the ceiling for the production loop rebuild, not a floor, and they only materialize when AI is deployed against stages that currently absorb repetitive labor without adding creative judgment.
The signal stage is the highest-yield entry point. Ingesting call transcripts, ad platform performance, ranking movement, and pipeline data into a common layer removes the two-to-four-hour consolidation tax per client per week. The recommendation stage benefits next: pattern recognition against historical performance produces a ranked list of interventions faster than a strategist working from raw dashboards. Execution captures the largest raw hour savings, because a producer supervising the drafting of a 12-asset content sprint, a paid search account with 40 ad groups, or a link outreach list of 30 targets is doing editorial and quality work rather than blank-page work.
The stages that do not compress are approval and the creative direction inside execution. A senior strategist deciding which of eight ranked recommendations actually fits the client's brand posture, or a creative director rewriting a headline that tests well but reads flat, is not the labor Bain measured. That distinction matters operationally. Agencies that push AI into the judgment stages tend to lose client relationships; agencies that push AI into the coordination and drafting stages tend to capture the 24% savings without eroding the work that clients pay senior rates for 5.
The Approval Gate as a Differentiator Against Autonomous Agent Hype
Most competing narratives about AI in agencies point toward fully autonomous agents that receive a goal and ship work without intervention. That framing sells software demos. It does not survive contact with a client in a regulated vertical, a founder who has spent a decade building a brand voice, or a media buyer whose budget signature carries fiduciary weight.
The approval gate is what turns the production loop from a demo into a delivery model. Every ranked recommendation surfaces with the reasoning attached, a human signs off, and execution follows. Nothing ships unreviewed. This is the mechanism that makes AI-orchestrated delivery defensible in law firm marketing, behavioral health, dental group operations, and other verticals where a wrong claim or an off-brand asset creates real exposure.
McKinsey's work on human-machine skill partnerships supports the operational read here: while today's technologies could theoretically automate more than half of current US work hours, the adoption pattern points toward new roles centered on collaboration with intelligent agents rather than full replacement 7. Translated into agency terms, the senior producer becomes an approver and editor of ranked AI output rather than the person hand-crafting the first draft. The account lead becomes the person interpreting recommendations against client context rather than the person assembling the weekly status deck.
Agencies that build the approval gate into the operating model early keep creative control at the exact point where clients pay for it. Agencies that skip the gate to chase autonomy metrics tend to discover the cost of that trade at the first client escalation.
Redesigning Delivery Around Six Specialist Workstreams
Content, SEO, PPC, Backlinks, Social, and Call Intelligence Under One Orchestration Layer
The traditional agency stack treats each channel as its own department with its own tools, its own reporting cadence, and its own weekly standup. A content team pushes drafts through an editorial calendar. A paid search team optimizes bids inside the ad platform. A link-building lead tracks outreach in a separate database. Call intelligence, when it exists at all, lives inside a phone system that neither the SEO nor the PPC team looks at more than once a month. The coordination tax across those six workstreams is where a meaningful share of the utilization drift discussed earlier actually hides.
BCG's guidance to CMOs deploying AI in marketing frames the alternative: prioritize end-to-end workflows across creative and media rather than isolated experiments, and expect new human–AI partnerships to form inside those workflows 3. For an agency operating model, that translates into a single orchestration layer where a ranking movement, a CPL spike, and a shift in call quality all surface against the same client record and route to the same approval queue. The SEO recommendation to add three cluster pages, the PPC recommendation to reallocate spend into a new ad group, and the content recommendation to produce two case studies stop competing for separate strategist attention and start reading as one prioritized list.
Deloitte's workflow automation outlook makes the same operational point in different language: the value is in orchestration, not in stacking better individual tools 9. Agencies that keep six specialist channels in six specialist silos will find AI absorbed unevenly, with content teams three quarters redesigned and paid media still running the 2019 playbook.
Pod Roles That Change: Account, Strategy, Production, Freelance
The pod structure that most agencies still run — account manager, strategist, producer, and a rotating freelance bench — was designed for a world where production hours were the binding constraint. Under an orchestration layer, three of those four roles change shape.
The account manager stops being the assembler of status decks and becomes the interpreter of ranked recommendations against client context. The strategist stops writing briefs that get rewritten downstream and starts curating which of the surfaced interventions actually align with brand posture and quarterly targets. The producer stops working from a blank page on a 12-asset content sprint or a 40-ad-group paid search buildout and starts editing, quality-checking, and approving AI-drafted output. The freelance bench compresses hardest, because the specific labor freelancers were historically brought in for — overflow drafting, keyword expansion, ad copy variants, outreach email personalization — is the labor Bain identified in its 24% marketing labor time savings estimate 5.
McKinsey's framing of skill partnerships lands here: the roles that survive and expand are the ones that supervise, edit, and direct intelligent agents rather than the ones that produce first drafts by hand 7. Owners running this redesign should expect the pod headcount ratio to shift toward senior judgment and away from mid-level production. That is the staffing consequence of the orchestration layer, and it is what makes the utilization denominator expand rather than the numerator simply climb.
Download the Data-Backed Agency Efficiency Playbook
Get the PDF with benchmarks, workflow diagrams, and actionable frameworks for scaling client delivery and margin—without increasing headcount or production overhead. Built for agency leaders focused on operational efficiency.
Consolidation Economics for Holding Companies and Portfolio Operators
The audience shifts here. This section is written for owners of multi-location agency operations, marketing holding companies, and portfolio operators consolidating several agency brands under one P&L. Owners of single-shop agencies can skip to the governance section without losing the argument.
Portfolio operators face a version of the margin problem that single agencies do not. Per-client production cost is not a line item on one engagement; it is a repeated cost multiplied across dozens or hundreds of client relationships, often with duplicated tooling, duplicated pod structures, and duplicated freelance benches across sister agencies. Consolidation economics ask a specific question: what does the per-client monthly production cost curve look like when the same underlying orchestration layer serves every brand in the portfolio?
The variables that answer that question honestly are limited. Bain's estimate of 24% marketing labor time savings from generative AI, corresponding to roughly a 30% productivity gain, sets the labor-side ceiling 5. Harvest's 70-90% healthy utilization range sets the capacity denominator 8. Everything else on a per-client cost line — senior salary bands, freelance rates, tooling stacks, overhead allocation — varies enough across markets and portfolios that publishing a benchmark number would be misleading. The comparison below uses transparent variables rather than invented dollar figures.
| Model | Labor Time per Client (Monthly) | Utilization Assumption | Relative Cost Index |
|---|---|---|---|
| Traditional pod (AM + strategist + producer + freelancers) | Baseline (100%) | 68-72% billable | 1.00x (illustrative baseline) |
| Hybrid with point AI tools bolted onto existing pod | ~88-92% of baseline | 70-75% billable | ~0.90x (illustrative) |
| Unified AI marketing team platform with human approval | ~76% of baseline (per Bain 24% labor savings) 5 | 75-85% billable, denominator expanded | ~0.70x (illustrative, assumes full loop redesign) |
Illustrative cost index only. Dollar figures intentionally omitted. Variables sourced from Bain 5 and Harvest 8; portfolio-specific salary, tooling, and overhead inputs must be modeled against each operator's actual P&L.
Two portfolio-level effects compound on top of the per-client math. First, tooling consolidation: a portfolio running one orchestration layer across ten agencies removes nine redundant tool stacks, and the negotiation leverage on the remaining stack changes. Second, senior talent leverage: a principal-level strategist who previously served four clients inside one agency can supervise ranked recommendations across twelve to fifteen clients spanning multiple brands, because the coordination tax that limited that ratio has been absorbed by the platform layer.
Holding company CFOs modeling this should treat the 0.70x index as the ceiling of the redesign, not the expected first-year result. The realized cost curve depends on how quickly pod structures actually shift toward the senior-judgment ratio described earlier, and how disciplined the portfolio is about retiring duplicate tooling rather than layering the platform on top of it.
Governance, Adoption, and the Real Failure Modes
Redesigning the production loop and pod structure is the visible half of the work. The invisible half is governance, and this is where most agency efficiency programs quietly fail in months three through six. McKinsey's early-2024 survey noted that despite widespread gen AI adoption, many organizations struggle with risk management, talent alignment, and process integration, and that scaling AI without operational redesign tends to undermine the benefits it was supposed to deliver 6. Deloitte's workflow automation outlook makes the same point from the change management angle: governance gaps and uneven employee adoption are the constraints that cap realized efficiency gains 9.
Three failure modes recur across agencies attempting this redesign.
- Treating the platform as a tool rollout rather than an operating model change. When an AI orchestration layer gets introduced without retiring the legacy briefing documents, status meetings, and duplicate reporting cadences, producers end up doing both jobs, and the 24% labor time savings Bain identified never materializes 5.
- Skipping the approval log. Agencies that let recommendations execute through informal Slack sign-offs lose the audit trail that makes AI-orchestrated work defensible to clients in regulated verticals, and the first escalation forces a retreat to manual production.
- Measuring the wrong thing. Efficiency dashboards that still track only billable utilization miss the denominator expansion described earlier, and finance leaders end up with data that says nothing changed when the underlying capacity has actually shifted.
Owners who install governance alongside the redesign, rather than after it, are the ones who capture the productivity gain as durable margin instead of a one-quarter blip.
Download the Agency Efficiency PDF: Proven Methods to Scale Without More Hires
Access a data-backed guide detailing workflow automation, overhead reduction, and multi-channel execution frameworks used by top agencies to improve delivery efficiency while maintaining client oversight.
A 90-Day Operating Model Redesign an Owner Can Hand to a COO
The preceding analysis argues for a delivery-model rebuild rather than a staffing trim. The plan below translates that argument into a 90-day sequence a COO can execute against, with the diagnostic, redesign, and governance work sequenced so that each phase produces evidence for the next.
- Days 1–30: Instrument the current state. Pull twelve months of utilization data against Harvest's 70–90% healthy range and identify which pods sit below the band 8. Run a handoff audit on three representative client engagements, timing every transition between signal, recommendation, approval, execution, and measurement. Catalogue the tooling stack across all six workstreams (content, SEO, PPC, backlinks, social, call intelligence) and mark which tools have overlapping functions. The output of this phase is a single document showing where the denominator can expand and where handoffs consume billable hours without producing client-visible work.
- Days 31–60: Redesign one pod against one workstream. Pick the highest-volume production category, most often content or paid search, and rebuild the loop with an orchestration layer that surfaces ranked recommendations against a single approval queue. Rewrite the producer job description around editing and quality control of AI-drafted output rather than blank-page creation. Retire the legacy briefing document and the parallel status deck; both are the handoff waste Bain's 24% labor time savings estimate assumes gets removed 5. Track the approval log from day one so the audit trail exists before the first client escalation tests it.
- Days 61–90: Extend and govern. Roll the redesigned loop to a second workstream, then a third. Install a monthly review that tracks both utilization and output-per-billable-hour, so finance sees the denominator expansion described earlier rather than a flat utilization reading. Deloitte's workflow automation outlook is explicit that governance gaps cap realized efficiency gains, so the review cadence and the approval log matter as much as the tooling choice 9. Platforms built around approval-first automation, such as Vectoron's AI marketing team model, are designed to fit this sequence without forcing the pod redesign and the tooling change to happen in the same week.
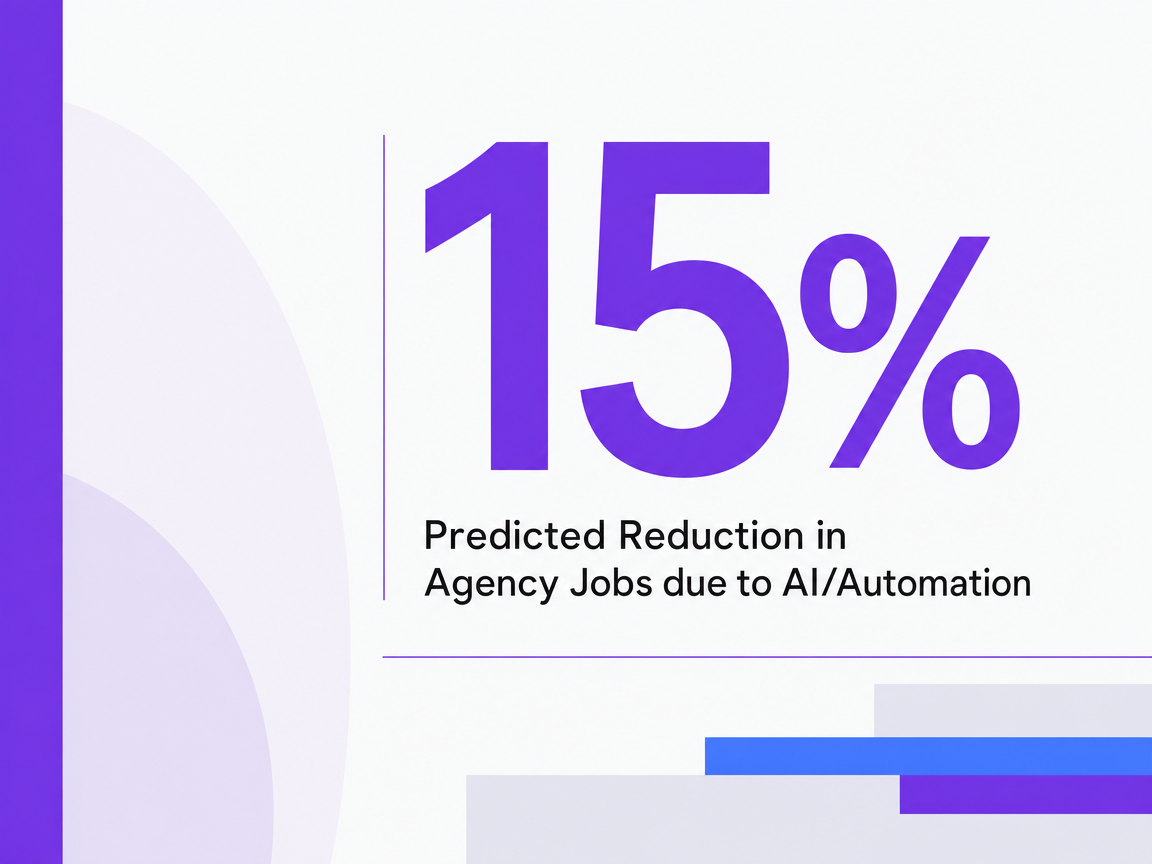 Predicted Reduction in Agency Jobs due to AI/Automation
Predicted Reduction in Agency Jobs due to AI/Automation
Frequently Asked Questions
References
- 1.The State of AI in the Enterprise - 2026 AI report | Deloitte US.
- 2.Predictions 2026: Marketing Agencies Resign Their Agency - Forrester.
- 3.From Campaigns to Business Value: How AI Will Transform Marketing.
- 4.AI Will Shape the Future of Marketing - Harvard Professional & Executive Education.
- 5.Marketers' Agency Partnerships Are Strained. Now Comes AI.
- 6.The state of AI in early 2024.
- 7.Agents, robots, and us: Skill partnerships in the age of AI.
- 8.Utilization Rate Calculator for Staffing Agencies.
- 9.2026 ServiceNow Workflow Automation Outlook.
- 10.The New Economics of Professional Services.