
Key Takeaways
- Agency efficiency measures billable revenue per labor hour, while technical efficiency measures output per input cost—neither metric substitutes for the other, and each requires a different fix.
- Diagnose the real constraint with three questions covering absorbed capacity, automatable billable hours, and utilization-realization gaps before committing capital to AI production tools.
- When double-digit utilization or realization gaps exist, faster AI-driven output only produces more unbilled work; pricing, scope, and project accounting must be repaired first 2.
- AI compresses the task layer—drafting, variants, reporting, research—but leaves client discovery, strategy, and negotiation intact, and governance overhead absorbs a meaningful share of the gain 5.
- Sequence the next four quarters by fixing the operating model first, building NIST-aligned governance second, then compressing task-layer production in quarters three and four.
The Sequencing Problem Most Owners Get Backwards
Agency owners often mistakenly frame investment decisions as a choice between fixing their operating model and acquiring technical efficiency. These two concepts operate on different metrics. Agency efficiency measures how effectively a firm converts labor hours into billable, retained revenue, while technical efficiency gauges the cost-effectiveness of converting inputs into outputs. Neither can fully substitute for the other. Injecting AI production capacity into an agency with poor utilization and realization discipline primarily leads to cheaper unbilled work.
The key to success in 2025 and 2026 lies in proper sequencing. First, diagnose which metric is truly underperforming. Address operating model issues where utilization, realization, and delivery workflows are eroding margins. Only then should you focus on compressing production costs with AI at the task level, while safeguarding the strategic and relationship-building work that drives client retention. Technical tools only translate into agency-wide gains when leadership, processes, and resources are aligned 2.
Macroeconomic data supports this cautious approach. U.S. nonfarm business sector labor productivity increased by a mere 0.3% in the first quarter of 2026 10, highlighting that AI does not automatically improve firm-level economics. The following sections will guide you through diagnosing these issues, understanding the levers for each metric, and determining the optimal investment sequence for the next four quarters.
Two Different Denominators, Two Different Fixes
Agency Efficiency: Billable Revenue Divided by Labor Hours
Agency efficiency is fundamentally a labor-hour calculation. The numerator is billable, retained revenue, and the denominator is the total hours a firm's staff can sell. Agency principals already monitor key components: utilization percentage (billable hours divided by capacity), realization percentage (revenue collected divided by revenue booked at standard rates), effective hourly rate, and gross margin per account. A decline in any of these metrics results in financial losses, regardless of the sophistication of production tools.
The solutions here are not technological but rather involve decisions about staffing mix, scope definition, project accounting, and client governance. For instance, a senior strategist billing at 45% utilization against a 65% target creates a margin leak that even the most cost-effective AI model cannot rectify. Similarly, scope creep on a fixed-fee retainer erodes realization, a problem that faster deliverables cannot solve because the additional hours were never factored into the initial pricing.
The University of Washington's framework on organizational efficiency emphasizes that gains stem from aligning leadership, processes, and resource decisions, not from simply layering tools onto a flawed operating model 2. For agency owners, this means conducting internal audits before investing in AI production capacity. Key areas to examine first include utilization targets, realization discipline, and the consolidation of delivery workflows.
Technical Efficiency: Output Units Divided by Input Cost
Technical efficiency employs a distinct calculation. The numerator represents output units, such as a blog draft, a media plan, a landing page variant, or a campaign report. The denominator is the input cost required to produce that unit, encompassing compute resources, software licenses, and the human hours needed for prompting, reviewing, and finalizing the work. The primary lever here is unit cost, not utilization.
The rapid evolution of input costs is crucial for capital planning. The Stanford HAI's 2025 AI Index reported a more than 280-fold decrease in the cost of querying a GPT-3.5-equivalent model over approximately 18 months 9. While this figure specifically measures inference cost for a particular model class and not the overall agency production cost, its direction and magnitude are vital for principals to understand. Input economics are changing faster than most annual planning cycles can accommodate.
McKinsey's economy-wide estimate that generative AI could automate 60 to 70 percent of employees' time underscores this trend, though this figure applies broadly to knowledge work, not necessarily to fully automated end-to-end tasks within an agency 1. For an agency, this realistically means that per-unit production costs at the task layer are rapidly decreasing, while orchestration, review, and quality control still demand human involvement. Technical efficiency is maximized when a firm reengineers its production process, rather than simply integrating a model into existing workflows.
Why the Denominators Don't Substitute for Each Other
These two efficiency metrics are independent. Utilization is absent from the technical efficiency equation, and inference cost does not factor into agency efficiency. An agency could reduce production costs by 90% but still incur losses if its senior strategists maintain only 40% billable utilization, as labor hours are fundamental to profitability. Conversely, a firm might achieve target utilization but lose competitive ground if competitors produce three times the campaign volume for the same input cost.
This highlights why sequencing is more critical than merely choosing between investments. Technical efficiency gains only translate into agency-level benefits when the operating model is equipped to leverage them. Faster content production without addressing realization issues leads to more unbilled revisions. Cheaper media analytics without improving utilization means senior staff spend their newly freed time on unbilled tasks. The gains remain confined to the technical side and never impact the agency's overall financial health.
The reverse is also true: an agency with strong utilization and realization but no production cost compression will eventually hit a ceiling dictated by human throughput. The correct perspective is that these two efficiencies are complementary layers. The diagnostic question then becomes: which layer currently represents the primary constraint? The next section will explore how to answer this question.
Test agency-level efficiency against technical workflows
Experience measurable workflow improvements on real client campaigns before making any commitment.
Diagnosing Which Side Is Actually Broken
Three Questions That Point to the Right Investment
Principals don't need a complex maturity model; they need three simple questions to distinguish between a labor-hour problem and an input-cost problem before their next capital investment cycle.
- If senior billable staff gained 20% more capacity tomorrow, would the firm sell it or absorb it as unbilled work? If the answer is "absorb," the constraint lies in demand and pricing, not production. Faster output would only result in more unpaid revisions. In this scenario, prioritize fixing scope definition, realization discipline, and account-level margin reporting before investing in production tools.
- What percentage of current delivery hours are spent on tasks that a competent junior staff member, aided by an AI model, could complete in a fraction of the time, and how many of these hours are actually billable? If a significant portion of delivery hours is both automatable and billable at standard rates, compressing production costs directly threatens revenue unless the firm simultaneously reconfigures its pricing model. If these hours are largely unbilled overhead, technical efficiency directly translates into margin improvement.
- What are the firm's utilization and realization gaps against its own targets? If both gaps are double-digit percentages, the operating model is the primary constraint. If the gaps are single-digit and client campaign volumes are increasing, then production capacity is the next area for investment. The broader context of 0.3% Q1 2026 nonfarm productivity growth 10 serves as a reminder that neither solution automatically boosts performance; both require the firm to adapt its booking, pricing, and delivery processes.
Signals the Operating Model Is the Bottleneck
Certain indicators often appear before they impact the P&L. These include:
- Senior strategists consistently billing below target utilization while junior staff are overworked
- Un-invoiced change orders
- Retainer accounts where logged hours routinely exceed priced hours by 15% or more
- Project accounting that finalizes weeks after delivery, leading to retrospective rather than proactive scope management
Client governance is another key indicator. Agencies that conduct weekly status calls without regularly discussing scope, deliverable volume, or reporting cadence are effectively subsidizing their clients, leading to stable top-line revenue but eroding gross margins.
None of these issues can be resolved by cheaper production. An AI model that drafts a report in eight minutes will not prevent a client from requesting a fourth round of revisions on a fixed-fee project. The University of Washington's perspective is directly applicable here: efficiency gains arise from aligning leadership, processes, and resource decisions, and tooling only amplifies these gains when such decisions are in place 2. Principals observing these patterns should allocate the next quarter's investment to pricing structures, project accounting, and delivery workflow consolidation before pursuing any production-cost initiatives.
Signals Production Cost Is the Bottleneck
The opposite scenario presents a different set of signals. Utilization is near target, realization is stable, and gross margin per account is consistent. The constraint here is throughput: competitor agencies are producing three campaign variants for every one the firm creates, pitch decks include more research and creative options, and clients are questioning why the firm's output volume lags behind others.
This indicates a production-cost problem, and the competitive pressure is quantifiable. The Stanford HAI's 2025 AI Index reported that organizational AI adoption increased to 78% in 2024 from 55% in 2023, with generative AI use in at least one business function rising to 71% from 33% 3. While these figures cover organizations broadly, not just agencies, the trend is critical for competitive positioning: an agency operating on last year's production cost curve is competing against peers whose input economics have already been reset.
When the operating model is sound, investments in technical efficiency yield returns. Freed hours at the task layer can be redirected to produce more variants per account, achieve faster turnarounds, or be reinvested in strategy and client retention—areas where human staff still excel. The diagnostic question is not whether to invest in production compression, but which task categories to compress first without compromising quality or introducing governance risks.
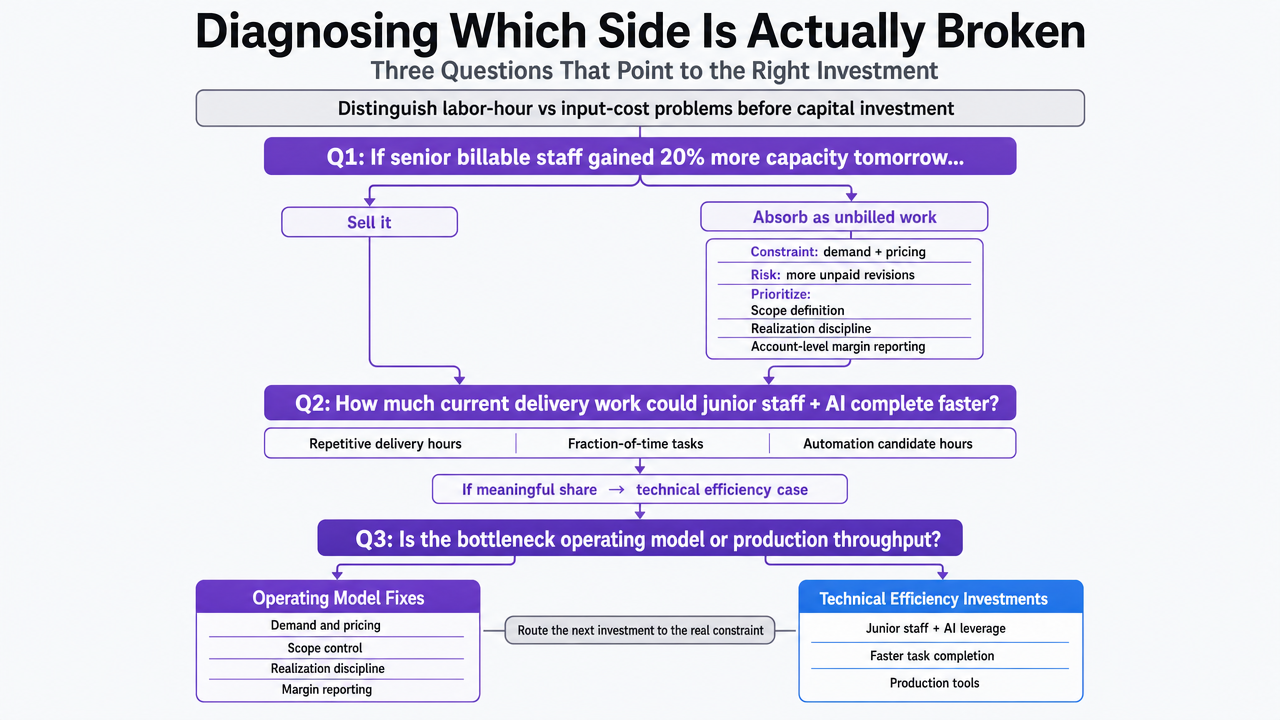 Visualize the three diagnostic questions as a decision framework that routes owners toward either operating model fixes or technical efficiency investments, directly supporting the section's diagnostic workflow
See How Leading Agencies Balance Efficiency with Technical Rigor
Request a data-driven assessment to benchmark your agency’s process efficiency and technical execution against industry standards—identify measurable opportunities for margin improvement without sacrificing quality.
What AI Actually Compresses at an Agency
The Task Layer, Not the Relationship Layer
The compression AI offers is uneven, and this is a critical distinction. Generative AI excels at drafting, variant production, initial research, media reporting, transcription, tagging, and structured analysis. However, it performs poorly or unreliably in areas like client discovery calls, strategic positioning debates, creative direction that embodies a firm's unique perspective, negotiation, and the critical judgment calls required to launch a campaign. Owners who assume AI will deliver a uniform percentage cut across the entire P&L often overestimate the gains, as savings are almost exclusively concentrated at the task layer.
McKinsey's estimate that generative AI could automate 60 to 70 percent of employees' time refers to economy-wide knowledge work, not end-to-end agency deliverables 1. This distinction is important. A copywriter's daily tasks include drafting, revising, formatting, briefing intake, and client review. AI significantly compresses the first three but has minimal impact on the latter two. Similarly, a media strategist's day involves pulling reports, checking pacing, writing recommendations, and defending them in calls. AI compresses the first two tasks, but not the last two.
For principals, the operational implication is that AI reduces the internal cost of producing deliverables but largely leaves intact the cost of acquiring, retaining, and guiding client accounts. Firms that reinvest freed task-layer hours into strategy, retention, and account expansion can protect their margins. Conversely, firms that view these freed hours as an opportunity for headcount reduction risk undermining the relationship layer that generates revenue in the first place.
Which Roles Feel the Substitution Pressure First
The impact of AI is not uniformly distributed across an agency's organizational chart. BLS 2024-34 occupational projections indicate that sales, design, and administrative support roles are where generative AI and related productivity gains are expected to moderate labor demand 7. These categories directly correspond to agency-adjacent functions such as business development coordinators, junior designers creating variant assets, account coordinators managing scheduling and reporting, and administrative staff supporting billing, project setup, and client communications.
This exposure manifests as a shift in task mix, not wholesale elimination of roles. The BLS suggests that AI improves productivity for certain occupations, moderating or reducing employment growth without entirely eliminating those roles 6. For example, a junior designer who previously produced sixty banner variants per week might, with AI assistance, produce two hundred and then dedicate the remaining time to art direction, quality control, or brand system development. A media coordinator who spent Mondays pulling reports could now use that time for anomaly analysis and client-facing narrative development.
Roles that demand judgment, client trust, and cross-domain synthesis face less immediate pressure. Senior strategists, account directors, creative directors, and analytics leads are further from the substitution frontier because their output is less easily defined as discrete tasks. For principals, planning decisions regarding headcount should be based on task composition, not just job titles. A role where 80% of the work is automatable and 20% requires judgment is a candidate for restructuring, while a role with the inverse ratio is a candidate for capacity expansion.
The Governance Cost That Partially Offsets the Gain
Every dollar saved through task-layer compression comes with a governance cost that many agency P&L models overlook. The NIST AI Risk Management Framework aims to improve trustworthiness in the design, development, use, and evaluation of AI systems 5. Its generative AI profile specifically addresses risks related to accuracy, privacy, intellectual property, and content provenance—responsibilities agencies now bear on behalf of clients 4. These risks translate into tangible operational costs: establishing review workflows, logging prompts and outputs, verifying sources, conducting brand-safety checks, including client disclosure language in statements of work, and performing periodic audits of AI-generated content.
The scale of this exposure is not theoretical. Stanford HAI reported 233 AI incidents in 2024, a 56.4% increase over 2023 9. While this covers a broad range of AI use, not just agency-specific cases, the trend is what agency owners must factor in: as production volume increases, the reputational and legal risk associated with a single mishandled output expands, because more outputs are processed with less human review time.
A realistic model for principals acknowledges that governance overhead will absorb a significant portion of the gross technical efficiency gain. This does not negate the value of AI-enabled production but alters the optimal sequencing. Firms that establish the necessary review, logging, and client disclosure infrastructure before scaling volume will protect the margins they create. Firms that bypass these steps will likely incur costs later, often in the form of client disputes or retractions.
Where the Cost Actually Sits: A Portfolio Operator's View
This section shifts focus to principals managing a portfolio of client accounts within a five- to one-hundred-fifty-person firm, rather than in-house teams at a single brand. The levers discussed below assume multiple concurrent engagements, a mix of retainer and project revenue, and a P&L where labor costs and production costs are tracked separately.
The table below maps the primary levers to the specific efficiency denominator each one improves. Owner-controlled ranges are labeled as variables because agency-specific benchmarks are not available in the provided research, and creating them would misguide the planning exercise.
| Lever | Denominator It Improves | Typical Owner-Controlled Range | Evidence Anchor |
|---|---|---|---|
| Utilization rate lift on senior billable staff | Agency efficiency | Variable; gap between current and target billable hours | Aligning leadership, process, and resources 2 |
| Realization rate lift on booked accounts | Agency efficiency | Variable; gap between booked and collected rates | Aligning leadership, process, and resources 2 |
| Delivery workflow consolidation | Agency efficiency | Variable; hours removed from handoffs and status overhead | Aligning leadership, process, and resources 2 |
| AI-assisted content and creative production | Technical efficiency | Variable; task-layer share of production time compressed | 60–70% of employee time is automatable economy-wide 1 |
| AI-assisted media and reporting operations | Technical efficiency | Variable; report and analysis hours compressed | Inference cost fell more than 280-fold in ~18 months 9 |
| Governance and review overhead | Offsets technical efficiency gain | Variable; scales with output volume and client risk profile | NIST AI RMF trustworthiness controls 5 |
The macroeconomic context provides a reality check. Nonfarm business sector labor productivity grew only 0.3% in Q1 2026 10, indicating that neither efficiency lever guarantees automatic firm-level gains. Principals must model the potential gains, account for governance offsets, and strategically decide which lever to fund in the upcoming quarter.
Quantify and Eliminate Agency Production Overhead—Without Sacrificing Technical Precision
Access data-driven workflows that benchmark your delivery efficiency, automate technical execution, and maintain full oversight—enabling agency teams to scale output while preserving margins and control.
Sequencing the Next Four Quarters
The diagnostic insights and available levers dictate a specific order of operations. Agencies with a clear understanding of their utilization, realization, and delivery workflows can accelerate this schedule. However, those experiencing double-digit gaps in their operating metrics should proceed more deliberately.
- Quarter one should focus on the operating model. Reconstruct project accounting to identify scope leaks proactively, rather than during quarterly reviews. Establish and track utilization targets by role, and revise retainer scopes where logged hours consistently exceed priced hours. This foundational work does not require new tools and avoids the governance overhead associated with AI-enabled production. Aligning leadership, processes, and resource decisions is crucial for ensuring that all subsequent investments yield returns 2.
- Quarter two should be dedicated to establishing the governance layer before scaling AI production. This includes implementing review workflows, output logging, source verification, and incorporating client disclosure language into statements of work. Building this infrastructure upfront is more cost-effective than retrofitting it after an incident. The NIST risk framework provides a robust reference architecture for this purpose 5.
- Quarters three and four are for compressing the task layer. Content drafting, variant production, media reporting, and initial research should transition to AI-assisted workflows, with human oversight and judgment. The hours freed up should be reinvested into strategy, client retention, and account expansion, rather than leading to headcount reductions. The macroeconomic reminder remains relevant: Q1 2026 nonfarm productivity grew by only 0.3% 10. While the gains from AI are real, they are realized only by firms that have first addressed their operating model and established proper governance before implementing production compression.
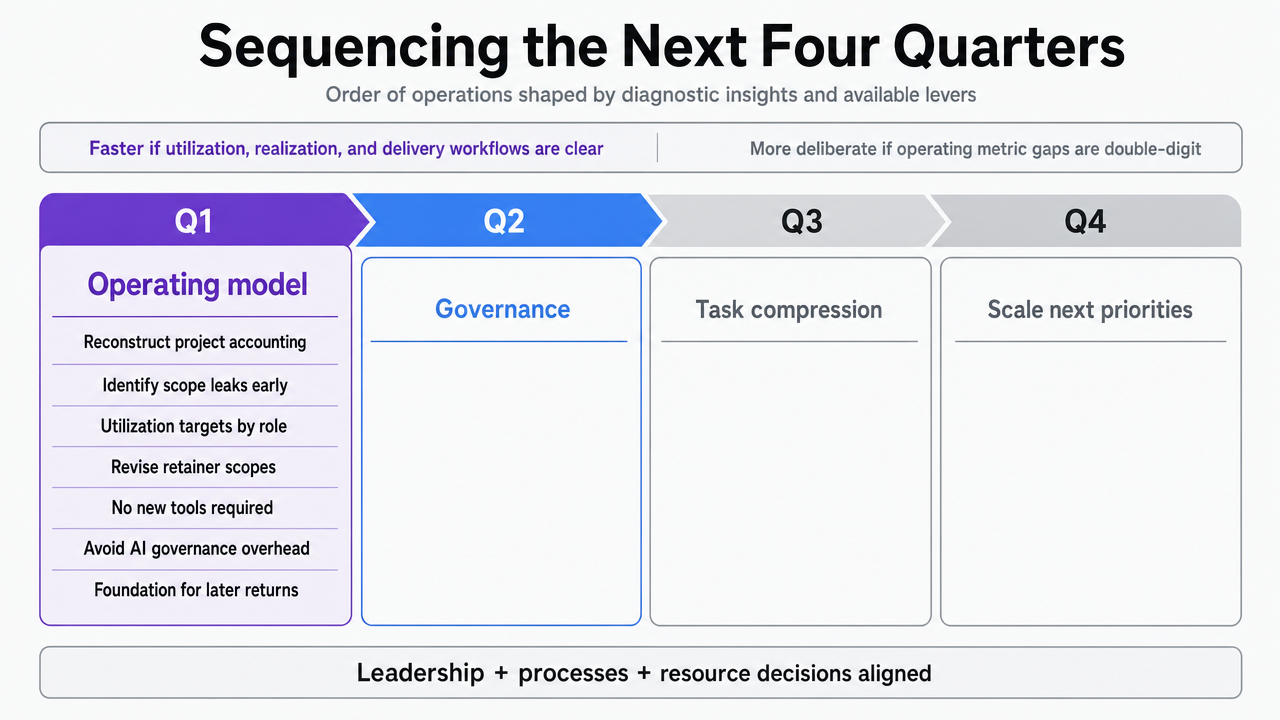 Visualize the four-quarter sequencing plan explicitly outlined in the section, mapping each quarter to its specific operational focus (operating model, governance, task compression)
Frequently Asked Questions
References
- 1.The economic potential of generative AI: The next productivity frontier.
- 2.Organizational efficiency.
- 3.Economy | The 2025 AI Index Report.
- 4.Artificial Intelligence Risk Management Framework: Generative Artificial Intelligence Profile.
- 5.AI Risk Management Framework.
- 6.Incorporating AI impacts in BLS employment projections.
- 7.Industry and occupational employment projections overview and highlights, 2024–34.
- 8.AI impacts in BLS employment projections.
- 9.AI Index 2025: State of AI in 10 Charts.
- 10.First Quarter 2026, Revised.