
Key Takeaways
- Budget creep stems from scope defined by deliverables, email-based approvals, and bundled pricing, so evaluate partners on cost-per-outcome rather than cost-per-deliverable.
- Decide which of five production models you are actually buying—full-service retainer, project agency, in-house, hybrid, or AI-augmented—since each concentrates costs differently and flexes differently with demand.
- Demand line-item fee disclosure and ask whether the agency takes principal media positions, because Forrester projects principal media will reach nearly 33% of agency billings by 2026 15.
- Score partners across six criteria: scope and SLA clarity, attribution capability, AI governance, pricing transparency, approval workflow design, and named accountability for scope creep.
- Replace deliverable counts with four unit metrics—cost per published asset, cost per ranked keyword, cost per qualified lead, and governed approval cycle time—to expose throughput gaps.
- AI-augmented execution can shift cost from labor to platform fees and reviewer time, but only delivers savings when a funded internal lead enforces approval-first workflow 16.
- Multi-location and multi-brand programs require partners whose per-asset cost stays stable as locations grow and whose approval workflow supports local reviewers without bottlenecks 10.
- Validate any partner with a 60-day review: baseline unit economics in days 1–20, run live work under the new SLA through day 45, then decide to renew, restructure, or replace 9.
Why agency budgets balloon even when the contract looks tight
Budget creep in content marketing engagements rarely appears as a direct line-item overage. Instead, it manifests as a gradual expansion of scope, prolonged approval cycles, and a lack of clarity in attribution that a standard master services agreement often fails to address. A VP might sign a retainer for twelve assets monthly, only to find that by the third quarter, the same retainer covers nine assets, two strategy decks, and a quarterly business review that was not initially requested.
The underlying economic pressures are intensifying. The CMO Survey's Spring 2024 report indicates that marketing spend averages 10.1% of company revenues, with CMOs facing increased pressure to justify these expenditures 3. Forrester's 2024 research on B2B marketers highlights a similar challenge: while budgets are slightly increasing, expectations are rising even faster. Partners are now required to link content output directly to business strategy, moving beyond mere deliverable shipment 5. The SaaS sector reflects this trend, with escalating customer acquisition costs necessitating more deliberate spending and stricter vendor scrutiny 4.
Three primary structural flaws contribute to budget issues in agency contracts:
- First, scope is often defined by the number of deliverables rather than by measurable outcomes.
- Second, approval processes rely on email threads instead of integrated workflows, leading to an uncontrolled increase in revision rounds.
- Third, pricing models frequently bundle creative, media, and production fees, making it difficult to ascertain the true unit cost per asset or per outcome.
The solution is not simply a cheaper retainer, but a fundamentally different approach to purchasing content production, one that prioritizes evaluation based on cost-per-outcome rather than cost-per-deliverable.
The real question: which content production model are you buying?
Five operating models, not one decision
Many agency reviews begin with an incorrect premise. The crucial decision is not which agency to hire, but rather which content production operating model best suits the company's needs and which partner type aligns with that model. Mid-market and enterprise programs typically employ five distinct configurations, each concentrating costs in different areas.
The full-service retainer agency consolidates strategy, production, and project management under a single vendor. Here, costs are primarily concentrated in account management hours and bundled fees, with deliverable counts serving as the visible output metric. In contrast, the project-based agency model eliminates the retainer floor but results in higher per-asset costs and requires ramp-up time for each new engagement.
An in-house team incurs fixed expenses for payroll, benefits, and tools, with capacity that does not easily adjust to fluctuating campaign demands. Forrester's analysis of in-house agency development indicates that internal teams are effective only when CMOs adequately fund the necessary budgets, talent, and technology to meet specialized requirements 16. Consequently, under-resourced in-house groups can become the most expensive option per asset produced.
The hybrid model involves a lean internal lead overseeing a network of freelancers and specialized agencies, balancing coordination overhead with increased flexibility. TrinityP3 characterizes this as a trade-off between speed, brand intimacy, specialist capabilities, and tolerance for operational risks associated with fixed teams 10. The fifth model, an AI-augmented execution stack managed by a small internal team, shifts costs from labor hours to platform fees and internal reviewer time. The key decision for a VP is to identify which of these five models they are effectively purchasing when signing a contract.
Comparing cost concentration across models
Cost concentration is a critical factor determining whether a content production model will scale efficiently or become bloated. Two key ratios define the financial parameters for any comparison. The CMO Survey's Spring 2024 report shows that average marketing spend is 10.1% of company revenues across various industries 3. Within this allocation, 48% of B2B marketers, according to the 2024 CMI/MarketingProfs study, dedicate less than 10% of their marketing budget to content 1. For a company with $200 million in revenue, this translates to an annual content budget often well under $2 million, making the distribution of costs more significant than the headline retainer figure.
The following table serves as a framework for analysis, not a definitive pricing guide. It is designed for populating with internal benchmarks to compare cost-per-published-asset and cost-per-qualified-lead across different models, rather than focusing solely on total spend.
| Operating model | Where cost concentrates | Primary variable inputs | Flex behavior |
|---|---|---|---|
| Full-service retainer | Account management, strategy decks, bundled production | Monthly retainer; revision-round cap; media markup | Low; fixed floor regardless of output |
| Project agency | Per-engagement ramp, scoping, senior creative hours | Project fee; ramp weeks; per-asset rate | High; capacity ends when project ends |
| In-house team | Fully-loaded FTE cost, tooling, recruiting | Headcount; loaded salary multiplier; software stack | Low; capacity tied to payroll |
| Hybrid lead + freelancers | Coordination hours, freelancer rates, QA | Internal lead salary; freelancer day rate; tool stack | Moderate; flexes with roster availability |
| Lean lead + AI execution platform | Platform fees, reviewer time, approval workflow | Platform subscription; reviewer hours per asset; QA cycles | High; output scales without headcount add |
Consider a scenario where twelve assets are produced monthly across each model. A retainer's cost appears predictable until revision cycles diminish the per-asset value. In-house costs seem contained until campaign volume decreases, yet fixed payroll expenses continue. The AI-augmented platform model shifts the primary cost driver from labor to reviewer time, a variable that a VP can directly control.
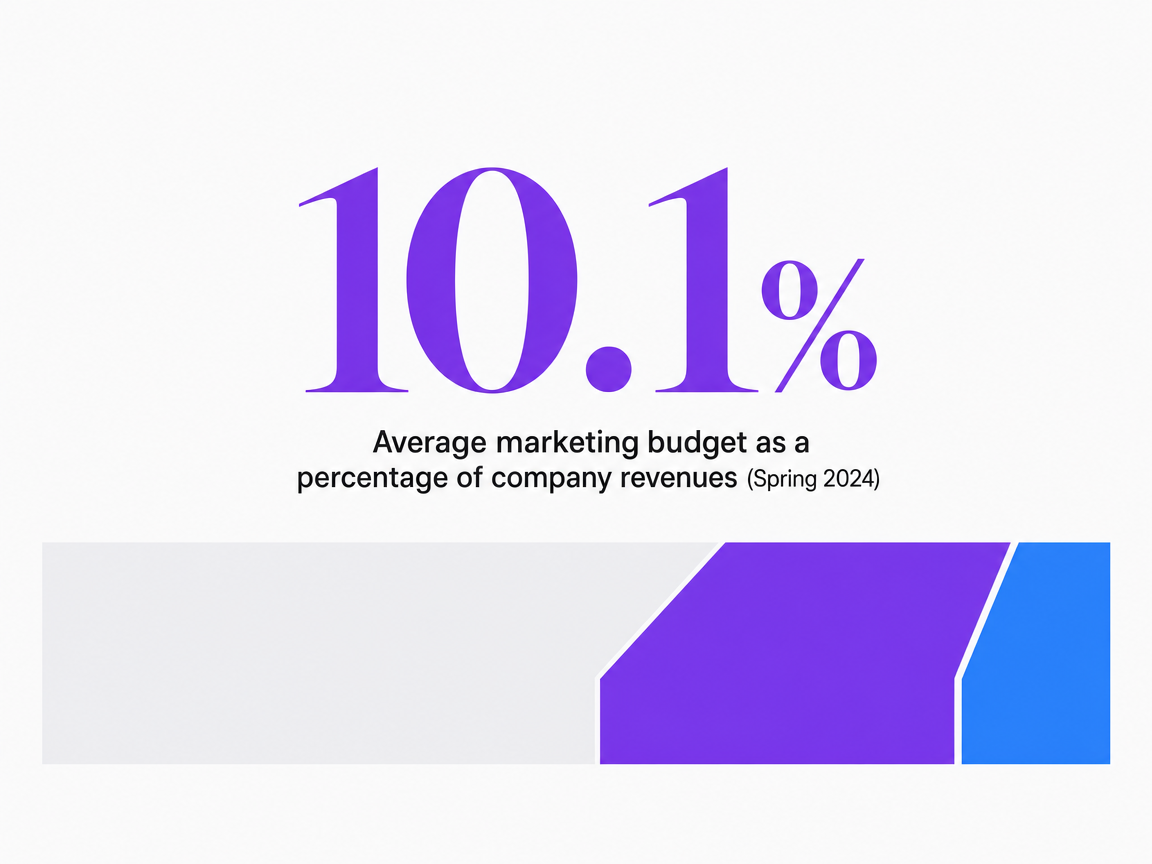 Average marketing budget as a percentage of company revenues (Spring 2024)
Average marketing budget as a percentage of company revenues (Spring 2024)
Experience full-scale content execution risk-free
Test real campaigns and measure impact before committing to any long-term content marketing changes.
The transparency gap most procurement reviews miss
Most agency RFP evaluations prioritize creative samples, case studies, and team biographies, often overlooking the line items where actual profit margins reside. This oversight is becoming more pronounced as agency revenue models increasingly incorporate principal media, where agencies purchase inventory on their own balance sheets and resell it to clients with undisclosed markups and performance guarantees.
Forrester projects that principal media will constitute nearly 33% of total agency billings by 2026, fundamentally altering how agencies generate profit and how their pricing appears on client invoices 15. While this forecast is directional, it signals a structural shift already impacting the scoping of content and distribution retainers. When a significant portion of agency revenue derives from resold inventory rather than transparent fees, comparing cost-per-asset and cost-per-impression across vendors becomes unreliable.
The implications for content marketing are subtle but significant. Agencies offering integrated content-plus-distribution packages often bundle paid amplification, sponsored placements, and programmatic spend into the retainer. If any part of this media involves principal arrangements, the associated margin remains hidden from the buyer. Two agencies quoting identical retainers could operate on vastly different underlying economics, with the seemingly cheaper option potentially carrying a higher effective markup once media costs are fully accounted for.
Three key diligence steps can bridge this transparency gap:
- Demand line-item fee disclosure, clearly separating creative production, account management, paid media commission, and any principal media inventory.
- Formally inquire whether the agency or its subsidiaries take principal positions on media resold to the client, and request annual reaffirmation of this disclosure.
- Benchmark per-asset and per-channel costs against an alternative model, such as an in-house estimate or an AI-platform quote, to ensure comparisons are based on unit economics rather than just retainer headlines.
The same principle applies to performance guarantees that appear attractive. A guaranteed cost-per-lead or cost-per-impression is only valuable if the underlying inventory pricing is transparent. Otherwise, the guarantee functions as a margin-generating tool disguised as risk-sharing. Procurement frameworks that utilize structured RFPs, predefined scoring criteria, and SLA-level disclosure are specifically designed to uncover such opacity 7, 9. Marketing leaders who collaborate with procurement on agency reviews consistently report enhanced visibility into fee structures and more favorable negotiated terms 6.
A six-criterion scoring rubric for content partner selection
Scope clarity and SLA structure
Scope clarity is fundamental to the enforceability of all other contract terms. A robust scoring rubric assigns significant weight to this criterion and evaluates it against specific details rather than general descriptions. Sievo's vendor-selection framework considers SLA definition a prerequisite for awarding business, not a post-contract negotiation 8. Marketing Procurement iQ's guidance emphasizes the same point: scope, remuneration model, and expectations must be clearly aligned in writing before pitches, otherwise, the engagement will absorb these ambiguities later 7.
Evaluate each prospective partner on four aspects of scope mechanics:
- Are deliverable types defined with specific formats, lengths, and acceptance criteria, or merely by count?
- Does the SLA specify limits on revision rounds, turnaround times, and triggers for out-of-scope work?
- Is there a change-order process that costs incremental work using the same units as the base agreement?
- Does the contract name the specific individual, not just the role, accountable for scope creep on the agency side?
Partners excelling in this area typically provide a sample SLA before the RFP concludes. Those performing poorly often default to generic retainer language and resist itemizing turnaround windows. This distinction becomes evident within the first three months of the engagement.
Pipeline attribution capability over portfolio polish
While portfolio reviews and case studies are designed to impress, attribution capability is often an area agencies prefer not to highlight. This rubric reverses that priority. Forrester's 2024 research on B2B marketers asserts that valuable agencies and platforms are those that can link content output to business strategy and implement data-driven decisions, rather than those merely producing highly polished samples 5.
Assess attribution with four key diligence questions:
- How does the partner instrument content to track its journey from first touch to qualified pipeline?
- Which systems do they integrate with, and who maintains these integrations?
- What is their definition of a qualified lead, and does it align with the company's CRM definition?
- What reporting cadence connects content output to pipeline movement, broken down by asset and topic cluster?
Score responses based on tangible evidence, not just promises. A partner who can present a redacted attribution dashboard from a previous client will score higher than one who merely describes their methodology. Similarly, a partner whose attribution relies entirely on the client's existing analytics stack will score lower than one that operates its own tracking layer.
AI governance as a procurement diligence checkpoint
The use of generative AI is now standard in content production, but robust governance is not. The 2024 CMI/MarketingProfs study of 894 B2B marketers found that 72% use generative AI in their workflows, yet 61% lack established guidelines for its use 1. This disparity is critical because AI activity will occur regardless; the question is whether the partner operates with a defined policy or without one.
Treat AI governance as a procurement diligence checkpoint with five specific tests:
- Does the partner formally disclose where AI is used in the content workflow, specifying stages and asset types?
- Are there written guidelines addressing training data, IP indemnification, and human review steps?
- Who is responsible for approving AI-assisted output before client delivery, and at what level?
- How does the partner manage client confidential data within AI tools, including prompts and uploaded materials?
- What are their version-control practices for prompts and model outputs, ensuring content provenance is traceable?
A partner providing documented policies for all five points will score highest. A partner offering only generalities will score lowest, irrespective of the quality of their AI-assisted samples. The diligence here focuses not on whether the partner uses AI, but on whether their AI usage introduces risks the client might inherit, and if their workflow includes a mandatory approval step before content is delivered.
Pricing transparency and approval workflow design
The final two criteria evaluate how a partner generates revenue and how work progresses from concept to publication. Both factors influence budget behavior more significantly than the headline retainer figure.
Regarding pricing transparency, the rubric favors detailed line-item disclosure. Creative production, account management, paid media commission, third-party tool pass-throughs, and any principal media positions should each be listed separately, with the methodology for each rate documented. Amazon Business's procurement guidance emphasizes standardizing workflows and using analytics to detect unusual spending patterns, which is only possible with a transparent invoice 12. Partners who aggressively bundle services will score lower, even if their bundled price appears competitive.
For approval workflow, the rubric rewards a single, governed loop. Evaluate how proposals, drafts, revisions, and final publication approvals flow between the partner and the internal team. Email-based workflows score lowest. Shared trackers fall in the middle. A single approval system with timestamps, version history, and an audit trail per asset scores highest. An approval-first execution approach is crucial for preventing revision cycles from silently consuming retainer funds.
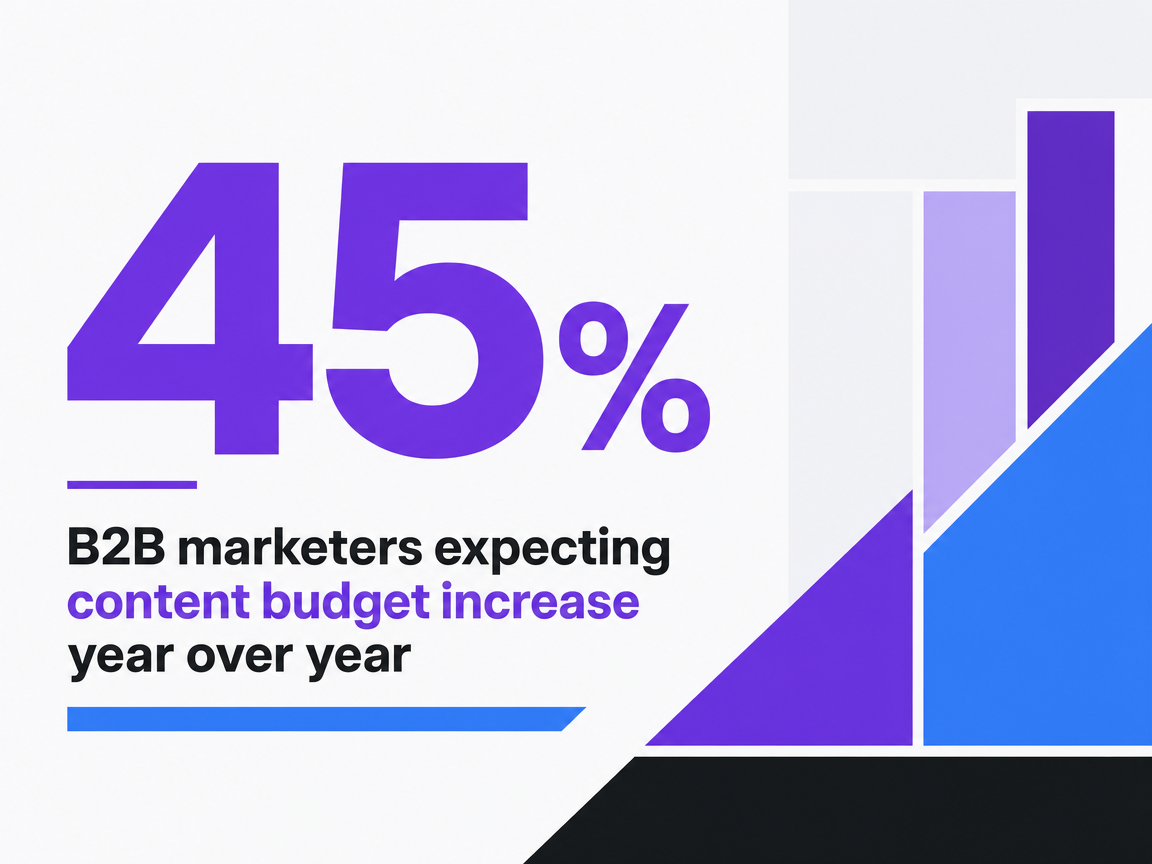 B2B marketers expecting content budget increase year over year
B2B marketers expecting content budget increase year over year
See How Leading Brands Streamline Content Execution Without Agency Overhead
Request a walkthrough of unified AI-powered workflows that help enterprise marketing teams deliver measurable results and predictable pipeline—without expanding headcount or juggling multiple agency contracts.
Unit economics: what to measure instead of deliverable counts
Deliverable counts are an inadequate metric. Knowing that twelve assets are produced monthly provides no insight into program ROI and offers no incentive for partners to discontinue underperforming topics. Four unit-economic metrics can replace simple counts and are applicable across any operating model.
Cost per published asset : A crucial denominator often overlooked. Calculate this by dividing total fees, including account management and tooling, by the number of assets actually published to a live URL within the period. Drafts that never made it past revisions are excluded. This metric reveals the disparity between contracted volume and actual throughput.
Cost per ranked keyword : Links production directly to organic visibility. Divide the period's total cost by the number of target keywords that achieved a defined ranking position (e.g., positions one through ten) during the measurement window. A partner producing twelve assets that result in two ranked keywords operates on different economics than one producing eight assets that yield nine.
Cost per qualified lead : Completes the loop to pipeline impact. Use the company's CRM-defined qualification stage, not the partner's. Insight Partners' 2024 SaaS research clearly states that rising customer acquisition costs compel CMOs to adopt measured spending, scrutinizing vendors based on direct pipeline contribution rather than activity volume 4.
Governed approval cycle time : Measures the efficiency of the workflow itself. Track the median number of days from brief approval to publication, categorized by asset type. Extended cycles silently inflate cost per asset, as reviewer hours and rework consume budget without appearing as a direct invoice line item. Partners who perform well on the first three metrics often share a common characteristic: their approval workflow operates within a single system, not across disparate inboxes.
Where AI-augmented execution changes the math (and where it doesn't)
The AI-augmented operating model warrants significant scrutiny in any evaluation. BCG's analysis of agentic marketing indicates that early adopters who fully integrate AI agents into daily operations can triple returns, speed, and content volume 11. While this figure is often cited, its scope is important. It refers to early movers with AI agents deeply embedded in workflow, governance, and analytics, not casual users running prompts alongside a traditional retainer. As a benchmark for full integration, the 3x figure is directional; as a generic AI productivity claim, it can be misleading.
When the math works, several aspects change. The primary cost input shifts from agency labor hours to platform fees plus internal reviewer time, significantly reducing cost per published asset and shortening governed approval cycle time. Output can scale without increasing headcount, which is a key metric for many VPs. Attribution also becomes clearer because production, publishing, and tracking are consolidated within one system, eliminating handoffs between vendors.
What remains unchanged is the human element: strategy, brand judgment, and final approval still require human oversight. Forrester's caution regarding in-house builds applies here as well: under-resourced internal owners will produce suboptimal output regardless of the tools they use 16. An AI execution stack without a dedicated internal lead to govern it will encounter the same scope-drift issues as a retainer agency, albeit with a different invoice format. The financial benefits only materialize when an approval-first workflow is enforced and adequate reviewer capacity is funded.
Automate Multi-Channel Content Execution—Without Expanding Your Team
Gain instant access to a unified AI-driven platform streamlining content, SEO, PPC, and social workflows—enabling predictable pipeline growth and measurable conversion impact for large-scale teams, all with approval-first controls and zero agency overhead.
If you manage multiple locations or a portfolio of brands
The selection criteria shift when content needs to be deployed across numerous locations, such as ten dental practices, forty senior living communities, or a portfolio of franchise brands. This scenario targets operators managing multi-location or multi-brand programs, rather than single-P&L marketers, and involves distinct cost drivers.
Content requirements per location (e.g., service pages, location-specific pages, review-driven posts, compliance-sensitive copy) escalate more rapidly than traditional retainer scopes can accommodate. A conventional agency, typically priced for one brand at twelve assets per month, rarely scales linearly to thirty locations without a proportional increase in retainer fees, as account management hours grow with each added entity. TrinityP3's framework is directly relevant here: specialist capability becomes less critical than throughput and brand intimacy when the same campaign must resonate across multiple markets 10.
Evaluate multi-location partners on three additional criteria:
- Can per-location output be produced without a proportional increase in account management overhead?
- Does the approval workflow support location-level reviewers without creating a single bottleneck?
- Does the cost-per-published-asset remain stable as locations are added, or does it increase?
Partners unable to provide written answers to the third question will likely absorb the portfolio's growth as increased margin.
Putting the rubric into a 60-day partner review
A scoring rubric is only valuable if it proves effective in a real engagement. The most efficient way to validate a content partner, whether incumbent or new, is through a structured 60-day review that assesses the criteria against actual work rather than just pitch materials. Ivalua's vendor-selection framework considers this post-award validation crucial for confirming whether predefined scoring criteria were accurate in practice 9.
- Days 1 through 20 — establish baselines. Implement the SLA within a single approval system, retrieve the partner's output from the previous two quarters, and calculate the cost per published asset, cost per ranked keyword, and median approval cycle time. These figures will serve as the comparison floor.
- Days 21 through 45 — run the rubric live. Assign a defined batch of work under the new SLA, evaluate scope adherence and revision-round behavior against the contract, and require line-item fee disclosure on the period's invoice. A joint review with procurement during this phase can enhance the insights gained 6.
- Days 46 through 60 — culminate in a decision. Compare the baseline metrics with the live batch results, document the partner's performance against each of the six criteria, and verify that AI governance disclosures align with actual workflow practices 1. The outcome will be a recommendation to renew, restructure, or replace, grounded in unit economics rather than historical relationships.
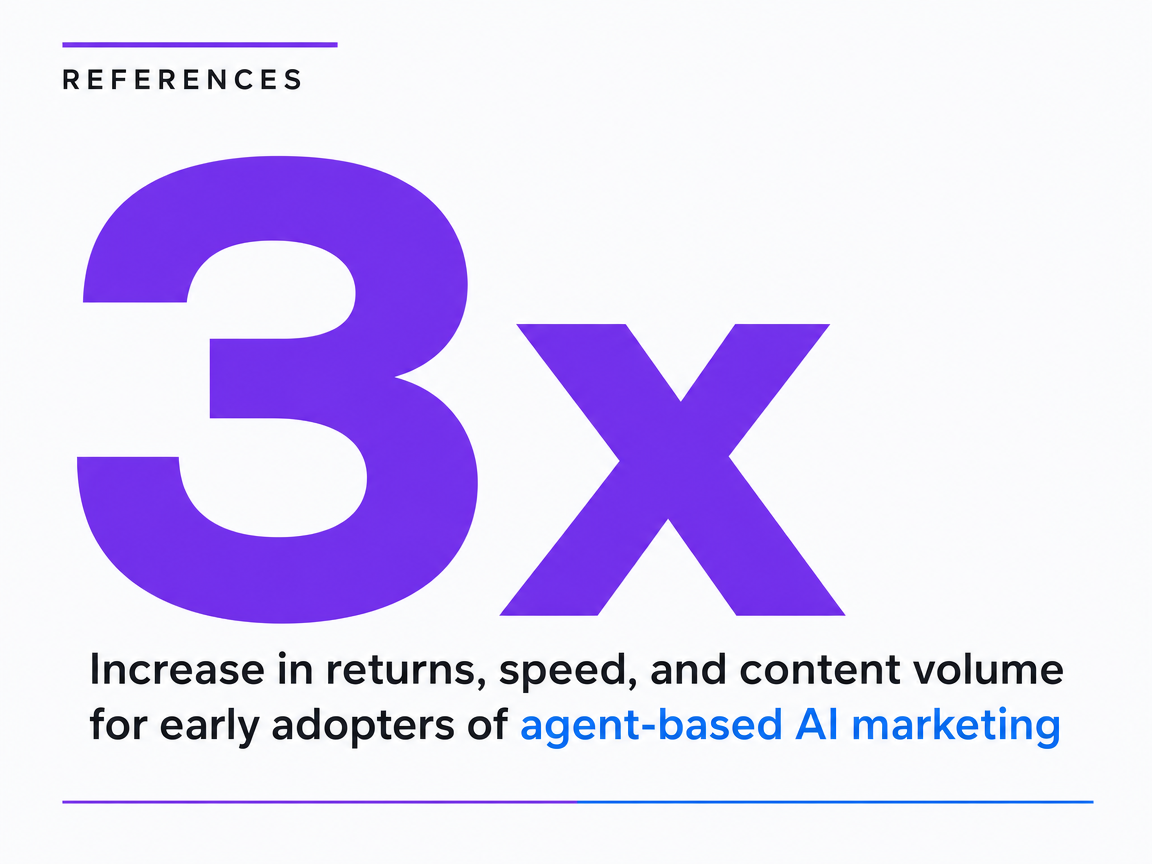 Increase in returns, speed, and content volume for early adopters of agent-based AI marketing
Increase in returns, speed, and content volume for early adopters of agent-based AI marketing
Frequently Asked Questions
References
- 1.B2B Content Marketing Benchmarks, Budgets, and Trends: Outlook for 2024 [Research].
- 2.Global content marketing budget changes 2023–2024.
- 3.Managing Marketing Technology, Growth, and Sustainability: The CMO Survey Highlights and Insights Report, Spring 2024.
- 4.SaaS marketing benchmarks: 3 budgeting and strategy trends for 2024.
- 5.B2B Marketers Expect To Do More With More (But It’s Not As Good As It Sounds).
- 6.Latest research shows CMOs benefit greatly from better working relationships with procurement.
- 7.Agency Selection: The Art and Science of selecting the right agency partner.
- 8.The Marketing Procurement relationship: tips for collaboration.
- 9.Vendor Selection Process: Steps, Criteria & Checklist Guide.
- 10.In-House vs Marketing Agency: Which Is Better?.
- 11.CMOs Who Move First in Agentic Marketing Will Win.
- 12.The top 10 procurement best practices your organization needs.
- 13.The CMO Survey: Marketing Budgets Return to Near Pre-Covid Levels.
- 14.2026 CMO Survey | Deloitte US.
- 15.Predictions 2026: Marketing Agencies Resign Their Agency.
- 16.Rethink The In-House Agency Hype.