
Key Takeaways
- Gross margin per account belongs at the top of every client review, with sub-40% accounts requiring repricing, restructured delivery, or release within 60 days.
- Net revenue retention below 95% signals contraction that typically precedes churn by two to three billing cycles, while expansion velocity reveals which accounts compound.
- Days sales outstanding past 35 days on net-30 terms means the client is financing their program off the agency's balance sheet and rarely respects scope either.
- Experience alignment scoring screens for the 7% of brands improving CX 2versus the 25% declining, identifying which retainers will defend budgets in downturns.
- Strategic fit and channel absorption capacity predict expansion ceiling, since 72% of B2B firms selling across seven or more channels grew market share 7.
- Scope discipline tracked as variance times decision-cycle length exposes accounts where every recommendation gets repriced in unbilled hours through buying-committee friction.
- A composite health score weighting financial signals 60% and behavioral 40% drives quarterly capacity reallocation, moving senior hours from bottom to top quartile before 2026 cuts force the issue 8.
Why client grading now decides which agencies survive 2026
Forrester projects a 15% cut to agency headcount in 2026, following an average 8% reduction in 2025 8. This compression is not an industry-wide layoff story; it is a margin story. Agencies entering 2026 with the same delivery cost structure and client mix as in 2023 are running unprofitable accounts on borrowed time.
Agencies absorbing this pressure share one habit: they grade clients on measurable signals tied directly to gross margin per account, not on relationship warmth or logo prestige. Client quality has stopped being a judgment call. It is now a composite score built from unit economics, retention and expansion, payment behavior, experience maturity, strategic fit, scope discipline, and a rolled-up health rating.
This matters because delivery capacity is finite and increasingly expensive to add. McKinsey's work on B2B growth allocation finds that firms using analytics to direct investment toward high-value accounts outperform their markets by meaningful margins 10. The same logic applies inside an agency book: senior strategist hours, paid media oversight, and production capacity should flow to the top quartile, not be consumed by clients who pay slowly, scope-creep weekly, and stagnate annually.
The seven metrics below give agency owners a defensible way to decide which clients to keep, grow, reprice, or release before the 2026 cuts force the decision.
Metric 1: Gross Margin per Account (the LTV:CAC successor)
Gross margin per account is the single number that should sit at the top of every client review. The calculation is direct: annual retainer plus project revenue, minus fully loaded delivery cost (strategist hours, production hours, paid media management, tools allocated, and a fair share of account management overhead), divided by revenue. While LTV:CAC was useful when agencies were chasing logos, once a book is established, what matters is how much of each invoiced dollar survives delivery.
The threshold that triggers action sits around 50% gross margin. Accounts above 55% subsidize the rest of the book and earn senior attention. Accounts between 40% and 55% are watch-list candidates that need either a scope reduction, a price increase at renewal, or a delivery model change. Anything under 40% is losing money once a realistic share of leadership and rework is loaded in, and the operator has three choices: reprice within 60 days, restructure delivery to cut hours, or release the account.
Two delivery realities distort this number if ignored. First, senior-strategist hours are the most expensive input on the P&L, so accounts that pull principals into weekly calls quietly destroy margin even when revenue looks healthy. Second, AI-assisted production now shifts the cost curve on content, reporting, and routine optimization work. Deloitte's analysis of next-gen B2B service models notes that automation can drive revenue and reduce service cost in the same motion 6. Agencies that recompute gross margin under an AI-assisted delivery model often find mid-tier accounts move from the offboard list to the keep list.
Score this metric monthly, not quarterly. Margin erosion shows up in hours before it shows up in revenue.
Metric 2: Net Revenue Retention and Expansion Velocity
Net revenue retention (NRR) measures what a client's spend looks like twelve months from now, holding the cohort fixed. The calculation: starting ARR for the account, plus expansion, minus contraction and churn, divided by starting ARR. An account at 100% NRR is flat. An account at 120% is paying for the agency's growth. An account drifting toward 85% is signaling exit, regardless of how friendly the quarterly review felt.
The threshold for action sits at 110% NRR. Accounts above 110% NRR justify a senior strategist's discretionary hours and warrant a formal expansion plan at every quarterly review. Accounts between 95% and 110% are stable but stagnant — they need a documented growth thesis within one quarter or a price increase at renewal to defend margin. Anything below 95% is contracting, and contracting accounts almost always precede churned accounts by two to three billing cycles.
Expansion velocity matters as much as the absolute number. An account that took eighteen months to add a second service line is structurally different from one that absorbed three new scopes in nine months, even if both currently sit at 115% NRR. The faster-expanding account has demonstrated buying-committee alignment and budget elasticity — the two conditions that make expansion repeatable. McKinsey's research on experience-led growth finds that companies focused on delighting existing customers extract significantly more value from their current base than those chasing new logos 4. The same compounding logic applies inside an agency book: expansion revenue carries dramatically higher gross margin than new-logo revenue because acquisition cost is already sunk and onboarding friction is gone.
Track NRR by cohort, not by client. Cohort-level NRR exposes whether the agency's delivery model is producing expansion across the book or whether two outlier accounts are masking flat performance everywhere else.
Assess Client Quality Metrics in Live Campaigns
Test real-time client assessment workflows and measure profit impact using actual campaign data during your trial.
Metric 3: Payment Behavior and Days Sales Outstanding
Days sales outstanding (DSO) is the metric most agency owners under-weight until cash flow tightens. The calculation: accounts receivable divided by trailing revenue, multiplied by the days in the period. An account invoiced on net-30 that consistently pays in 52 days is financing its own marketing program off the agency's balance sheet — and forcing the agency to carry payroll for work already delivered.
The threshold for action sits at 35 days for net-30 terms. Accounts paying within 30 days are operating as intended and require no intervention. Accounts drifting between 35 and 50 days warrant a payment-terms conversation at the next renewal, typically a move to monthly prepay or a 2% early-pay discount funded by a base-rate adjustment. Anything past 60 days is a working-capital problem that compounds: every additional 30 days of float on a six-figure retainer is equivalent to extending an unsecured loan at the agency's cost of capital.
Two patterns flag deeper risk:
- First, payment slippage that worsens quarter-over-quarter usually precedes a procurement-driven scope renegotiation or a churn event by one to two billing cycles.
- Second, accounts that dispute invoices line-by-line — even when they ultimately pay — consume finance and account-management hours that never get billed back.
Both patterns should reduce the account's composite health score regardless of how its margin or NRR look on paper. Cash that arrives late is worth less than cash that arrives on time, and accounts that don't respect terms rarely respect scope either.
Metric 4: Experience Alignment Score
Experience alignment measures whether a client's own customer experience maturity is rising, flat, or eroding — and whether that trajectory matches the agency's delivery model. The calculation blends three inputs: the client's year-over-year CX or NPS movement (or, where unavailable, a proxy like review velocity and sentiment), the consistency between their brand promise and their actual customer-facing execution, and the internal capability to act on experience data. Forrester's Total Experience framework treats these three layers — brand, customer, and employee — as one growth system, and finds that revenue impact multiplies when they move in alignment 3. Agencies should score the client on a 1–5 scale across each layer, then average.
The threshold for action sits at 3.5. Clients above 4.0 are CX-mature, defend their programs in downturns, and renew at higher tiers because they can see the revenue lift directly. Clients between 3.0 and 3.9 are coachable — they accept experience-led recommendations but need the agency to build the measurement case. Anything below 3.0 indicates a client whose internal experience is deteriorating faster than any campaign can compensate for, and those accounts churn within twelve to eighteen months regardless of media performance.
The macro signal matters here. In 2025, 25% of US brand customer experience rankings declined while only 7% improved 2. This tells agency owners that the median client is drifting backward on experience, not forward. An agency book that mirrors the population will see roughly three to four times more clients deteriorating than improving on this dimension, which puts pressure on the agency to identify the rising 7% early and concentrate senior strategist time there. Forrester's customer-obsessed cohort posted 41% faster revenue growth and 49% faster profit growth than peers 1 — those are the clients whose retainers compound, and the experience alignment score is the screen that surfaces them before competitors notice.
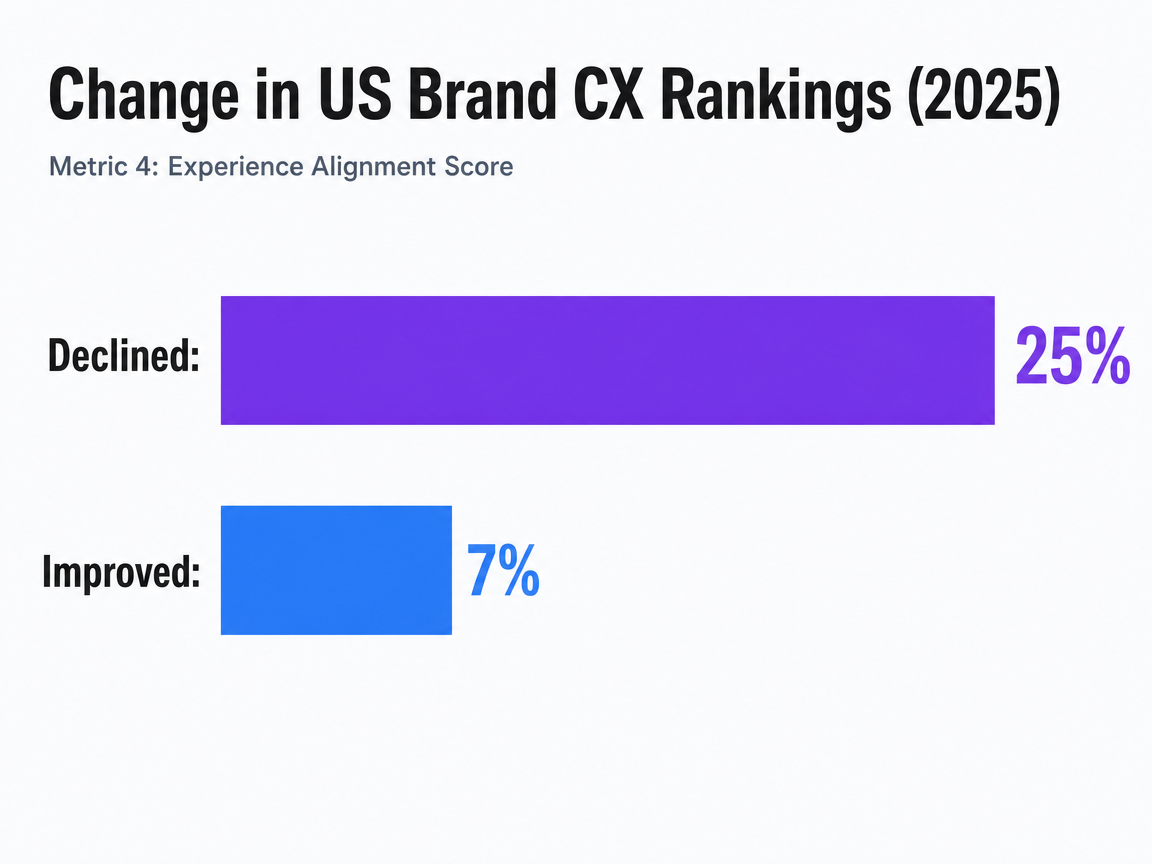 Change in US Brand CX Rankings (2025)
In 2025, 25% of US brands saw their customer experience rankings decline, while only 7% improved, indicating overall stagnation.
See How Leading Agencies Use Data-Driven Metrics to Maximize Client Profitability
Get a tailored walkthrough of advanced client quality assessment frameworks proven to increase margins and operational efficiency in multi-client agency environments.
Metric 5: Strategic Fit and Channel Absorption Capacity
Strategic fit measures whether a client's go-to-market structure can absorb the kind of program an agency is built to deliver. The calculation is a 1–5 rating across four dimensions:
- Number of active acquisition channels the client can support operationally
- Internal owner accountability for each channel
- Data infrastructure quality (CRM hygiene, attribution, conversion tracking)
- Budget elasticity across a 12-month horizon
The four sub-scores average into a single fit rating.
The threshold for action sits at 3.5. Clients above 4.0 can run coordinated multi-channel programs and absorb expansion scopes as fast as the agency can package them — these accounts are where retainer growth compounds. Clients between 3.0 and 3.9 are single-channel buyers whose ceiling is capped until they invest in operational capacity; the agency should either price for that ceiling or build a 90-day plan to lift the score. Anything below 3.0 is structurally mismatched — the client cannot consume what the agency sells, and the relationship will erode into scope disputes within two renewal cycles.
The seven-channel threshold for B2B market-share growth
The channel dimension is the most predictive. McKinsey found that 72% of B2B companies selling via seven or more channels grew market share, while single- and dual-channel sellers were significantly more likely to lose ground 7. For agencies, that finding inverts into a screening rule: clients capable of operating seven or more coordinated channels carry a structurally higher expansion ceiling than clients still running two or three. A client running paid search, organic, and email but unable to staff social, content, lifecycle, and partnerships is not a multi-channel account — it is a three-channel account with three more revenue lines the agency will never invoice.
Score strategic fit at onboarding and again every six months. A client whose fit rating is rising signals an expansion opportunity worth a senior strategist's pitch time; a client whose rating is falling signals a renewal at flat or reduced scope, not a growth conversation.
Metric 6: Scope Discipline and Buying-Committee Friction
Scope discipline measures the gap between what the agency contracted to deliver and what it actually delivered, weighted by the friction required to get approvals through the client's buying committee. The calculation has two parts:
- Scope variance: hours delivered against hours scoped, tracked per engagement and rolled up monthly.
- Decision-cycle friction: average days from recommendation submitted to recommendation approved, plus the number of stakeholders involved in each material decision.
Multiply variance by cycle length to get a single friction index per account.
The threshold for action sits at 115% scope variance or a decision cycle longer than 14 days. Accounts running at 100–110% variance with sub-10-day approvals are operating cleanly — the agency can plan capacity around them. Accounts between 115% and 130% variance, or with 14–25-day decision cycles, need a documented change-order process and a designated single approver within 30 days. Anything beyond 130% variance or 25-day cycles is structurally unprofitable regardless of headline retainer size, because every recommendation is being repriced in unbilled hours.
Buying-committee complexity is the underlying driver. Gartner's B2B buying model identifies six stages — problem identification, solution exploration, requirements building, supplier selection, validation, and consensus creation 9 — and high-friction clients drag every in-flight recommendation back through stages four and six on each approval cycle. A creative concept that requires legal, brand, procurement, and a divisional VP to re-validate is not a scope problem the agency can solve with better briefs; it is a structural cost the agency must price for or refuse.
Score scope discipline weekly during the first 90 days of any new engagement, then monthly. Friction patterns set in early and rarely improve without a contract amendment that names approvers, caps revision rounds, and ties out-of-scope work to a published hourly rate.
Metric 7: Composite Client Health Score and Capacity Reallocation
The first six metrics are diagnostic. The seventh is operational: a single rolled-up composite client health score that ranks every account in the book against the same denominator and feeds a quarterly capacity-reallocation decision. Forrester's Total Experience framework makes the case that single-metric grading misses how brand, customer, and employee signals compound — revenue impact multiplies when those layers move together rather than in isolation 3. The same logic governs client grading: gross margin, retention, payment, experience, fit, and scope discipline only predict account profitability when they are weighted, normalized, and reviewed as one number.
Weighting the seven signals into one score
The composite score should weight financial signals roughly 60% and behavioral signals 40%. A defensible default:
- Gross margin — 25%
- Net revenue retention — 15%
- Payment behavior — 10%
- Strategic fit — 15%
- Experience alignment — 15%
- Scope discipline — 10%
- Qualitative override held by the managing partner for signals not yet in the model — 10%
Each metric normalizes to a 1–5 scale against its action threshold, then multiplies by its weight.
Accounts scoring above 4.0 sit in the top quartile and earn first call on senior strategist time. Accounts between 3.0 and 4.0 are the working middle of the book — profitable today, but only if delivery stays disciplined. Anything below 3.0 enters a 90-day decision window: reprice, restructure, or release. McKinsey's analytics-led growth work finds that B2B firms using advanced data and AI to allocate investment outgrow their markets by meaningful margins 10, and the same applies inside an agency: ranking the book quarterly turns client management from reactive to allocative.
Reallocating delivery hours from bottom quartile to top quartile
The reallocation decision is what gives the scorecard its teeth. Forrester forecasts a 15% reduction in agency jobs in 2026, following an average 8% headcount cut in 2025 8. An agency cannot absorb that compression by trimming evenly across the book — the math only works if delivery hours migrate from bottom-quartile accounts to top-quartile ones before the cuts land.
The reallocation works as a variable equation rather than fixed dollar figures. Consider a book where bottom-quartile accounts consume roughly 30% of senior strategist hours while producing closer to 12% of gross margin. Shifting half of those hours to top-quartile accounts — where blended gross margin runs 20 to 30 points higher — recovers more contribution than a proportional staff cut would.
| Quartile | Share of accounts | Senior hours allocated (before) | Senior hours allocated (after) | Action |
|---|---|---|---|---|
| Top (score > 4.0) | 25% | 30% | 50% | Expansion plan, principal time |
| Upper-mid (3.5–4.0) | 25% | 25% | 30% | Hold and protect margin |
| Lower-mid (3.0–3.5) | 25% | 15% | 15% | Reprice at renewal |
| Bottom (< 3.0) | 25% | 30% | 5% | Restructure or release |
The hours released from the bottom quartile are the same hours the 2026 headcount forecast is about to take involuntarily. Agencies that run the reallocation deliberately preserve their senior bench. Agencies that wait cut the bench across the board, including the strategists serving their best accounts.
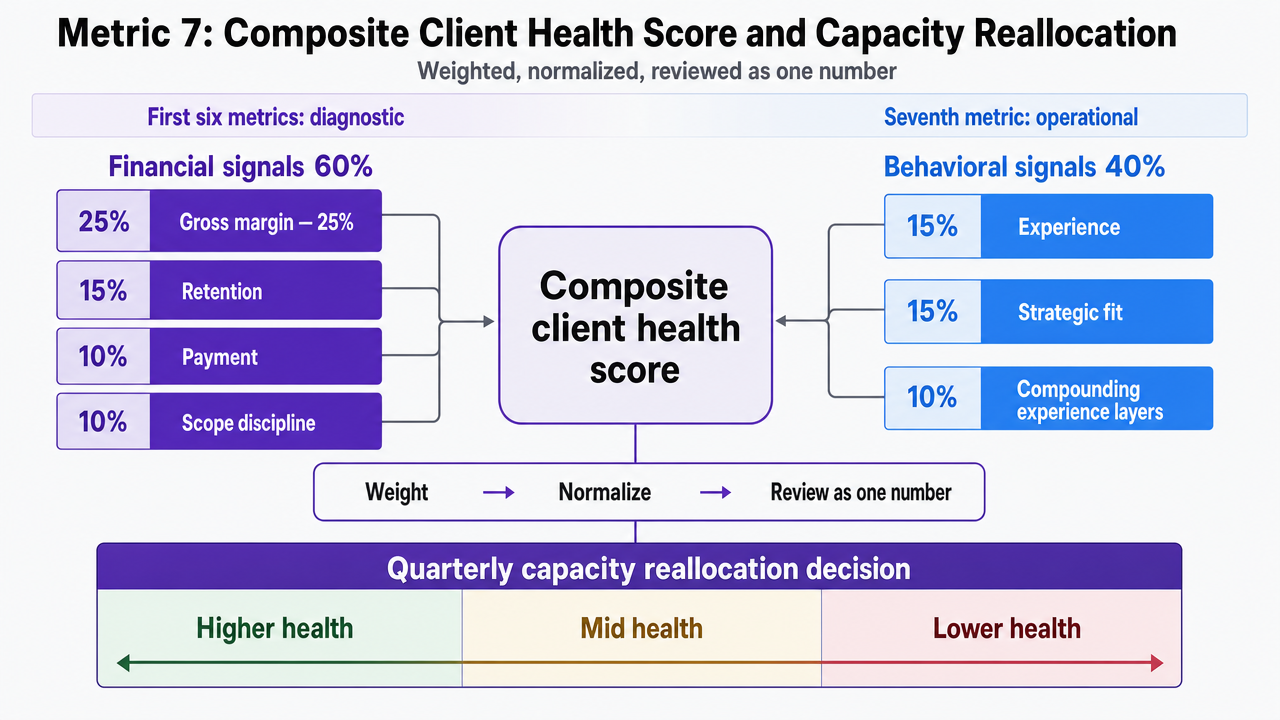 Visualize the weighting framework for the composite health score described in this section, since the section explicitly defines the seven weighted inputs and rolled-up scoring model
Quantify Client Value: Apply Data-Driven Metrics to Agency Profitability
Access actionable frameworks and AI-powered workflows to systematically assess, prioritize, and manage client portfolios based on real performance indicators—reducing overhead while optimizing for margin and scalability.
The uncomfortable cases: profitable jerks and likable money-losers
Two account types break the scorecard if the operator refuses to name them:
- The high-margin client who treats junior staff badly, escalates over email at midnight, and burns through account managers every nine months.
- The warm, referenceable client the founder enjoys working with whose gross margin has sat below 35% for two years running.
The profitable jerk is a math problem disguised as a people problem. A 60% gross margin evaporates fast once turnover costs, recruiter fees, and the senior hours spent rebuilding the account team are loaded into the calculation. The decision is not whether to tolerate the behavior — it is whether the account still scores above 4.0 once realistic retention damage is priced in. Most do not. The operator move is a documented behavioral clause at the next renewal, a single named account lead with authority to enforce it, and a 90-day exit plan if the clause is breached.
The likable money-loser is harder because the founder is usually the obstacle. The account scores below 3.0 on gross margin and shows no path above it, but it generates referrals or anchors a case study. Quantify the referral value at actual closed revenue, not pipeline, then add it to the account's margin line. If the combined number still scores below 3.0, the relationship moves to a project-based engagement at published rates — preserving the goodwill without absorbing the retainer loss every month.
Operationalizing the scorecard across the book
A scorecard that lives in a spreadsheet reviewed once a year changes nothing. The seven metrics only produce margin recovery when they run on a fixed cadence with named owners and a default action for every threshold breach. Three operational habits separate agencies that act on the score from agencies that just maintain it:
- Assign the score to one owner per account — typically the account lead, not the strategist — and review the book monthly at the leadership table with the bottom quartile named out loud.
- Tie the 90-day decision window to the renewal calendar so reprice, restructure, and release conversations land before contracts auto-renew at last year's terms.
- Recompute gross margin under an AI-assisted delivery model before any offboarding decision; Deloitte's work on next-gen B2B service shows automation can lift revenue and cut service cost simultaneously 6, and mid-tier accounts often clear the 50% margin threshold once routine production, reporting, and optimization shift to a platform-led workflow.
Vectoron is one such workflow agencies use to keep the senior bench on top-quartile work while protecting margin on the middle of the book.
Frequently Asked Questions
References
- 1.Forrester Releases 2024 US Customer Experience Index.
- 2.Forrester Unveils Global Customer Experience Index Rankings, 2025.
- 3.Forrester's Total Experience Score – Measure Brand & CX, Together.
- 4.Experience-led growth: A new way to create value.
- 5.Improving CX Can Drive More Than One Billion Dollars In Revenue.
- 6.B2B High Tech: Next-Gen Customer Support | Deloitte US.
- 7.The new B2B growth equation.
- 8.Predictions 2026: Marketing Agencies Resign Their Agency.
- 9.University of Minnesota repository paper on B2B buying process.
- 10.How B2B decision makers are driving growth.