
Key Takeaways
- Marketing efficiency works as a three-layer system: input efficiency (MER, CAC), output normalization (quality-adjusted conversions), and outcome contribution tied to enterprise value, not a single ratio.
- Every efficiency decision should be tested against its combined effect on growth rate and operating margin, since McKinsey identifies the Rule of 40 as the purest test of operational discipline 3.
- Raw engagement metrics belong in the normalization layer as diagnostic inputs, never in the MER numerator, because there is no consensus on how engagement should be measured 2.
- Growth leaders should operationalize the formula through a closed decision loop—quarterly quality coefficients, FTE-equivalent denominators, and mechanical reallocation rules—diagnosing movement layer by layer before acting.
Why a Single Ratio Cannot Run a Growth Function
Marketing efficiency is often oversimplified to a single metric, such as revenue divided by spend or customer acquisition cost (CAC) against customer lifetime value (LTV). While these ratios are frequently used in board meetings, they fail to provide a complete picture. A Head of Growth managing a $5M–$50M ARR SaaS company faces constraints like headcount, CAC payback windows, and Rule of 40 targets, requiring a more comprehensive approach than a simple fraction. The U.S. Small Business Administration emphasizes comparing marketing and sales costs against the revenue they generate as a starting point, not the entire analysis 1.
Relying on a single ratio is problematic because it obscures three critical questions: How efficiently is spend converting to pipeline? Is the generated revenue high-quality and durable, or low-retention noise? Does the resulting efficiency genuinely enhance the company's enterprise value, or merely improve dashboard metrics? For instance, channel-level Marketing Efficiency Ratio (MER) might increase while CAC payback periods lengthen. CAC could decrease, yet quality-adjusted conversions might degrade. Both scenarios can appear favorable on a dashboard, even as the company falls short of its Rule of 40 target.
This article presents the marketing efficiency formula as a layered system comprising an input layer, a normalization layer, and an outcome layer. Each layer addresses a distinct question, exhibits unique failure modes, and necessitates a specific diagnostic response from the growth leader interpreting the data.
The Three-Layer Marketing Efficiency Formula
Layer 1 — Input Efficiency: MER, CAC, and the Surface Math
The input layer focuses on the immediate return from marketing investment: how much revenue or pipeline a marketing dollar generates. MER calculates total revenue divided by total marketing spend over a specific period. CAC divides fully-loaded acquisition spend by new customers within the same timeframe. Both metrics are valuable for assessing the cost side of the funnel but are inherently limited.
Input efficiency accurately reflects the cost aspect, indicating whether spend is increasing faster than the revenue or customers it produces. For example, a blended MER declining from 4.0 to 3.2 over two quarters signals an issue on the input side, such as rising CPMs, channel saturation, an outdated creative strategy, or a sales process failing to close marketing-generated leads.
However, the input layer cannot determine the durability of the revenue generated. A campaign might reduce CAC by 18% but attract customers who churn at twice the rate of previous cohorts. MER could increase in a quarter due to one-time expansion deals that won't recur. This surface-level math offers no insight into the quality of the output.
The operational guideline for Layer 1 is to monitor blended and channel-level MER and CAC payback periods. Any fluctuations should be treated as questions requiring further investigation, rather than definitive answers. These questions are then addressed in the subsequent layer.
Layer 2 — Output Normalization: Quality-Adjusted Conversions
The second layer examines whether a conversion in the current quarter holds the same value as a conversion from the previous quarter. This challenge is akin to problems faced by productivity economists, who have long grappled with measuring productivity distortions when output quality and price change without corresponding adjustments in measurement systems 6. This same distortion affects marketing efficiency calculations.
Not all conversions are equal. A demo from a high-intent paid search ad does not possess the same downstream value as a demo from a broad-match retargeting placement, even if both have similar headline close rates. If both are counted as equivalent conversions in the MER denominator, channel efficiency comparisons become inaccurate. The solution is normalization: weighting each conversion by a quality factor—such as expected LTV, win rate, segment fit, or 90-day retention—before it contributes to the efficiency calculation.
This is where the three-layer formula becomes interconnected. Input efficiency (MER, CAC) feeds into output normalization, which adjusts the conversion count with a quality coefficient before any outcome-based calculations. Each layer has distinct failure modes:
- Layer 1 fails due to incomplete spend tracking or shifting attribution windows;
- Layer 2 fails when raw conversions are counted without accounting for channel mix stability;
- Layer 3 fails when normalized efficiency does not align with the financial profile expected by the board.
Practically, growth teams implementing this layer develop a quality table for each channel, including metrics like average contract value, gross retention at 90 and 365 days, and sales-accepted-opportunity rate. Each metric acts as a multiplier for raw conversions, yielding a quality-adjusted conversion count that is then divided into spend. This adjusted number, though smaller than the headline figure, is a more accurate predictor of future efficiency.
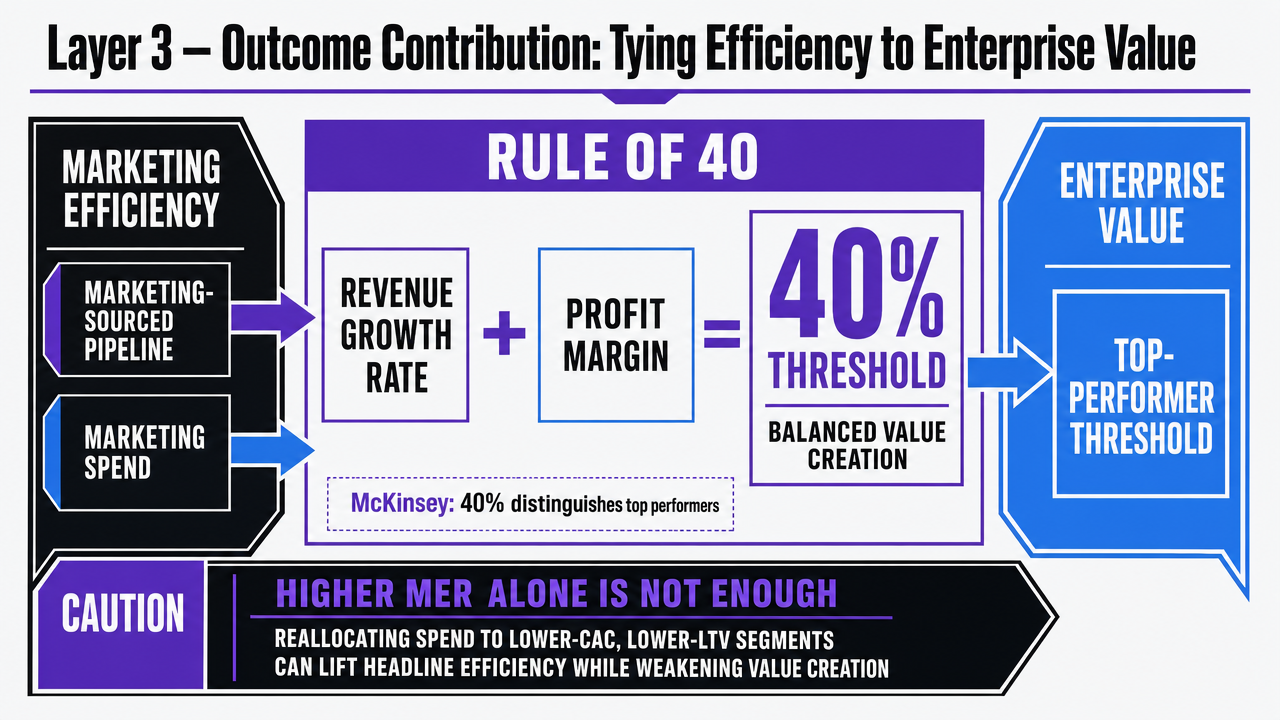
Layer 3 — Outcome Contribution: Tying Efficiency to Enterprise Value
The third layer addresses the ultimate question for stakeholders: does marketing efficiency genuinely enhance the company's enterprise value, or is it merely a favorable dashboard metric? For SaaS companies, the Rule of 40—the sum of revenue growth rate and profit margin—serves as a benchmark for balanced value creation. McKinsey's analysis of 100 public SaaS companies identifies 40% as the threshold distinguishing top performers and considers it
"arguably the purest test of a management team and its operational discipline"
3.
The link to marketing efficiency is direct. Marketing spend impacts the profit-margin component, while marketing-sourced pipeline drives the growth-rate component. A growth function that boosts MER by reallocating spend to lower-CAC, lower-LTV segments might achieve a strong headline efficiency but could simultaneously compress the growth rate, potentially dropping the Rule of 40 below the target. Conversely, a function that pursues growth by overspending in saturated channels might maintain growth but severely erode margins.
Layer 3 compels a crucial question that Layers 1 and 2 cannot: for every efficiency decision—be it budget reallocation, channel pause, content investment, or contractor change—the team must estimate its combined effect on growth rate and operating margin over the next four quarters. If a move improves MER but diminishes the sum of growth plus margin, it is detrimental at the enterprise level, even if it appears positive in channel reports.
The discipline required at this layer is straightforward but fundamentally alters decision-making. A 15% CAC reduction is less significant than whether the customers acquired at that lower CAC keep the company on its Rule of 40 trajectory. Channel-level efficiency, quality-adjusted output, and outcome contribution are distinct metrics that must be calculated separately and interpreted together. Growth leaders who adopt this approach shift from debating which ratio is correct to identifying which layer the current problem resides in.
 Reinforce the McKinsey Rule of 40 benchmark cited in the section as the threshold linking marketing efficiency to enterprise value
 Higher Revenue Growth for Marketers with Common Measurement Approaches
Higher Revenue Growth for Marketers with Common Measurement Approaches
Test Data-Driven Marketing Efficiency in Real Time
Measure true marketing efficiency by running live campaigns and tracking performance metrics during your trial period.
Productivity Economics as the Hidden Spine of the Formula
Beneath the marketing terminology, the three-layer formula is fundamentally a productivity equation: output divided by input, adjusted for quality. This framework is not a loose analogy. The National Institute of Standards and Technology (NIST) has long treated productivity measurement as a structured discipline, with aggregate measures of productivity and productivity growth forming its operational core 5. NIST's work on sector productivity further emphasizes that systematic measurement and improvement of output relative to input differentiate a continuously improving function from one that is merely busy 4.
This principle applies directly to marketing. Spend, labor hours, and tooling are inputs, while pipeline, closed revenue, and retained customers are outputs. Most growth dashboards fall short precisely where productivity economists begin: adjusting for changes in the actual output. Brookings highlights price-change and quality-change measurement as critical in productivity analysis, noting that measured productivity is distorted when the underlying unit shifts without corresponding adjustments in the measurement system 6.
For a Head of Growth, this reframes the efficiency discussion. The key question is not merely whether MER changed, but whether the function produced more of the right output per unit of input than in the previous quarter, and if the measurement system is robust enough to reflect this accurately. Layers two and three of the formula exist because Layer 1, by itself, is akin to counting widgets without verifying their functionality.
Where Engagement Metrics Break Efficiency Math
Engagement metrics, while easy to present, are perilous to include in efficiency calculations. Metrics like likes, comments, shares, watch time, and scroll depth appear to be outputs because they accumulate visibly. However, a peer-reviewed systematic review of social media engagement measurement explicitly states there is
“no theoretical certainty or solid consensus”
on how engagement should be measured, categorizing measures into quantitative metrics, normalized indexes, sets of indexes, and qualitative metrics 2. A growth function that incorporates raw quantitative engagement into the MER numerator is combining units that even academic researchers cannot agree are comparable.
The failure is mechanical. A post with 4,000 likes and 12,000 impressions is not inherently twice as efficient as one with 2,000 likes and 6,000 impressions; their normalized rates are identical, and neither figure indicates whether the audience aligns with the ideal customer profile (ICP). Engagement counts disregard exposure denominators, audience composition, and downstream conversion. When these raw counts are used in channel-efficiency comparisons, the channel with the most vocal audience may receive more budget, even if its quality-adjusted conversion rate is the lowest in the portfolio.
The operational solution is to remove engagement metrics entirely from Layer 1. They should serve as diagnostic inputs for the normalization layer, not as outputs in the efficiency ratio. Growth teams managing social or content channels can retain engagement on dashboards as a leading indicator of reach quality. However, the metric used to divide into spend must be a sales-accepted opportunity, a qualified pipeline dollar, or a quality-adjusted conversion—never an aggregated engagement count. Growth leaders who understand this distinction cease defending channel mixes that show strong engagement but weak revenue contribution.
See the Data Behind High-Efficiency Marketing Operations
Request a walkthrough of real-world efficiency benchmarks and learn how top agency and enterprise teams operationalize the marketing efficiency formula at scale—without increasing overhead.
Content as the Largest Efficiency Lever
Among all line items in a SaaS marketing budget, content typically represents the largest variable input and exhibits the widest performance variance. Peer-reviewed research on content marketing effectiveness investigates the managerial contexts that determine content's return on investment, framing effectiveness as a controllable function rather than an inherent channel property 8. This perspective is crucial because it integrates content directly into the three-layer formula, rather than treating it as a separate brand expense.
Content efficiency calculations are unique in two ways. First, the primary input is labor—writers, editors, SEO specialists, designers, reviewers—rather than media spend. Consequently, content efficiency is often measured against an FTE-equivalent denominator more than a dollar denominator. Second, content output decays slowly. A single high-intent article can contribute to pipeline generation over six to twelve quarters, transforming a one-time labor input into a multi-period output stream. Most efficiency dashboards, however, undervalue this by only considering the quarter in which the cost was incurred.
The operational implication is clear. Growth teams that manage content as a quality-adjusted production line—measuring units shipped, organic pipeline sourced per unit, and retention of ranking positions—discover that Layer 2 normalization yields the most significant efficiency gains. Reducing content volume rarely improves efficiency; instead, eliminating low-quality content units while enhancing the quality coefficient of the remaining content almost always does.
The Labor-Efficiency Lens: Output per FTE-Equivalent
Defining FTE-Equivalents Across In-House, Contractor, and Agency Capacity
Dollar-denominated efficiency often overlooks the primary constraint faced by most Heads of Growth: human capital. A $5M–$50M ARR SaaS function typically fails not due to lack of spend, but because the team cannot produce sufficient quality-adjusted output per quarter to sustain the growth-rate component of the Rule of 40. This makes the labor denominator operationally critical, even if board discussions focus on MER.
An FTE-equivalent is a normalized unit of productive capacity, distinct from a headcount number. One full-time in-house growth marketer, contributing approximately 1,800 productive hours annually, counts as 1.0 FTE-equivalent. A contractor billing 600 hours for the same scope would be 0.33 FTE-equivalent. An agency retainer, with a fixed monthly fee, can be converted into FTE-equivalents by estimating the effective hours of senior strategist, specialist, and production time it delivers—a calculation that often surprises growth leaders when derived from invoices and deliverable schedules.
This normalization is vital because Layer 1 efficiency math treats labor inputs as interchangeable, which they are not. A senior SEO strategist dedicating ten hours to a high-intent content brief produces a different output than a junior contractor spending thirty hours on the same brief. The FTE-equivalent denominator ensures that comparable units are being evaluated before any output ratio is calculated.
A Conceptual Labor-Efficiency Comparison Table
The table below uses variables instead of specific dollar figures, as absolute numbers are company-specific. The crucial aspect is the structure: identical output categories measured against the same FTE-equivalent denominator across different capacity types. This allows for consistent comparison of channel-mix and staffing-mix decisions.
| Capacity Type | FTE-Equivalent (F) | Content Units Shipped (C) | Campaigns Executed (E) | Qualified Pipeline Sourced (P) | Output per FTE-Equivalent |
|---|---|---|---|---|---|
| In-house specialist | F₁ | C₁ | E₁ | P₁ | (C₁ + E₁ + P₁) / F₁ |
| Contractor pool | F₂ | C₂ | E₂ | P₂ | (C₂ + E₂ + P₂) / F₂ |
| Agency retainer | F₃ | C₃ | E₃ | P₃ | (C₃ + E₃ + P₃) / F₃ |
| AI-augmented production | F₄ | C₄ | E₄ | P₄ | (C₄ + E₄ + P₄) / F₄ |
Each output column should be quality-weighted using the Layer 2 coefficients already integrated into the formula—for example, content units multiplied by ranking retention, campaigns by sales-accepted-opportunity yield, and pipeline by 90-day retention. Without these weights, the table would reward sheer volume, a pitfall that NIST productivity research warns against when systematic measurement devolves into mere counting 5. Teams that conduct this comparison quarterly often discover that their highest output-per-FTE-equivalent line is not necessarily the one with the largest budget, signaling a need for reallocation before MER dictates it.
See Your Marketing Efficiency Ratio in Action—Powered by AI
Instantly calculate, benchmark, and optimize your team's marketing efficiency using real-time analytics and automated recommendations—engineered for agencies and multi-brand growth teams managing complex digital portfolios.
Operationalizing the Formula: A Measurement System That Changes Decisions
A formula that fails to influence decision-making is merely a reporting habit, not a true measurement system. NIST's guidance on measurement programs explicitly distinguishes between dashboards that simply report numbers and programs that support data-driven, risk-based decisions 7. The same standard applies to the three-layer marketing efficiency formula. If the layered analysis is produced quarterly, yet budget allocations remain unchanged from what intuition would suggest, the system has failed, regardless of the calculations' apparent cleanliness.
The operational test is whether the formula is integrated into a closed decision loop. Inputs from Layer 1 (spend, FTE-equivalents, channel activity) feed into Layer 2 normalization (quality coefficients applied to raw conversions), which then informs Layer 3 outcome modeling (projected impact on growth rate plus margin). At the end of this loop, a reallocation rule is triggered: any channel or capacity line whose quality-adjusted output per dollar or per FTE-equivalent falls below a defined threshold for two consecutive quarters is cut, paused, or restructured. This rule is intentionally mechanical, as discretion in reallocation often undermines the effectiveness of measurement programs.
Three practices ensure the integrity of this loop:
- Layer 2 quality coefficients are recalculated quarterly using actual retention, win-rate, and ACV data, rather than being held constant from the previous year. This addresses Brookings' warning about quality-change measurement in practice 6.
- Every reallocation decision is documented with the formula output that prompted it, allowing for future audits to assess the math's predictive accuracy.
- The loop operates on a fixed, pre-committed cadence, as measurement systems that are bypassed during pipeline crunches rarely regain their authority.
Growth leaders who implement the formula in this manner shift from presenting ratios in budget meetings to presenting actionable decisions. The MER, quality-adjusted output, and Rule of 40 contribution are all on the table, alongside the reallocations indicated by the data. This represents the fundamental difference between a measurement program that merely informs and one that actively drives decisions.
Diagnostic Sequence: Reading the Formula When Numbers Move
When efficiency numbers fluctuate, the question is not simply whether the change is "good or bad," but which layer of the formula caused the movement. Growth leaders who bypass a structured diagnostic sequence risk cutting effective channels and protecting underperforming ones.
Begin with Layer 1. If MER has dropped, determine if the spend denominator increased, the revenue numerator decreased, or both. A rising denominator with stagnant revenue often indicates channel saturation or attribution leakage. Conversely, a stable denominator with declining revenue points to downstream issues—such as sales conversion, pricing, or seasonality—where marketing efficiency acts as a symptom reporter, not the root cause.
If Layer 1 appears stable, proceed to Layer 2. Compare the quality coefficients applied in the previous quarter with current retention, win-rate, and ACV data. Brookings' emphasis on quality-change measurement is particularly relevant here: when the underlying unit of output shifts and the coefficient is not updated, the efficiency number degrades even if raw counts remain consistent 6. A channel producing the same conversion volume but with lower 90-day retention is failing at Layer 2, regardless of what MER suggests.
Layer 3 serves as the final verification. If Layers 1 and 2 are stable, but the team's contribution to growth rate plus margin is declining, the issue lies with the mix of activities, not efficiency itself. In this scenario, the function is performing efficient work but on the wrong outcomes. Always read the layers in order; reallocation decisions should follow a thorough diagnosis.
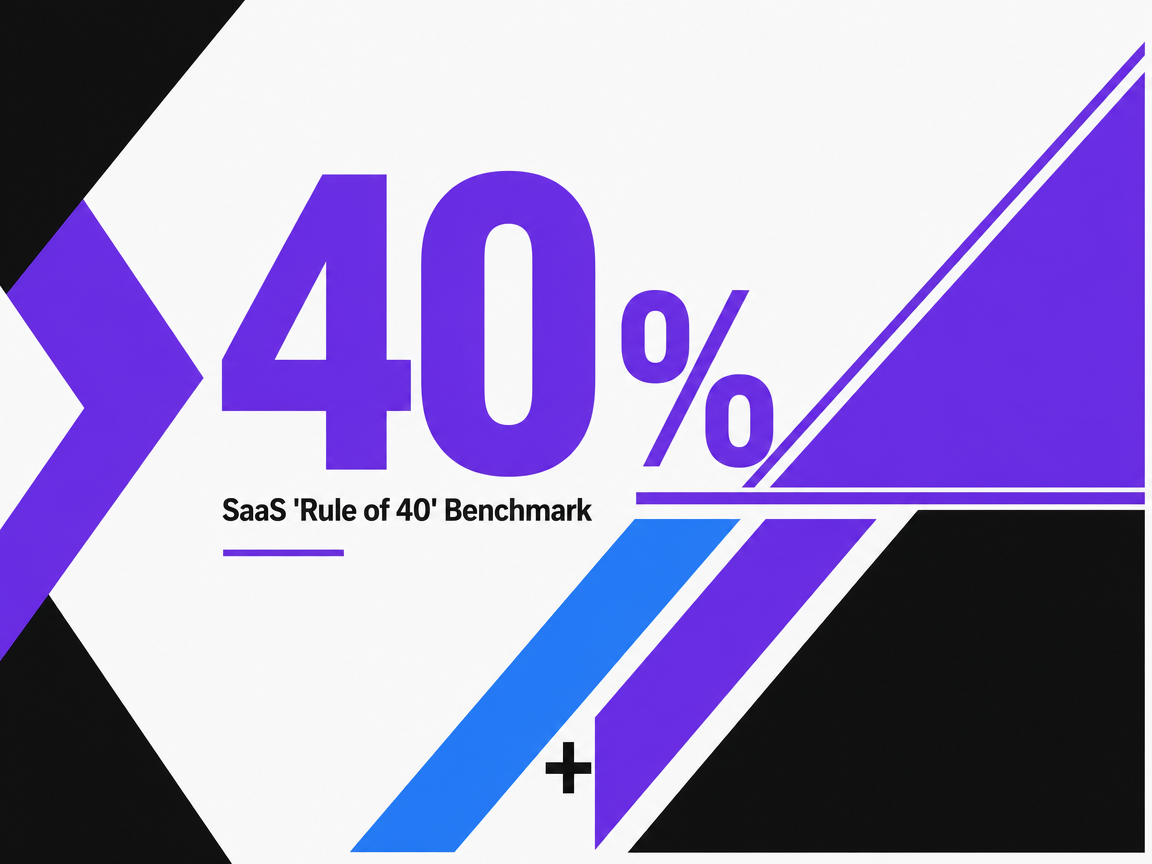
SaaS 'Rule of 40' Benchmark
Frequently Asked Questions
References
- 1.Marketing and sales | U.S. Small Business Administration - SBA.
- 2.Conceptualising and measuring social media engagement: A systematic literature review.
- 3.SaaS and the Rule of 40: Keys to the critical value creation metric.
- 4.Measuring and improving U.S. construction productivity.
- 5.Measurement & analysis of productivity growth.
- 6.The measurement of output, prices, and productivity | Brookings.
- 7.NIST Offers Guidance on Measuring and Improving Your Company's Cybersecurity.
- 8.Determinants of content marketing effectiveness: Conceptual ... - PMC.