
Key Takeaways
- Marketing efficiency splits into six distinct types mapped to the AHRQ structure-process-outcome framework: signal, coordination, allocative, productive, financial, and learning 3.
- Structure-side weaknesses in signal and coordination degrade fastest as sites are added, distorting every downstream diagnostic and producing the flat blended CAC curve operators misread as a budget problem.
- Financial efficiency is a scoreboard, not a lever; an LTV/CAC ratio movement signals when to investigate, while the other five types reveal where the actual constraint sits 14.
- Diagnose the binding constraint in order—signal first, then coordination, allocative, productive, learning, and financial—because visibility must precede any attempt to optimize allocation or output.
Why CAC Flattens as Sites Are Added
A familiar pattern emerges in multi-location healthcare operations: after about fifteen sites, the blended cost per acquired patient (CAC) stops decreasing. Initial locations benefit from shared resources like creative assets, a single paid search account, and one agency. While sites six through twelve might still show declining CAC, the curve eventually flattens or even inverts. New locations become more expensive to fill than established ones, leading executive teams to question the marketing budget or the underlying growth model.
The issue rarely lies with the budget itself. Instead, the assumption that a single type of efficiency can sustain a growth program across a complex footprint breaks down. Most operators optimize media buying and creative production, treating other factors as mere overhead. However, coordination across sites, the quality of analytics signals, and the ability to leverage learnings from one market to the next are critical, distinct efficiency types. Each has its own failure modes and degrades differently as the number of sites increases.
The AHRQ's definition of efficiency, which includes avoiding waste of ideas and energy, directly applies to marketing operations 2. This article categorizes marketing efficiency into six types, aligning each with the structure-process-outcome framework already used by healthcare leaders for clinical quality 3. This taxonomy helps identify which efficiency type becomes the binding constraint when CAC plateaus.
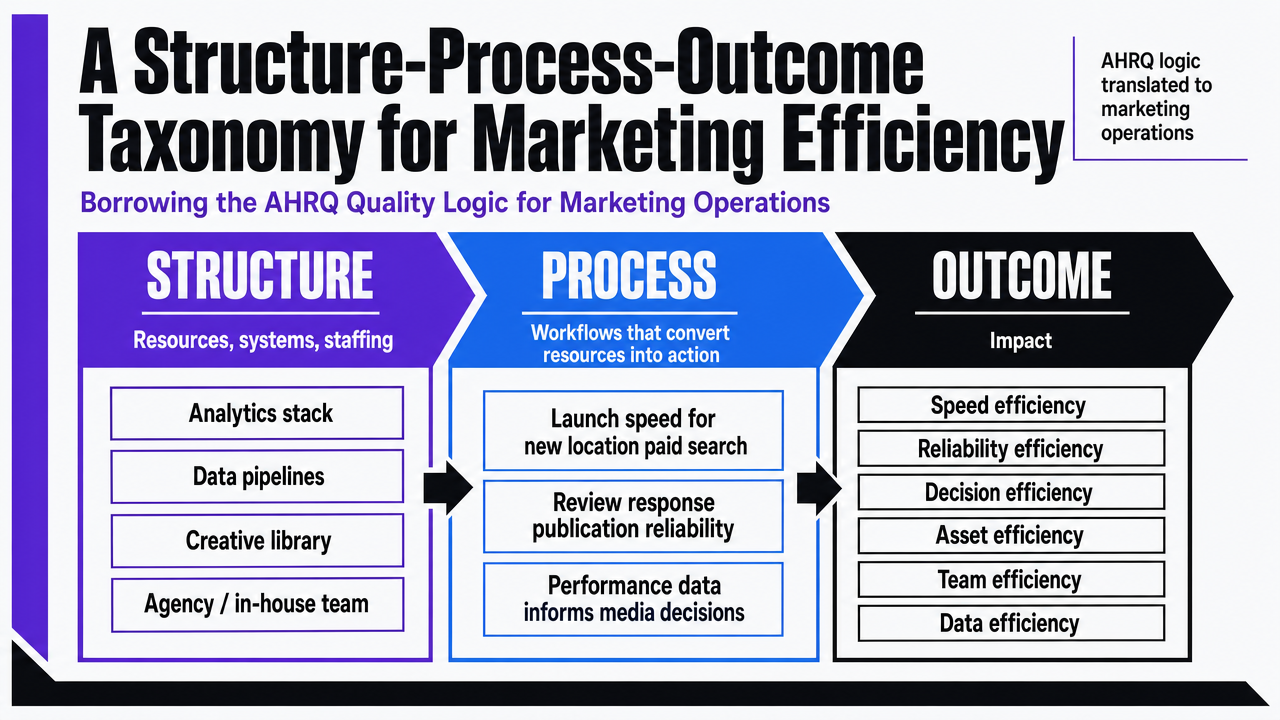
A Structure-Process-Outcome Taxonomy for Marketing Efficiency
Borrowing the AHRQ Quality Logic for Marketing Operations
Healthcare leaders already utilize a robust framework for performance measurement. The AHRQ classifies quality measures into three categories: structure (resources, systems, and staffing), process (workflows that convert resources into action), and outcome (patient impact) 3. This logic seamlessly translates to marketing operations.
In marketing, structure measures encompass fixed assets like the analytics stack, data pipelines between sites and the corporate brand, the creative library, and the agency or in-house team configuration. Process measures describe how these assets are utilized, such as the speed of launching paid search for a new location, the reliability of review response publication, or the frequency of performance data informing media decisions. Outcome measures quantify the system's output: acquired patients, panel growth, cost per acquired patient, and same-store visit lift.
This framework is crucial for scalable growth because CMS quality logic explicitly links standardization of structure and process to reduced variation and predictable results 1. Marketing teams that focus solely on outcome metrics while neglecting structural and process layers often experience unpredictable results across sites and a flat blended CAC curve that is difficult to diagnose.
Within this taxonomy, six distinct efficiency types exist. They are not interchangeable, and improving one does not automatically improve the others.
The Six Types at a Glance
These six types align with the AHRQ categories 3:
Structure-side efficiencies describe pre-campaign infrastructure. : Signal efficiency assesses whether the analytics and reporting stack provides clear visibility into site-level costs and performance. : Coordination efficiency measures the cost associated with disseminating decisions and assets across locations, agencies, and clinical operations.
Process-side efficiencies describe how the established structure is utilized. : Allocative efficiency determines if spending aligns with actual patient demand and service-line economics, rather than channel habits. : Productive efficiency quantifies marketing output per unit of labor, including campaigns launched, pages published, creative variants tested, and review responses posted.
Outcome-side efficiencies describe the system's results. : Financial efficiency is the ultimate metric: cost per acquired patient, LTV/CAC ratios, and payback period. : Learning efficiency measures how effectively insights gained from one market accelerate and reduce costs for subsequent site launches.
This distinction is important because many healthcare growth teams over-invest in only a few of these, leading to flat CAC curves. For example, a team with high productive efficiency but low coordination efficiency might launch many campaigns but struggle to determine which sites need them. Similarly, strong financial reporting combined with weak signal efficiency means knowing blended CAC is rising without identifying the specific location responsible. Identifying the current binding constraint is key.
 Visualize the six marketing efficiency types mapped to the AHRQ structure-process-outcome framework, which is the article's core taxonomy and is explicitly defined in this section
Allocative Efficiency: Spending Where Patient Demand Actually Sits
A common failure occurs when a multi-site group continues to allocate a significant portion of its paid budget to services that were successful at initial flagship locations, even if newer markets have different demand profiles. For instance, a 12-site group might still spend 40% on cosmetic services because that's where the first two sites thrived, despite eight newer sites being in markets primarily driven by insurance-based primary care visits. While campaigns may still convert and site-level CAC numbers appear acceptable, the blended ratio suffers because spending doesn't align with actual patient demand in each market.
Allocative efficiency measures whether marketing funds are directed towards service lines, geographies, and patient segments that reflect real demand, rather than historical patterns. This is a process-side measure within the AHRQ taxonomy 3. The underlying structure (analytics, agency contracts, media accounts) might be sound, but the workflow for making spending decisions is misaligned with what patients in each market genuinely seek.
Healthcare marketing literature emphasizes investigating patient needs and offering desired services, rather than promoting what the group prefers to sell 5. For multi-site operators, this necessitates demand modeling at the market level, not just the brand level. The key lever is a quarterly reallocation strategy tied to service-line P&L and local search demand, rather than annual budget rollovers.
To diagnose, compare last quarter's spend by service line with booked appointments by service line at each site. If these ratios vary by more than a factor of two across locations, allocative efficiency is compromised even before campaigns launch.
Experience measurable marketing efficiency gains in days
Test real-time, data-driven marketing workflows and publish live content to evaluate operational impact immediately.
Productive Efficiency: Output per Unit of Marketing Labor
Productive efficiency addresses a specific question: for every hour of marketing labor invested, how many usable assets, decisions, and optimizations are generated? This falls under the process side of the AHRQ taxonomy 3. Even with a solid structure, sound strategy, and demand-aligned spending, low team throughput can hinder the entire system.
The failure manifests as backlogs. A new location might be ready to launch, but its landing page is delayed because the agency producer is still finalizing content for previous sites. Service-line expansions await creative assets. Review responses are posted days late. Local schema markup at many sites becomes outdated. These issues aren't reflected in a CAC report but represent significant opportunity costs: campaigns launch weeks behind schedule, and new site ramp-up curves fall short of projections.
Generative AI is a key tool multi-location healthcare operators are exploring to address this constraint. A McKinsey survey in late 2025 found that approximately 50% of healthcare organizations reported generative AI implementation, with over 80% of those having deployed at least one initial use case 16. McKinsey's B2B sales analysis also indicated that sales and marketing saw the largest increase in genAI application adoption between 2023 and 2024 19. This trend suggests a shift towards restructuring production workflows around machine output with human oversight, rather than relying solely on linear headcount growth.
However, governance is crucial. Productive efficiency gains that lack auditability are ineffective. The NIST AI Risk Management Framework emphasizes that AI risk management must be integrated into enterprise risk processes 4. For healthcare operators, this means ensuring medical accuracy, brand consistency, and traceability for every AI-assisted asset before it represents the brand at any site.
To diagnose, count the assets produced per marketing FTE per month over the last two quarters, then assess the asset queue. If the queue is growing faster than headcount, productive efficiency is the binding constraint, and simply adding more staff is the slowest solution.
Coordination Efficiency: The First-Class Cost Most Operators Miss
The most significant expense in a multi-site growth program often goes unbilled. It's the cost of implementing a single decision across the entire footprint: a brand-level offer change, a new service line at multiple sites, or a paid search account restructuring requiring approvals from various stakeholders. By the time the change is implemented, market conditions may have shifted, campaign windows closed, and local teams may have improvised solutions that don't align with future site needs.
Coordination efficiency directly measures this cost. It's a structure-side measure in the AHRQ taxonomy 3, dependent on the data infrastructure, governance, and operating model established before any campaign. Healthcare literature on cross-organizational collaboration highlights that coordination yields benefits only when governance, shared metrics, and decision rights are proactively designed 13. Interoperable data infrastructure is equally vital, as decisions cannot outpace the information supporting them 8.
The failure manifests as unexplained cross-site CAC variance. For example, site eleven might have a 60% higher cost per acquired patient than site four in a similar market, with no clear explanation from the corporate level regarding whether creative, media mix, intake conversion, or local demand is the cause. The lean healthcare benchmarking framework emphasizes that reliable cross-site comparison requires widely applicable outcome domains and careful consideration of contextual factors; otherwise, variance is merely noise 18.
For multi-location healthcare operators, the solution is a single account-level plan instead of numerous per-location plans. Standardized intake taxonomy, shared creative libraries, and unified approval processes ensure brand-level changes propagate consistently across all sites. This reduces the cost of implementing subsequent decisions and narrows the variance in cross-site CAC, making remaining gaps diagnosable.
If a headquarters-initiated change takes more than two weeks to reach every site, coordination efficiency is the binding constraint, regardless of financial reports.
See How Top Healthcare Operators Achieve Non-Linear Marketing Efficiency
Request a data-driven walkthrough of AI-powered marketing operations proven to reduce per-location costs and coordination overhead for multi-site healthcare and agency growth teams.
Financial Efficiency: The Scoreboard, Not the Strategy
Financial efficiency is often the only marketing efficiency metric presented to the board, leading to its confusion with strategy. It serves as the scoreboard, reflecting past performance through metrics like cost per acquired patient, payback period, and LTV/CAC ratio. However, these metrics don't dictate future actions. Treating them as levers rather than readouts can lead multi-location healthcare operators to cut budgets precisely where more investment is needed.
Within the AHRQ taxonomy, financial efficiency is an outcome measure 3, summarizing the results of the other five efficiency types. Allocative misalignment appears as inflated CAC for inappropriate service lines. Coordination issues manifest as variance between sites in comparable markets. Productive bottlenecks result in ramp-up curves that miss targets. Signal gaps lead to a blended number that cannot be disaggregated. In all these scenarios, the scoreboard indicates declining financial efficiency.
A common cross-industry benchmark is an LTV/CAC ratio of at least 3:1, which Harvard Business School Online considers healthy 14. This is a useful baseline, but it's not a healthcare-specific target and doesn't explain why site twenty-two has a 2.4:1 ratio. The number prompts investigation, but it's not the diagnosis itself.
Use financial efficiency to identify when to investigate, and the other five efficiency types to pinpoint where to focus efforts.
Signal Efficiency: Visibility as a Prerequisite for Optimization
Signal efficiency represents a subtle yet critical failure that obstructs the diagnosis of other efficiency types. A group might have aligned spending, rapid production, strong coordination, and clear financial reporting, yet still be unable to identify which of its nineteen sites is driving up blended CAC in a given quarter. Reports may seem complete and numbers reconcile, but the necessary resolution is missing: cost and performance data at the level where decisions are made.
This is a structure-side measure 3, depending on the infrastructure established before any campaign. This includes:
- call tracking linked to specific service lines,
- intake systems that feed source data into the analytics layer,
- ad accounts structured to differentiate site-level performance from regional aggregates, and
- reporting delivered before budget meetings.
Healthcare policy literature consistently states that cost and performance transparency is essential for reducing costs and improving outcomes 9. The same principle applies to marketing operations. A site whose performance is obscured within a regional aggregate cannot be optimized; it can only be averaged.
Public reporting research supports this operational point: greater transparency in hospital performance correlates with measurable improvements in technical efficiency, as visibility creates both pressure and data for action 7. For a multi-location operator, the internal equivalent is site-level dashboards that consistently display CAC, intake conversion, and service-line mix across all locations, using uniform definitions. Interoperable data infrastructure makes this possible 8.
If the team cannot identify the specific site, service line, and channel responsible for last month's CAC fluctuations within one business day, signal efficiency is the binding constraint, rendering all other optimization efforts speculative.
Learning Efficiency: Compounding Returns from Repeatable Process
The initial five sites provide invaluable insights into a group's operational model. The crucial factor determining whether site twenty-five resembles site five or site fifteen is whether these learnings are captured and applied to subsequent launches. Learning efficiency measures how effectively insights gained in one market reduce the time, cost, and variability of the next.
The failure mode is evident when a new market opens, and the playbook that succeeded at site seven is recreated from scratch. This happens because critical information—such as which intake script boosted booking rates, which paid search keywords were ineffective, or which review-response template maintained star ratings during ramp-up—was never documented. Consequently, three months later, the new site addresses problems already solved by older sites. The ramp-up curve mirrors a first-time launch because, operationally, it is one.
CMS directly articulates the underlying principle: quality improvement involves standardizing processes and structure to minimize variation and achieve predictable results 1. In growth operations, this means treating each campaign, landing page, and intake workflow as a versioned, evaluated, and reusable artifact, not a one-off deliverable. Learning efficiency is an outcome-side measure in one sense and a structure-side measure in another 3; it results from repeatable processes and manifests as faster, cheaper ramp-ups at subsequent sites.
If the ramp-up curve at site twenty doesn't show improvement compared to site ten, the system is merely operating, not learning.
Quantify and Scale Every Type of Marketing Efficiency—Automatically
Access a unified dashboard to benchmark, monitor, and optimize operational, financial, and campaign efficiency metrics across all locations—enabling scalable growth without proportional increases in spend or staff.
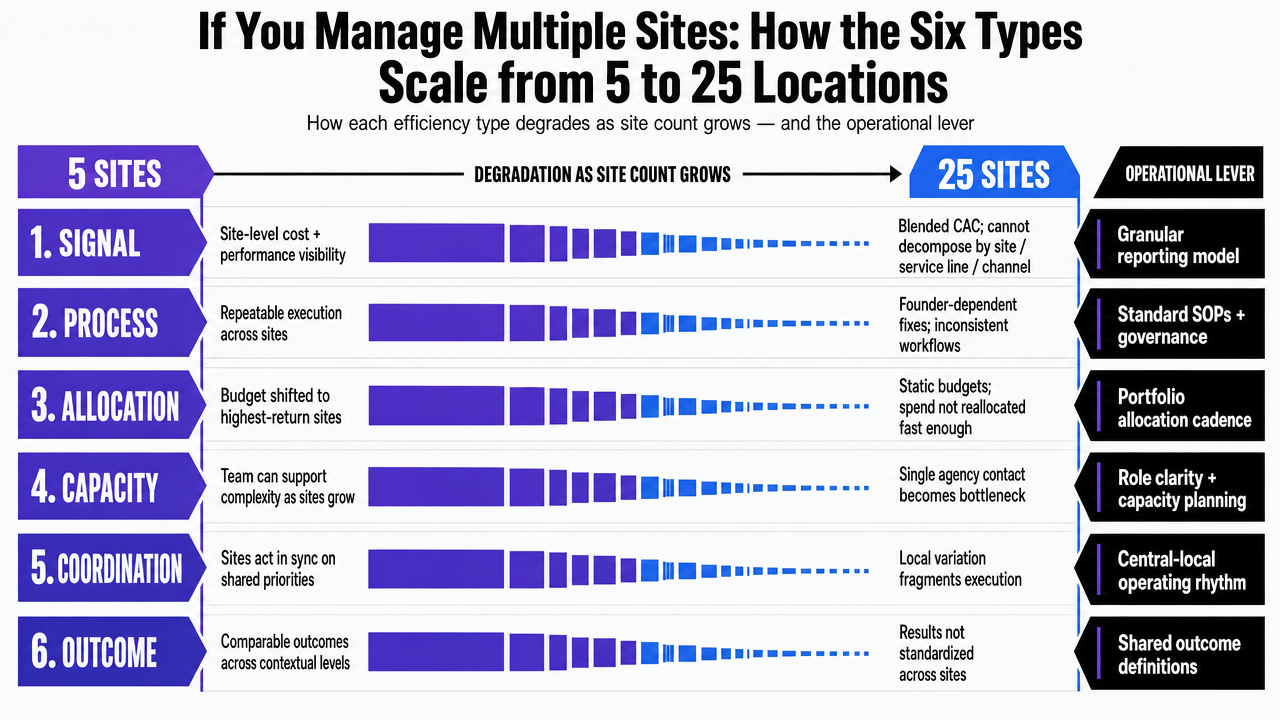
If You Manage Multiple Sites: How the Six Types Scale from 5 to 25 Locations
For multi-location healthcare operators, each efficiency type degrades uniquely as the number of sites increases. A five-site group can often compensate for weaknesses through direct founder involvement and a single agency contact. A twenty-five-site group cannot. The table below illustrates how each type typically breaks down between these two scales and identifies the corresponding operational levers. Failure modes are derived from the AHRQ structure-process-outcome taxonomy 3 and the lean healthcare benchmarking framework's emphasis on standardized outcome domains across contextual levels 18.
| Efficiency Type | What It Measures | Typical Failure Mode at 25 Sites | Operational Lever |
|---|---|---|---|
| Signal | Visibility into cost and performance at the site level | Blended CAC reports that cannot be decomposed by site, service line, or channel within a working day | Site-level dashboards with shared definitions and interoperable data pipes 8 |
| Coordination | Cost of moving decisions and assets across the footprint | Brand-level changes take weeks to land at every site; cross-site CAC variance is unexplainable | Single account-level plan, shared creative libraries, predefined decision rights 13 |
| Allocative | Whether spend follows real patient demand | Legacy service-line mix at flagship sites distorts budget allocation in newer markets | Quarterly reallocation tied to local demand and service-line P&L 5 |
| Productive | Output per unit of marketing labor | Asset queues grow faster than the headcount line; ramp at new sites lags plan | AI-assisted production with auditable review under enterprise risk governance 4 |
| Financial | Cost per acquired patient, payback, LTV/CAC | Blended ratio flattens or inverts as new sites are added | Treat as readout, not lever; investigate the upstream type driving the move |
| Learning | Compounding of insight across sites | Site twenty solves problems site seven already solved; ramp curves do not bend | Versioned playbooks and standardized process documentation 1 |
The table consistently shows that structure-side weaknesses, specifically signal and coordination, become more costly faster than process-side or outcome-side issues. This is because each new site amplifies their failure surface. A group expanding locations without first addressing structural deficiencies will experience unpredictable degradation in financial efficiency.
 Translate the section's comparison table into a scannable visual that shows how each efficiency type degrades from 5 to 25 sites and the corresponding operational lever, directly supporting the section's cited content
Diagnosing the Binding Constraint
The six efficiency types do not progress in parallel. At any given quarter, one acts as the binding constraint, making the others secondary concerns. The practical challenge is not which type to fix, but which one is currently limiting the entire system.
A quick triage works for most multi-location healthcare operators:
- Begin with signal efficiency: can the team disaggregate last month's blended CAC by site, service line, and channel within a single business day? If not, all subsequent analyses are speculative.
- Next, assess coordination: how long does a brand-level change take to implement across all sites, and what is the unexplained variance in cross-site CAC?
- Then, check allocative fit by comparing spend share to booked-appointment share by service line.
- Productive throughput is revealed by the asset queue.
- Learning efficiency is evident if the ramp-up curve at the newest site improves upon the previous one.
- Financial efficiency is the last to be evaluated 3.
This order is crucial because structural weaknesses distort diagnostics for everything else. A group cannot determine if spending is misallocated if site-level data is hidden within a regional aggregate. Prioritize fixing what the system can see before attempting to fix what it does.
Frequently Asked Questions
References
- 1.Quality Measurement and Quality Improvement | CMS.
- 2.Six Domains of Healthcare Quality | AHRQ.
- 3.Types of Health Care Quality Measures | AHRQ.
- 4.Artificial Intelligence Risk Management Framework (AI RMF 1.0).
- 5.The impact of marketing strategies in healthcare systems - PMC.
- 6.Primary Healthcare Marketing: A Bibliometric Study and Research Trends.
- 7.The Impact of Public Reporting Schemes and Market Competition on Hospital Technical Efficiency.
- 8.Increase Effectiveness and Efficiency of the U.S. Health Care System.
- 9.Transparency of Cost and Performance - The Healthcare Imperative.
- 10.Value-Based Care | CMS.
- 11.Quality in Motion.
- 12.Hospital Outpatient Quality Reporting Program | CMS.
- 13.Collaboration Among Health Care Organizations: A Review.
- 14.LTV/CAC Ratio: What It Is & How to Calculate It - HBS Online.
- 15.Reimagining healthcare industry service operations in the age of AI.
- 16.Generative AI in healthcare: Adoption matures as agentic AI emerges.
- 17.The economic potential of generative AI: The next productivity frontier.
- 18.Benchmarking outcomes on multiple contextual levels in lean healthcare: Development of a conceptual framework.
- 19.An unconstrained future: How generative AI could reshape B2B sales.