
Key Takeaways
- Answer-surface presence now shapes branded demand because AI summaries reduce clicks and end more sessions without any outbound visit, making inclusion in the answer the measurable event 1.
- A defensible program runs two layers: signal metrics (inclusion rate, citation share, prompt coverage, sentiment) as leading indicators, and outcome metrics (branded search lift, sourced pipeline, incrementality) as validation.
- Treat visibility as a distribution, not a rank—sample each prompt across ChatGPT, Perplexity, Gemini, and Google AI Overviews on a fixed cadence and report rolling windows with variance bands 6.
- Focus next on building a buyer-grounded prompt set across category, comparison, problem, and local bands, then anchor credit with matched-market or holdout tests rather than raw correlation 16.
Why answer-surface presence became a pipeline question
The click is no longer the default outcome of a search. Pew Research found that Google users clicked a traditional result in 8% of visits when an AI summary appeared, compared with 15% when no summary was shown. Sessions that ended without any click rose to 26% with an AI summary present, versus 16% without one 1. This shift changes what marketing leaders can measure downstream. Bain's 2025 consumer research reports that roughly 80% of search users lean on AI-written results for at least 40% of their queries, and about 60% of searches now end without a click through to any external site 2. When a growing share of buying-adjacent research happens inside an answer, the brand either appears in that answer or it does not exist for that moment.
Pipeline owners must treat answer-surface presence the same way they treat share of voice in paid media: as an upstream signal that shapes branded demand, direct traffic, and eventually sourced opportunity. Measurement has to move from ranking positions to inclusion, citation, and prominence inside the response itself.
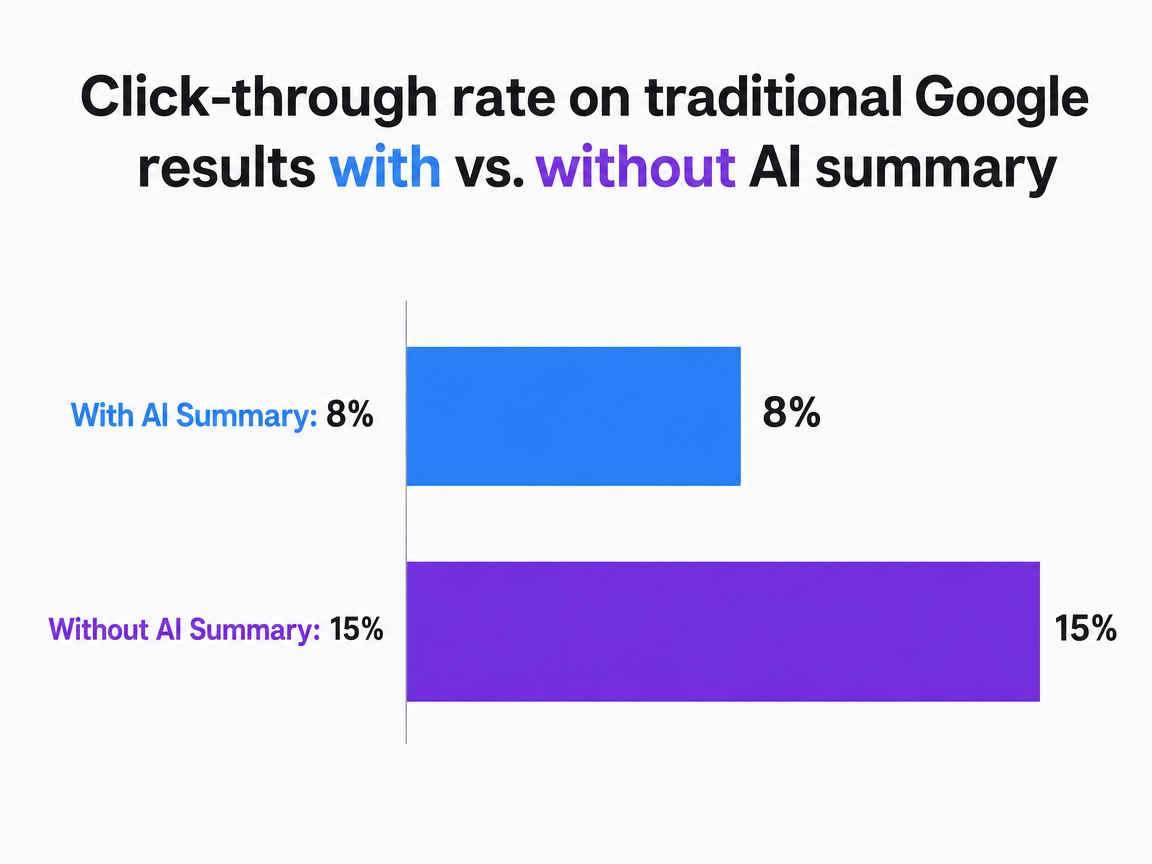 Click-through rate on traditional Google results with vs. without AI summary
Compares the percentage of Google search visits where a user clicked a traditional (non-AI) result, contrasting sessions that displayed an AI summary with those that did not.
Sizing the surface: where visibility measurement actually needs to run
Before instrumenting anything, the question is where the answer surface actually lives. Bain's March 2026 consumer snapshot found that 56% of respondents mostly or always use search engines as their default research tool, while 16% mostly or always start with a chatbot. Inside that same population, 46% reported using AI overviews served within traditional search engines 4. Measurement that ignores AI overviews inside Google to focus only on ChatGPT will miss where roughly half of respondents are already reading synthesized answers.
SparkToro's 2025 summary calibrates the other direction. Around 38% of Americans use tools like ChatGPT or Perplexity monthly, while 95% still rely on major search engines 15. This gap is important for VPs deciding how to weight surfaces in a monitoring plan. Standalone chat tools reach a real but minority audience each month; the search engine remains the dominant entry point, and the AI layer is increasingly stitched into it.
The operational implication is that a defensible visibility program covers three distinct surfaces: AI overviews inside Google, dedicated chatbots such as ChatGPT and Perplexity, and the traditional organic result set that still absorbs most search sessions. Weighting should reflect audience mix. A B2B category with heavy technical buyers will over-index on Perplexity and ChatGPT relative to consumer averages; a multi-location service brand serving local demand will lean toward Google AI Overviews, where the AI answer sits directly above the map pack and organic listings.
Sizing the surface first prevents the common failure mode of tracking one chatbot, declaring the program complete, and missing the surface where most of the category's answers are actually rendered.
A two-layer measurement model: signal above, outcome below
Signal layer: inclusion rate, citation share, prompt coverage, sentiment
The signal layer captures what happens inside the answer itself, before any click or session is recorded in an analytics tool. Four measurements carry most of the weight: inclusion rate, citation share, prompt coverage, and sentiment. Search Engine Land's operational guidance groups these under a broader visibility vocabulary that includes brand mentions, citations, destinations, prominence, and share of voice 7. Practitioner explainers converge on a similar shortlist of mention rate, mention position, sentiment score, and AI share of voice as the core inputs 12.
Inclusion rate : The share of prompts in a defined set that produce an answer mentioning the brand at all.
Citation share : Narrower: the percentage of answers that specifically link or cite the brand's owned domain, given that Pew found 88% of Google AI summaries cite three or more sources, making the citation slot a scarce and contested position 1.
Prompt coverage : Measures how many distinct buyer questions in the mapped set return the brand anywhere in the response, which is the closest analog to keyword coverage in traditional SEO.
Sentiment : Records whether the mention is neutral, favorable, or critical, since a mention paired with a negative comparison is not the same signal as a recommended-shortlist mention.
Search Engine Land's proposed heuristic, answers mentioning the brand divided by total answers in the category, sits inside this layer as a summary metric rather than the whole picture 8.
Outcome layer: branded search lift, direct and organic sourced pipeline, incrementality
The outcome layer is where the signal has to earn its budget. Three measurements do the connecting work: branded search lift, direct and organic sourced pipeline, and incrementality tested through matched-market or holdout designs. Gravity Global's LLM-first framework recommends pairing inclusion rate and citation rate with broader analytics and attribution reporting rather than treating visibility scores as terminal metrics 14. Market Science makes the same argument in stronger form: traditional measurement misses discovery moments happening inside AI answers, so the outcome layer has to be rebuilt to include upstream signals feeding into CRM-side pipeline data 13.
Branded search lift is the cleanest early tell. When inclusion rate rises in a defined prompt set, branded query volume and direct traffic typically move within days to weeks, and both are already instrumented in Google Search Console and web analytics. Direct and organic sourced pipeline extends that logic into the CRM: opportunities where the self-reported first touch or the last non-paid touch was direct navigation or organic search, filtered to accounts that fit the ideal profile.
Incrementality is the last mile. The PubMed-indexed literature on single-source data argues that advertising and promotion should be judged on incremental sales, not raw exposure, because correlation between exposure and purchase can be driven by targeting, seasonality, or existing intent 16. Applied here, that means visibility trends need a controlled comparison before they get credit for pipeline movement.
How the two layers connect without collapsing into attribution theater
The connection between the layers is directional, not deterministic. Signal-layer movement should precede outcome-layer movement by a measurable lag, and that lag becomes the diagnostic. If citation share rises for three consecutive sampling windows and branded search does not respond within the expected window, the prompt set is probably measuring answers buyers do not actually ask, or the mentions are surfacing without prominence. If branded search rises with no corresponding signal-layer movement, the driver is elsewhere: paid, PR, a product launch, or a competitor stumble.
Bain's framing of generative AI as a purchase-journey intermediary supports treating visibility as upstream of consideration rather than as a demand generator in its own right 9. That distinction keeps the model honest. Signal metrics do not close deals; they change the probability that a shortlisted brand appears at the moment a buyer is forming one. Attribution software that assigns a dollar value to each AI mention collapses this distinction and produces numbers that do not survive a CFO's audit. Two layers, one lag window, and a periodic incrementality test hold up better.
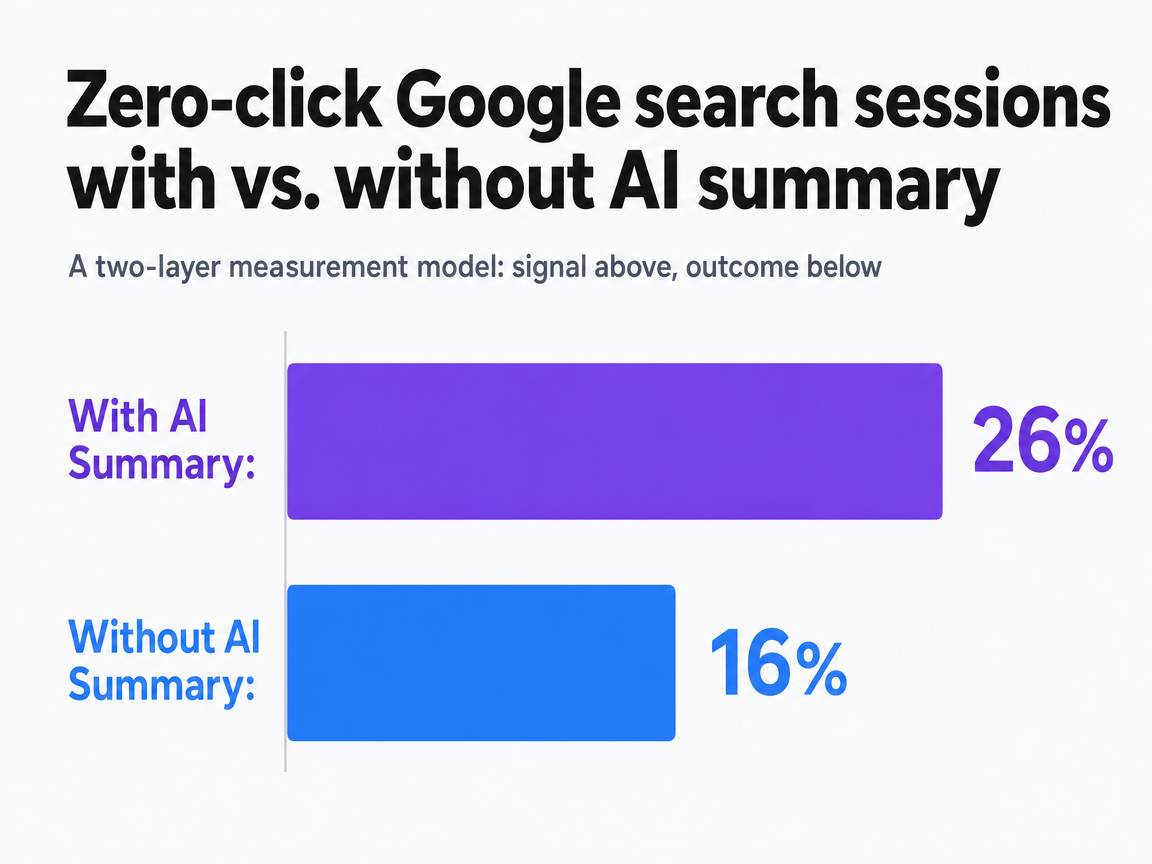 Zero-click Google search sessions with vs. without AI summary
Compares the percentage of Google search sessions that ended with no clicks, contrasting sessions that displayed an AI summary with those that did not.
Building the prompt set from real buyer research behavior
The prompt set is the instrument. If it does not reflect how buyers actually query AI surfaces, every downstream metric measures the wrong thing. Generic category prompts ("best CRM for startups") capture only a thin slice of what buyers ask, and they tend to over-represent shortlist queries that a brand either already wins or has no chance of entering.
Bain's 2025 research on AI search usage gives the design brief its numbers. ChatGPT prompt volume grew by roughly 70% during the first half of 2025, and shopping-related prompts rose from 7.8% to 9.8% of all queries in the same window 3. Two percentage points sounds small until it is applied against a base that itself grew 70%: commercial-intent volume inside a single chatbot roughly doubled in six months. That mix shift is the reason a defensible prompt set has to include purchase-adjacent queries, not just informational ones.
A working prompt set for a B2B or multi-location brand covers four bands:
- Category-definition prompts ("what is X and how does it work") test whether the brand appears in the definitional context buyers encounter first.
- Comparison prompts ("X vs Y for use case Z") test presence in the shortlist stage where citation share matters most.
- Problem-framed prompts ("how to solve problem P in industry I") capture the long tail of buyer research that rarely uses category names.
- Local or vertical qualifiers ("in [city]" or "for [vertical]") test the surfaces most likely to feed branded and geo-modified search.
Size the set to the category. Fifty to two hundred prompts is a reasonable working range for a mid-market B2B brand; multi-location operators need location and vertical variants that push the count higher. Rebuild the set quarterly against Google Search Console query data, sales-call transcripts, and support tickets. The prompts buyers actually type change faster than category taxonomy suggests.
Test AI-Driven Brand Visibility Impact in Real Time
Validate how AI-powered brand tracking delivers measurable pipeline insights using your actual campaigns and data.
Volatility is the metric: repeated sampling as the default
A single query to ChatGPT on a Tuesday morning is a data point, not a measurement. The arXiv preprint on measuring visibility in AI search argues that single observations mislead because a brand may appear in one response and disappear from the next, even when the prompt text is identical 6. Model updates, retrieval variability, session context, and temperature settings all inject noise into any one answer. Treating that noise as signal is how visibility dashboards produce charts that swing weekly for reasons unrelated to marketing activity.
The design fix is to treat visibility as a distribution and sample it repeatedly. Three dimensions matter: prompts, models, and time windows. Each prompt in the mapped set should run against each target model (ChatGPT, Perplexity, Gemini, Google AI Overviews, Claude) on a fixed cadence, with results aggregated into a rolling window before any metric is reported. A weekly report built from a single Monday pull will fluctuate wildly; the same report built from thirty runs across seven days per prompt-model pair produces a stable central tendency plus a variance band that itself becomes useful diagnostic data.
Cadence depends on category velocity. Fast-moving consumer categories with active news cycles warrant daily sampling. B2B and multi-location service categories can sit at two or three pulls per week per prompt-model pair without losing resolution. Reporting should always show the aggregated window and the variance, not the last observation. When variance narrows, the brand's position is stable; when it widens, something upstream changed and deserves investigation before the next executive readout.
From visibility to sourced pipeline: branded search lift and matched-market tests
Branded search and direct traffic as the first downstream tell
Branded search is the shortest bridge between the signal layer and the CRM. When a buyer reads an AI answer that names a brand favorably, the next action is rarely a click from that answer surface itself. Pew's browsing panel documented that clicks on traditional results fall from 15% to 8% when an AI summary is present, and 26% of AI-summary sessions end with no click at all 1. The follow-up behavior shows up somewhere else: a branded query typed into Google days later, a direct navigation to the homepage, or an organic click on a category page.
That makes branded query volume and direct traffic the first instruments to watch. Both are already reported in Google Search Console and standard web analytics, so no new pipeline plumbing is required to start. The operator move is to segment the branded and direct series by the same prompt themes used in the signal-layer prompt set. If comparison-stage citation share is climbing, branded queries pairing the brand name with competitor names should move first. If category-definition inclusion is climbing, homepage direct traffic and unbranded-to-branded transitions in Search Console should respond next.
Lag windows matter. Signal-layer changes typically precede branded search movement by one to four weeks in B2B categories with longer research cycles, and faster in consumer or local service categories.
Matched-market and holdout tests, borrowed from single-source data logic
Correlation between rising citation share and rising pipeline is not proof. The PubMed-indexed literature on single-source data made this point decades before AI answers existed: most measurement approaches failed because they never isolated the incremental sales that would not have happened without the marketing activity 16. Applied to visibility work, that means a rising inclusion rate that coincides with a product launch, a competitor outage, or a paid campaign refresh cannot be credited to visibility on the strength of the timing alone.
Two test designs carry this weight. A matched-market test pairs geographies with similar historical branded search, category demand, and pipeline behavior, then concentrates visibility investment (content refreshes, citation-earning PR, structured data work targeting AI overviews) in one market while holding the other flat. Sourced opportunity deltas between the two markets, measured over the lag window established in the branded-search stage, isolate the incremental contribution. A holdout test runs the same logic against an audience segment or account list rather than geography, suppressing visibility investment against a matched cohort.
Neither design is cheap, and neither runs monthly. A defensible cadence is one or two matched-market tests per year against the highest-priority prompt themes, with the branded-search leading indicator carrying the reporting load between formal tests. That sequencing gives visibility metrics the incrementality anchor that raw correlation cannot provide, and it survives the CFO question that ends most attribution conversations.
The substitution problem: rising visibility with falling clicks
Most visibility programs run into a reporting contradiction within the first two quarters. Inclusion rate and citation share climb steadily, yet organic sessions in analytics drift downward. Executives see the traffic line and question whether the visibility work is producing anything at all. The honest answer is that both trends can be true at once, and the model has to account for that or it will lose budget on a chart that tells only half the story.
Substitution is the mechanism. When an AI summary answers a buyer's question inside the search results page, the click that would have gone to a category page or blog post never happens. Pew's browsing panel showed sessions ending without any click rising to 26% when an AI summary was present 1. That traffic did not go to a competitor; it stopped existing as a click while the brand impression still occurred inside the answer. Traditional analytics has no field for that impression.
The corrective is to report visibility and clicks side by side, and to judge the pair against branded search and sourced pipeline rather than against each other. Rising citation share with falling non-branded clicks and rising branded queries is a healthy pattern. Rising citation share with flat branded queries and flat pipeline is the failure signal that deserves investigation.
See How AI-Driven Brand Visibility Metrics Directly Impact Your Marketing Pipeline
Request a detailed walkthrough of integrated AI brand visibility tracking and pipeline attribution—built for agencies and enterprise teams seeking data-backed, channel-spanning campaign optimization without additional headcount.
Reporting the model to a CRO or CEO at QBR
A defensible QBR slide on AI visibility contains three lines, not thirty:
- The first line reports signal-layer movement: inclusion rate and citation share across the mapped prompt set, shown as a rolling window with variance bands rather than a single week's pull.
- The second line reports the downstream tell: branded search volume and direct traffic segmented by the same prompt themes.
- The third line reports the incrementality read: the most recent matched-market or holdout result, or the date the next test closes.
Framing matters more than the chart count. Bain's work on AI as a purchase-journey intermediary supports positioning visibility as an upstream demand signal rather than a revenue driver in its own right 9. Practitioner frameworks recommend pairing inclusion and citation rates with the analytics and attribution reporting executives already trust, so visibility does not arrive as a parallel system competing for credit 14.
Lead with the trade-off. Non-branded organic clicks may be falling while citation share and branded queries climb. That pattern is a healthy substitution, not a failure, and naming it before the CRO does keeps the conversation on the model instead of the traffic line.
If a portfolio operator runs many locations: consolidating the visibility budget
The audience shifts here. Everything above assumed a single brand running one visibility program. Portfolio operators — dental support organizations, senior living groups, multi-branch law firms, home services franchises — face a different math problem. Each location has its own local prompt surface (geo-modified queries, city-level comparisons, vertical-plus-region combinations), and the naive answer is to run a per-location tracker. That answer scales badly.
The consolidation case rests on shared infrastructure. Prompt sampling, model coverage, and repeated observation (the volatility discipline from the arXiv GEO work applies here too) 6 are fixed costs that do not multiply cleanly with location count. A single measurement stack running one core prompt set plus location and vertical variants captures the same signal-layer metrics — inclusion rate, citation share, prompt coverage — across the whole portfolio at a fraction of the per-location cost.
The variables that actually drive budget are explicit:
L : location count
P : core prompts per location
V : variants per location
M : models sampled
C : pulls per week
Total observations per week scale as L × (P + V) × M × C. Portfolio operators can hold P, M, and C constant across locations and only expand V for markets that warrant it.
| Variable | Per-location tools | Consolidated stack |
|---|---|---|
| Prompt set design | Rebuilt per location | Core set + geo variants |
| Model coverage | Duplicated L times | Shared across L |
| Sampling cadence | Set per location | Uniform, comparable |
| Reporting | L separate views | Portfolio roll-up + drill-down |
The reporting advantage compounds the cost advantage. A uniform sampling design lets a DSO or senior living group rank locations by citation share against local competitors, spot which markets are gaining or losing ground in AI overviews, and route content or PR investment to the weakest performers. Practitioner frameworks that recommend linking visibility metrics to stakeholder reporting assume this kind of comparability 14; per-location tools rarely produce it.
Where an approval-first execution layer fits after the model is defensible
The measurement model comes first. Once inclusion rate, citation share, branded search lift, and a matched-market read are running, the constraint shifts from knowing what to fix to shipping the fixes fast enough to matter. Signal-layer movement decays if content refreshes, structured data updates, and citation-earning assets take a quarter to produce.
That is where an approval-first execution layer earns its place. Practitioner frameworks recommend linking visibility metrics directly to the production work that moves them, not routing findings through a separate briefing cycle 14. Vectoron organizes specialist strategists around that loop: ranked recommendations tied to visibility signals, human sign-off on every action, and execution across content, SEO, and PR without adding headcount.
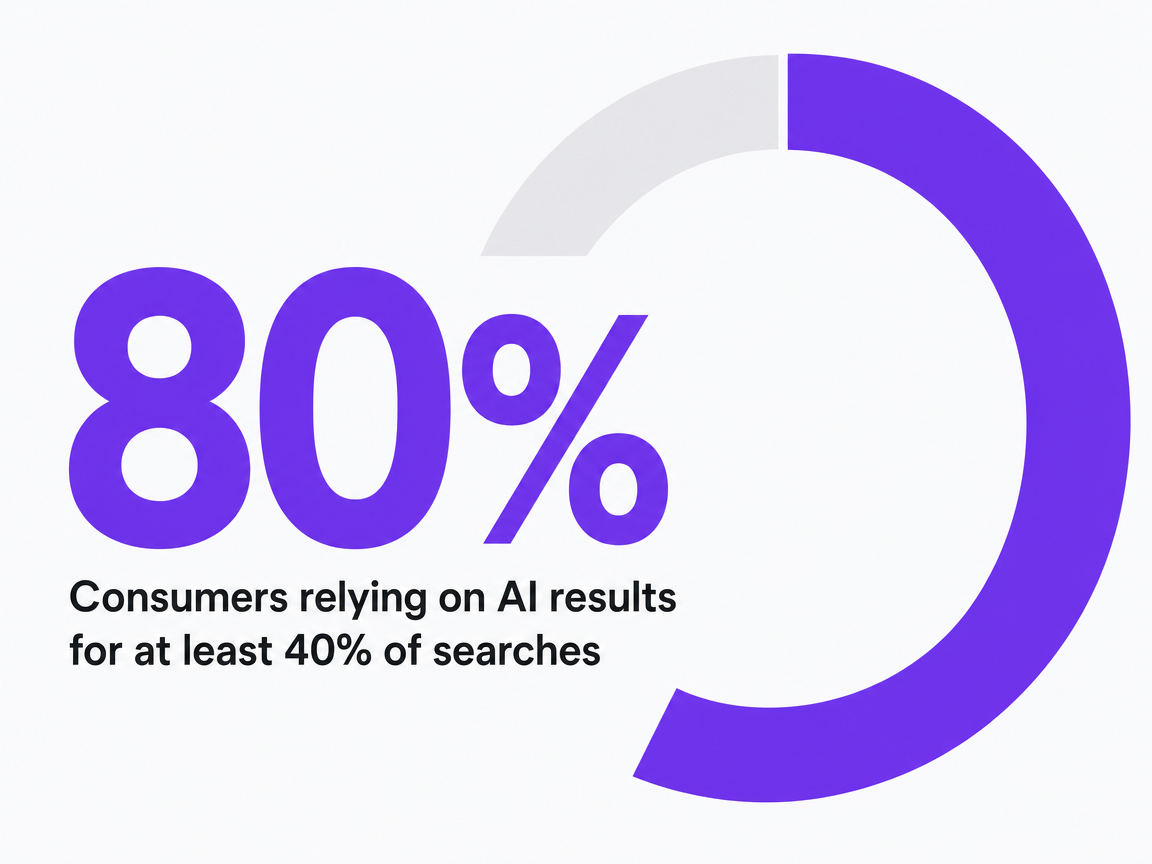 Consumers relying on AI results for at least 40% of searches
Consumers relying on AI results for at least 40% of searches
Frequently Asked Questions
References
- 1.Do people click on links in Google AI summaries?.
- 2.Consumer reliance on AI search results signals new era of marketing.
- 3.How Customers Are Using AI Search [2025 Research].
- 4.Why Consumers Choose an AI Chatbot over a Search Engine.
- 5.AI-related browsing and search behavior report.
- 6.Don't Measure Once: Measuring Visibility in AI Search (GEO).
- 7.Measuring zero-click search: Visibility-first SEO for AI results.
- 8.How to measure your AI search brand visibility and prove value.
- 9.Marketing's New Middleman: AI Agents.
- 10.A Population-Normalized Metric for Tracking Global AI Usage.
- 11.How to Make Effective Disclosures in Digital Advertising.
- 12.What Is LLM Visibility and Why Does It Matter?.
- 13.AI Is Breaking Brand Visibility and Marketing Measurement.
- 14.Measuring Brand Impact in an LLM-First world: A Practical Framework for ....
- 15.Our Top 5 Blog Posts in 2025 to Help You With Your Marketing in 2026.
- 16.Getting the most out of advertising and promotion.