Key Takeaways
- Centralized reputation management ranks first because formalized response protocols correlate with 22% higher new patient inquiry volume and apply once across every location without touching PHI 3.
- Integrated analytics earns the second slot because every tactic below it depends on reconciling spend to booked visits, delivering 20% lower CPA and 12-15% higher patient volume growth 8.
- Service-line content compounds because one medically reviewed library distributes across all clinics offering the procedure, supporting 15-22% higher new patient volume and 40% faster time-to-market 10.
- Local search and templated location pages capture the 77% of consumers who begin provider search online, with one schema and console managing all sites at near-zero HIPAA load 7.
- First-party data capture only ships when the CDP holds non-clinical signals, the EHR holds treatment data, and a signed BAA plus consent gate define a one-directional perimeter 5.
- AI personalization delivers 28-35% higher email engagement and 19-24% higher conversion, but only when restricted to declared interest, geography, and behavior — never inferred clinical state 1.
- Short-form video and testimonial programs drop to seventh because production reproduces labor per shoot, salvaged only by a release library and concentration on evergreen service-line assets.
- Compliant chatbots support conversion rather than generate demand, deflecting calls and capturing after-hours bookings under the same CDP-EHR perimeter with one configuration covering the footprint.
- Structured referrals generate 16-22% of new patient volume at 40-60% lower CAC, but only after analytics, content, reputation, and consent layers are already operational 2.
Why Tactic Lists Fail at 30 Locations
Most healthcare marketing articles hand a VP a menu. The VP already has the menu. What collapses at 30 locations is not awareness of tactics — it is the math underneath them.
Two constraints define the problem. First, capacity: 67% of healthcare organizations report insufficient internal bandwidth to manage multi-location marketing, and the average team runs 3.2 locations with 1.8 dedicated staff per location 6. Stretch that ratio across a 30-site footprint with three or four service lines and the staffing gap is not a hiring problem — it is a production model problem. Second, the per-location retainer structure scales linearly. Each new clinic adds another local agency invoice, another point of contact, another set of one-off landing pages, another reputation feed nobody monitors after week six.
A tactic list assumes the work gets done. At 30 locations, the binding question is whether a tactic can be built once and distributed across N sites, or whether it reproduces labor every time the footprint grows. Reputation responses, location pages, and service-line content behave very differently under that test than per-location paid campaigns or bespoke video shoots.
The ranking that follows applies that filter explicitly, before the ideas appear.
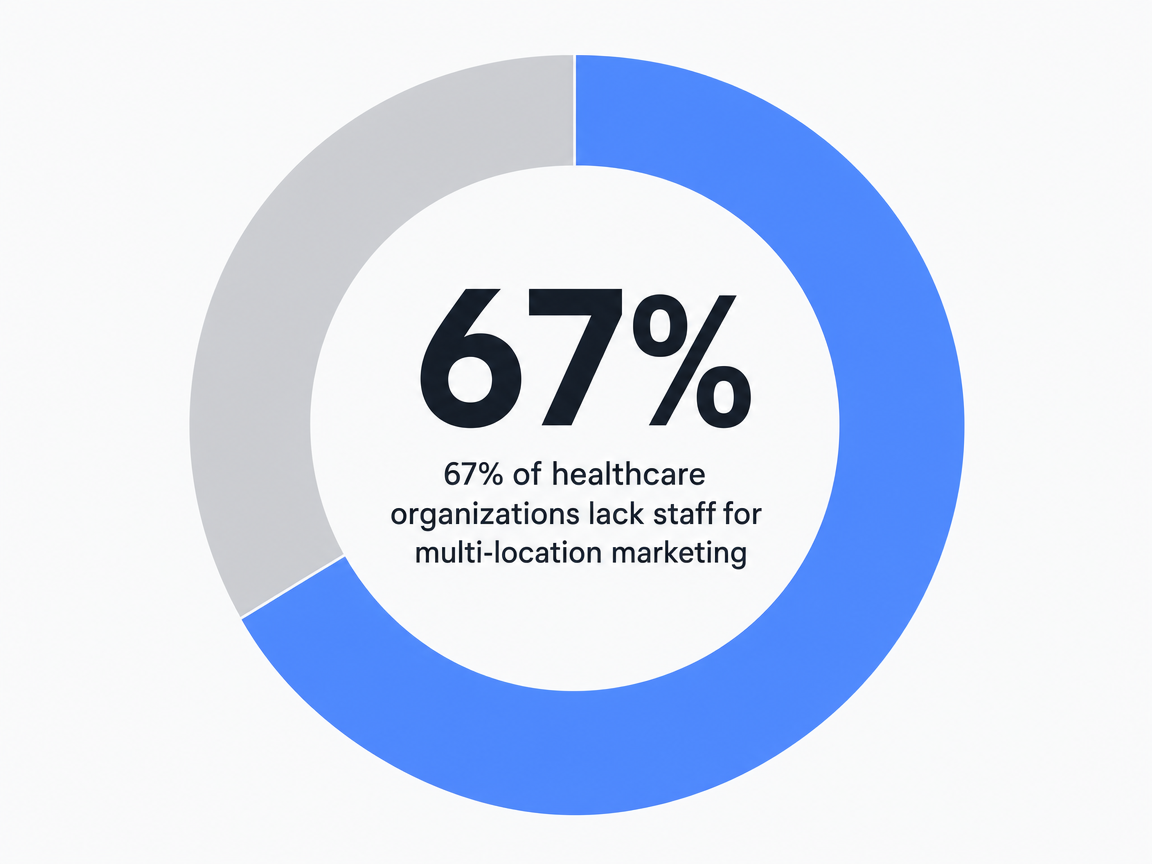 67% of healthcare organizations lack staff for multi-location marketing: 67%
The Three Filters Behind the Ranking
Three filters decide where each idea lands. The first is sourced volume signal: does a peer-reviewed or benchmark dataset tie this tactic to incremental patient volume or lower acquisition cost? Tactics with a quantified inquiry, conversion, or CPA delta rank above tactics with only directional evidence.
The second is account-level scaling behavior. A tactic that builds once and distributes across all sites — a reputation response protocol, a service-line content library, a location-page template — compounds as the footprint grows. A tactic that reproduces labor every time a clinic opens — bespoke video shoots, per-location paid campaigns managed by separate agencies — fragments under a flat budget.
The third is absorbable HIPAA execution load. Tactics that operate on non-PHI signals (geography, page behavior, marketing-consent email) clear OCR review with a documented BAA and consent gate. Tactics that touch the EHR perimeter need a CDP boundary and release library before they ship. The further a tactic sits from PHI, the faster it deploys.
The nine ideas below are sequenced by how they perform against all three.
Test Data-Driven Healthcare Content Creation Now
See firsthand how automated content workflows support multi-location patient acquisition before making a commitment.
The Nine Ideas, Ranked by Patient Volume per Marketing Dollar
1. Centralized Reputation Management Across Every Location
Reputation ranks first because it has the cleanest volume signal in the supplied evidence and the lowest HIPAA execution load. A Health Affairs framework on healthcare reputation management found that systems with formalized review monitoring and response protocols see 26-34% higher average rating scores, 22% higher new patient inquiry volume, and 2.1x engagement when responses go out within 24-48 hours 3. The signal is volume, not vanity: stars and response cadence move inquiry counts the front desk can verify against the schedule.
The account-level scaling case is just as direct. A response protocol — tone, escalation paths, clinical-detail redaction rules, sign-off authority — is written once and applied across 30 sites. Review aggregation, alerting, and SLA tracking sit at the account layer. The per-location work shrinks to a clinic lead approving drafted responses, not authoring them. That is the inversion the per-location retainer model can never deliver, because each retainer is incentivized to produce its own playbook.
HIPAA load is light when the perimeter is drawn correctly. Responses acknowledge experience without confirming a treatment relationship, never reference visit specifics, and route any clinical complaint off-platform to a designated contact. No PHI crosses the public surface. A documented response library, reviewed by counsel once, is reusable across every site and every service line.
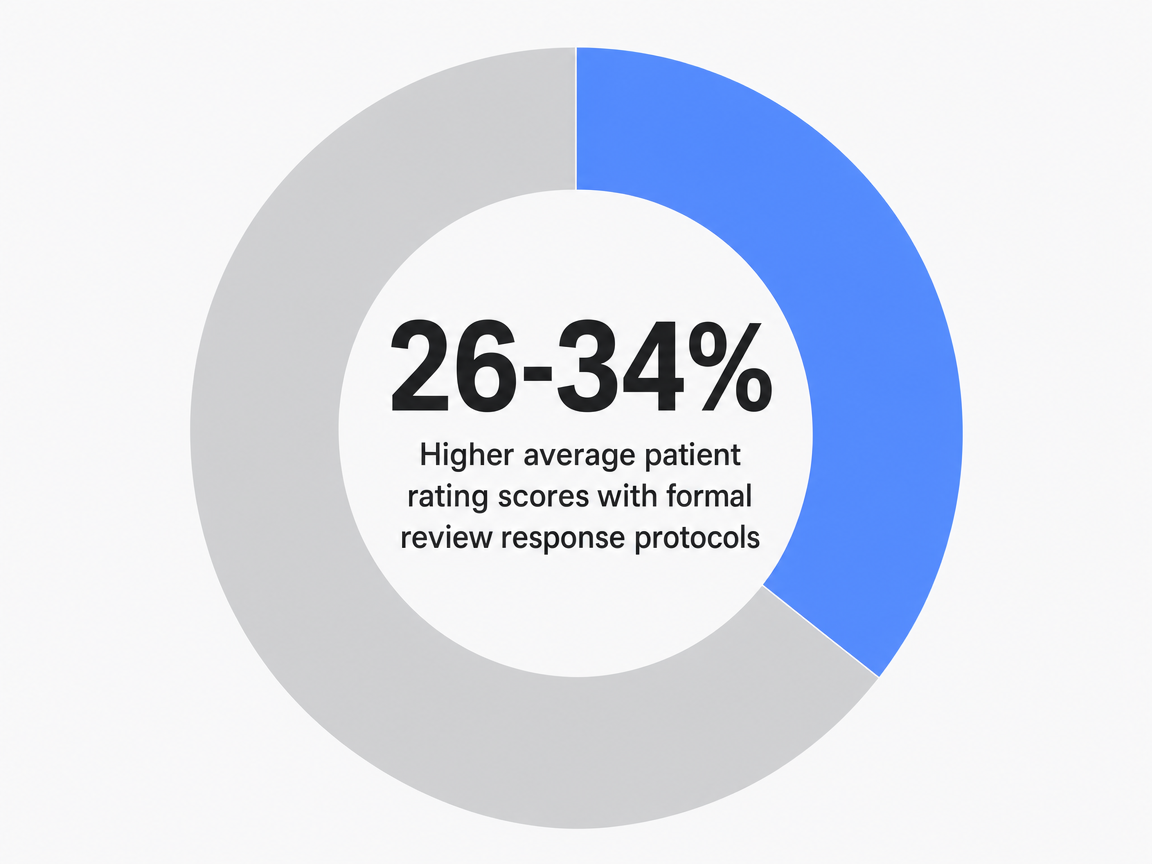 Higher average patient rating scores with formal review response protocols: 26-34%
2. Integrated Analytics That Tie Spend to Booked Visits
Analytics ranks second because every tactic below it inherits its measurement layer. A Health Affairs analysis of integrated digital marketing systems found that healthcare organizations running unified analytics across channels see 12-15% higher patient volume growth and 20% lower marketing cost-per-acquisition than peers using channel-siloed reporting 8. The delta is not a reporting upgrade — it is a reallocation upgrade. When the system can see which campaign produced a booked visit at which clinic, dollars move out of the channels that look busy and into the ones that fill chairs.
At 30 sites the integration job is the work. GA4, Search Console, the call-tracking layer, the scheduling system, and the ad accounts have to map to a single account-level patient identifier that respects the EHR boundary. Conversion events stop at the booked-visit signal; clinical outcomes stay inside the EHR. That perimeter is non-negotiable for OCR review, but it is also sufficient for the attribution work a CFO actually asks about: cost per booked visit by service line, by location, by channel.
Per-location agencies cannot deliver this. Each retainer reports inside its own funnel, and the operator pays N times to learn N partial truths. An account-level analytics build, done once, is what makes the next seven tactics legible to finance.
3. Service-Line Content as the Highest-Leverage Organic Asset
A McKinsey analysis of healthcare patient-experience economics found that organizations with strong patient-experience marketing see 15-22% higher new patient volume, 18-25% higher patient lifetime value, and 40% faster time-to-market on integrated content programs 10. Service-line content is where those numbers compound, because one well-built orthopedic knee-replacement hub or cataract-surgery library serves every clinic in the footprint that offers the procedure.
The leverage math is what earns the third slot. A 30-page service-line library, written once with medical-accuracy review and signed off by a clinical lead, distributes across 30 location pages with localized variants for surgeon names, clinic addresses, and intake numbers. The asset count is 30 pages of source content and 30N location variants. Under a per-location retainer, the same coverage is 30N original briefs, each scoped, paid for, and reviewed separately.
HIPAA load is contained in the source layer: medical accuracy review, citation discipline on outcome claims, and a release library for any patient-story content. Localization variants do not re-trigger clinical review because the clinical substrate is fixed. The result is a content engine where the marginal cost of adding a clinic to a service-line campaign is template population, not editorial production.
4. Local Search and Location Pages at Account Scale
Local search ranks fourth because the consumer-behavior evidence is unambiguous and the build is templated. A Pew Research Center study of healthcare consumer behavior found that 77% of consumers begin provider search online, 68% of those searches happen on mobile, 89% of provider selection decisions are influenced by online reviews, and 56% use Google Maps for location information 7. At 30 sites those four numbers are the funnel: a clinic that does not surface in the local pack on a mobile map is invisible to the majority of demand in its catchment.
The execution pattern is account-level. One location-page schema — NAP, hours, services, providers, insurance, schema.org/MedicalClinic markup, embedded reviews, intake link — is built once and populated 30 times. Google Business Profile management, citation cleanup, and category alignment run from a single console. Per-location agencies tend to ship 30 different page templates with 30 different schema implementations, which is why local search is often the easiest audit to win on takeover.
HIPAA load is effectively zero. The signals are address, hours, services, and reviews — none of which intersect the EHR perimeter when handled inside the reputation rules already established above.
5. First-Party Data Capture and the CDP-EHR Boundary
First-party data is the priority layer the industry already named. The American Hospital Association's 2025 marketing trends report found that first-party data strategies are now the top priority for 73% of healthcare marketing leaders, and 68% report concerns about third-party data deprecation 5. The work is no longer optional, but the execution detail that decides whether the program ships is the perimeter between the customer data platform and the electronic health record.
The boundary, drawn explicitly: the CDP holds marketing-consent email, page-behavior signals, ad-click identifiers, form-fill metadata, geography, service-line interest, and appointment-request timestamps. The EHR holds diagnoses, treatment plans, clinical notes, lab results, and any data tied to a treatment relationship. The signals that legitimately cross are limited and one-directional — typically a hashed identifier confirming an appointment booked, not what the appointment was for. A signed BAA with the CDP vendor, a documented consent gate at every form, and an audit trail of which fields populate which audiences are the three artifacts that survive OCR review.
This perimeter, defined once, is what every tactic ranked below this point depends on. Personalization, paid retargeting, and lifecycle email all draw from the CDP, never from the EHR. When the boundary is documented and counsel signs it once, the next four ideas ship without re-litigating compliance per campaign.
6. AI Personalization on Non-Clinical Signals Only
Personalization ranks sixth because its volume case is real but conditional. A Forrester analysis of AI-driven personalization in healthcare marketing reported 28-35% higher email engagement, 19-24% higher landing-page conversion, and 15-20% higher patient lifetime value compared with non-personalized approaches 1. Those numbers assume the underlying data layer exists. Without the CDP-EHR boundary already drawn, personalization either ships unsafely or ships hollow.
The execution rule is narrow: personalize on the non-clinical signals already approved in the CDP — service-line interest declared on a form, geography, page-behavior segments, appointment-request stage, marketing-consent email lifecycle. Do not personalize on inferred clinical state, even when behavioral signals make inference tempting. A page visit to a knee-replacement guide is a content interest, not a diagnosis, and the creative copy must reflect that distinction.
Account-level scaling is strong here because the personalization rules — segment definitions, dynamic content blocks, journey logic — live in the CDP and fire across every clinic. Per-location personalization, run by separate agencies on separate stacks, is where most operators discover their audiences are inconsistent and their consent records do not reconcile across sites.
7. Short-Form Video and Patient Testimonial Programs
Video drops to seventh on the scaling filter, not the volume filter. Production reproduces labor per shoot, per provider, per location, and the asset library decays as staff turn over. The dependency on the layers above is what salvages the slot: testimonial programs require the release library built for service-line content, and distribution depends on the local-search and reputation surfaces already in place.
The disciplined version concentrates production on service-line evergreen — procedure explainers shot once with a clinical lead, patient stories with full HIPAA-compliant releases on file, and short clinic walkthroughs that double as Google Business Profile assets. One shoot day per quarter, captured at a flagship site, yields a quarter's worth of distributable content across every clinic offering the service line.
The release library is the compliance asset. A patient appearing on camera signs a marketing-specific release that is separate from the standard treatment authorization, names the channels and the duration, and is logged in a system the marketing team can audit. Without that library, the program does not ship.
8. Compliant Chatbots for Scheduling and FAQ Deflection
Chatbots earn the eighth slot because the operational case — call-volume deflection, after-hours scheduling capture, intake triage — is real, but the patient-acquisition lift is indirect. The bot supports conversion on traffic the layers above already produced. It does not generate demand on its own.
The execution perimeter is the same CDP-EHR rule applied to a synchronous channel. The bot answers hours, locations, services, insurance acceptance, and intake-form questions. It books appointments by writing to a scheduling system that respects the BAA. It does not provide clinical advice, does not confirm conditions, and routes any symptom-related query to a triage path with a human or a documented disclaimer. Conversational logs are stored under the same retention and access controls as any other patient communication channel.
At account scale, one bot configuration covers the footprint with location-aware routing. Per-location chatbot deployments — separate vendors, separate consent flows, separate logs — are an audit problem disguised as a technology choice.
9. Service-Line Segmentation and Structured Referrals
Segmentation and referrals close the ranking because the evidence is strong but the dependency stack is the longest. A RAND economic analysis of patient referral programs found that structured referrals generate 16-22% of new patient volume at 40-60% lower CAC than paid advertising 2. An Advisory Board analysis of local market dynamics found that providers focused on differentiation and targeted patient acquisition see 2-3x higher growth than generic share-of-voice campaigns, against 15-20% annual switching in consolidated markets 4. Both numbers are large. Both require everything above them to be in place first.
Segmentation depends on the analytics layer to identify which service lines have unmet capacity and which catchments have switching demand. Referral programs depend on the CDP for activation tracking, the content library for shareable assets, the reputation surface for social proof, and the consent layer for outreach. Without those substrates, a referral program is a paper incentive that nobody administers consistently across 30 sites.
Built on the foundation, referrals become the highest-CAC-efficiency channel in the mix. Built without it, they are the tactic operators relaunch every two years and quietly retire each time.
Per-Location Retainer vs. Account-Level Execution at 30 Sites
The decision a 30-site VP actually faces is not agency versus in-house. It is whether the marketing operating model scales linearly with the footprint or executes once at the account layer and distributes outward. The variables below are the ones supported by the reference map. Operators should plug in their own retainer rate rather than imported averages.
| Variable | Per-Location Retainer Model | Account-Level Execution Layer |
|---|---|---|
| Cost scaling | Operator's monthly retainer × 30 sites, plus per-location production fees | Single account fee covering all sites and service lines; 35-40% lower marketing overhead at the platform layer 9 |
| Cost per booked visit | Channel-siloed reporting per agency; attribution does not reconcile across sites | 20% lower marketing cost-per-acquisition under integrated analytics 8 |
| Patient volume growth | Variable by retainer; no shared measurement standard | 12-15% higher patient volume growth with integrated frameworks 8 |
| Reputation output | 30 separate playbooks, inconsistent response cadence | 22% higher new patient inquiry volume from formalized, centralized protocols 3 |
| Content time-to-market | 30N original briefs, scoped per location | 40% faster execution on integrated content programs 10 |
| Staffing load | Coordination drag against the 1.8-staff-per-3.2-locations ratio 6 | Approval and publishing managed centrally; per-clinic work shrinks to sign-off |
At five sites the retainer model holds. At thirty, every variable in the table breaks at once: cost grows linearly while output fragments, reporting reconciles to nothing finance can defend, and the in-house team spends its hours coordinating vendors instead of compounding assets.
See How Leading Healthcare Networks Scale Patient Acquisition—Without Agency Retainers
Get a personalized walkthrough of AI-driven marketing workflows proven to reduce costs and accelerate patient growth for multi-location healthcare organizations and digital agencies managing complex service lines.
Sequencing the Nine Across a 12-Month Operating Plan
Selection without sequence kills the lift. The dependency stack runs in one direction: measurement and reputation feed everything below them, the data perimeter feeds personalization and segmentation, and demand-capture surfaces feed referrals.
Q1 — Foundation. Stand up integrated analytics, centralized reputation management, and the location-page and local-search rebuild. These three carry the largest sourced volume signals and the lowest HIPAA load, and they produce the measurement layer the next nine months depend on. Expect 20% lower cost-per-acquisition once attribution reconciles to booked visits 8 and 22% higher inquiry volume from a formalized response protocol 3.
Q2 — Compounding assets. Build the service-line content library and close the CDP-EHR boundary with counsel. Content distribution rides the local-search surface stood up in Q1; first-party data capture rides the consent gates already on every form. The 73% of marketing leaders prioritizing first-party data are mostly stuck in this quarter 5.
Q3 — Activation. Layer AI personalization on the CDP audiences and ship the patient-testimonial program against the release library.
Q4 — Yield. Deploy the chatbot and structured referral program on the demand the prior nine months produced.
What Replaces the Per-Location Agency Stack
The replacement is not another agency. It is an account-level execution layer that runs strategy, content, reputation, local search, and paid work from a single plan across the full footprint, with the CDP-EHR perimeter and release library treated as shared infrastructure rather than per-clinic improvisation. Gartner's 2025 vendor framework puts the overhead reduction at 35-40% when healthcare operators move from traditional agencies to integrated platforms 9. Vectoron is one expression of that model, built for multi-location operators who need the nine ideas above sequenced, executed, and reconciled to booked visits without adding headcount or coordinating thirty retainers.
Frequently Asked Questions
References
- 1.AI-Driven Personalization in Healthcare Marketing: Technology & Tactics.
- 2.Patient Referral Programs as Growth Engine: Healthcare Marketing Economics.
- 3.Reputation Management Systems for Healthcare: Organizational Approach to Online Presence.
- 4.Healthcare Provider Market Share Dynamics: Local Competition & Patient Acquisition Strategy.
- 5.American Hospital Association – 2025 Healthcare Marketing Trends Report.
- 6.Medical Group Management Association – Healthcare Marketing Capacity Study 2025.
- 7.Pew Research Center – Healthcare Consumer Behavior & Digital Preferences 2024.
- 8.Health Affairs – Digital Health Marketing Efficiency & Healthcare System ROI.
- 9.Gartner – Healthcare Marketing Automation & Vendor Selection Framework 2025.
- 10.McKinsey & Company – Healthcare Marketing & Patient Experience Economics.