
Key Takeaways
- Reporting automation is now table stakes, not a differentiator—margin gains come from redesigning the operating model around reclaimed hours, not from buying faster tooling.
- Agencies face two forks: cut costs and compete on price, or redirect freed analyst capacity into priced strategic scope that raises deliverable density per retainer.
- Accounts-per-analyst is the cleanest portfolio signal that automation changed unit economics, moving from 12–15 under manual reporting to 30–40 when reporting ties to execution.
- Keep humans on causal interpretation, client-specific recommendation weighting, and renewal conversations—approval-gated automation protects the judgment layer clients actually pay for 7.
The Margin Problem Hiding in Your Reporting Stack
Most agency owners can name their gross margin to the percentage point. Fewer can name how many analyst hours per month get spent assembling client-ready SEO reports that no one reads past page two. That gap is the margin problem.
The reporting layer has quietly become one of the largest non-billable cost centers inside a retainer. Pulling rankings, stitching Search Console exports, annotating GA4 anomalies, writing the executive summary, formatting the deck, sending the recap email—each touch is small. Multiplied across 40, 80, or 150 accounts, it consumes a meaningful share of the senior staff hours that were supposed to be spent on strategy. McKinsey estimates that current generative AI and adjacent technologies could automate work activities absorbing 60 to 70 percent of employees' time, with data collection, analysis, and reporting cited among the most automatable knowledge-work tasks 10. SEO reporting sits squarely inside that envelope.
The reflex move is to buy a reporting tool, schedule the PDFs, and call the hours saved. That captures cost reduction. It does not expand margin. PwC frames the choice plainly: AI in marketing can either make the work cheaper or make it matter more, and most operators default to cheaper because it is easier to measure 5. This article treats automated SEO reports as an operating-model decision, not a tooling one—and quantifies what changes when the reclaimed hours are redirected into priced strategic output instead of absorbed back into overhead.
Why Reporting Automation Stopped Being a Differentiator
Adoption Caught Up to the Promise
Reporting automation used to be a pitch deck slide. It is now a baseline expectation. McKinsey's 2024 global AI survey of organizations across industries found that 65 percent regularly use generative AI in at least one business function, up from 33 percent the prior year 1. Professional services posted some of the largest year-over-year increases in that survey, which means the agencies competing for the same retainers are running the same playbook.
What this does to agency positioning is straightforward. Five years ago, an agency that delivered a Looker Studio dashboard with auto-refreshed rankings, traffic, and conversion data looked technically ahead of its peers. Today, the prospect on the other side of the sales call has likely seen four versions of that same dashboard from four other agencies in the same week. The artifact no longer signals capability. It signals parity.
The strategic consequence: reporting automation has moved from the value column to the cost-of-entry column. Agencies still need it—the alternative is uncompetitive economics—but they no longer get paid more for having it. Any margin story built on "we automate reports faster than the next agency" is a story with a short half-life. The differentiator has shifted from whether reports are automated to what the agency does with the hours that automation returns.
The Adoption-to-Value Gap
Adoption is not the same as value realization. McKinsey's 2025 global AI survey reports that nearly nine in ten organizations regularly use AI, yet most have not realized material enterprise-level benefits from it 11. The deployment curve has outrun the operating-model curve.
For agencies, this gap shows up in a familiar pattern. The reporting platform is configured. PDFs ship on the first of the month. The analyst who used to spend two days assembling the deck now spends six hours reviewing and annotating it. The hours saved get reabsorbed into Slack threads, client calls, and the next QBR—not redirected into priced strategic output. Gross margin moves a point or two and stalls.
BCG's 2025 analysis of AI in marketing argues that the larger prize comes from reinventing the operating model, not from accelerating individual tasks inside the existing one 3. Translated to agency P&Ls: automating the report inside a delivery model designed around manual reporting is a local optimization. It trims cost without changing the unit economics of the retainer.
The agencies that convert automation into margin do something different. They redesign what an account team looks like, how many accounts each strategist carries, and what the client buys. That is the work the rest of this article quantifies.
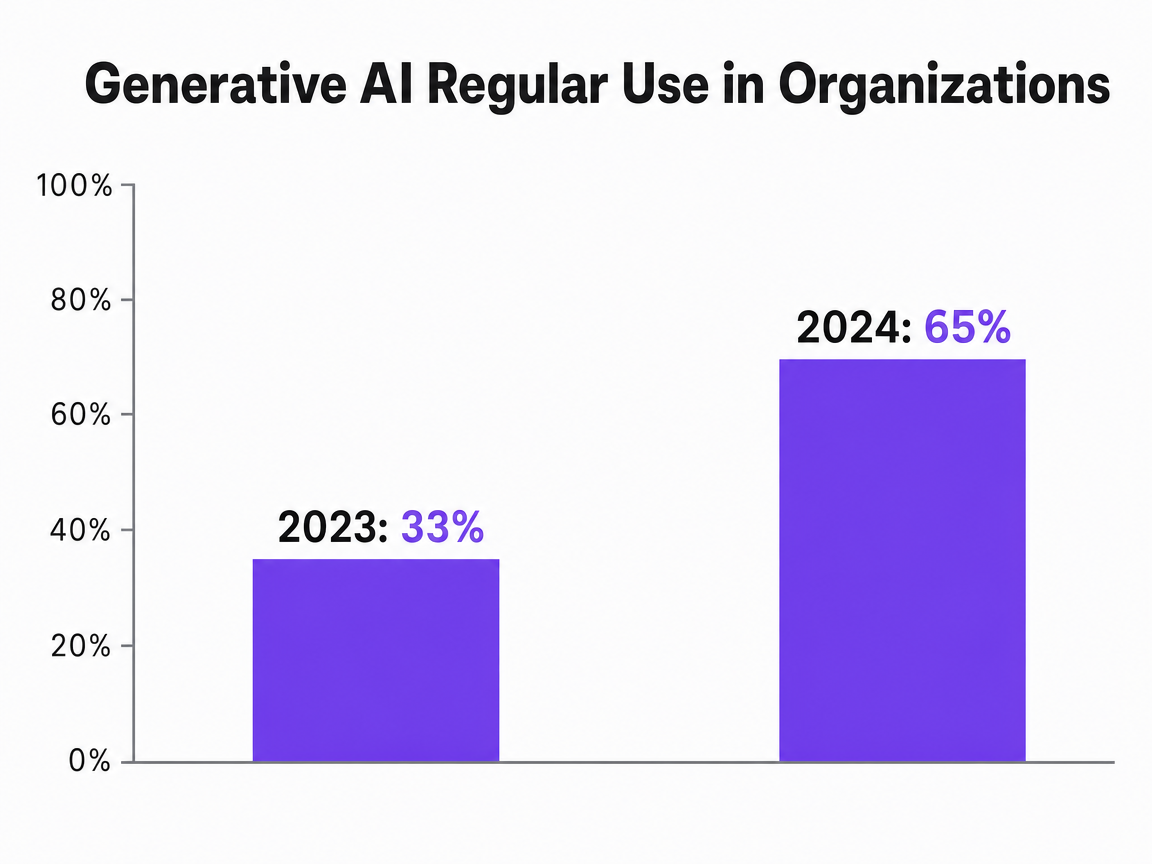 Generative AI Regular Use in Organizations
Shows the year-over-year growth of regular generative AI use in organizations, comparing 33% in 2023 to 65% in 2024. Suitable for a bar chart comparison.
Two Forks: Cost Less or Matter More
Every agency deploying automated SEO reports lands on one of two trajectories, whether the owner has named the fork or not. PwC describes the choice in blunt terms: AI in marketing can make the work less expensive—faster content, smaller budgets, leaner teams—or it can make the work matter more by raising the quality of insight and the relevance of recommendations 5. Both are legitimate strategies. They produce different agencies.
The cost-less fork treats automation as a substitution play. Reports that used to take eight analyst hours now take one. The agency keeps pricing flat, pockets the labor delta, and competes on retainer price against agencies doing the same thing. Margin expands in the short run. The structural problem arrives later: when every competitor has the same automated reporting stack, price becomes the only remaining variable. Retainers compress. The agency wins the cost race and loses the category.
The matter-more fork treats automation as a redirection play. The same hours come back, but they get reinvested into work the client could not previously buy at that price point—competitive intelligence, content strategy tied to pipeline data, AI search visibility audits, monthly reforecasts of channel mix. The retainer stays the same or rises. The deliverable density increases. Margin expands because the cost-to-serve drops while the priced scope grows.
PwC's data-backed argument is that the cost-less path is easier to execute and harder to defend 5. The matter-more path requires harder choices about what the agency now sells, how strategists spend their reclaimed hours, and how clients are repriced against the new scope. The capacity math in the next section is what makes either fork measurable instead of theoretical.
Experience Automated SEO Reporting at Scale
Test real-time SEO reporting workflows and publish actual deliverables in a live agency environment for seven days.
The Capacity Math: What Automated Reports Actually Free Up
Where the Hours Hide in a Retainer
The reporting line item in a typical SEO retainer is invisible because it is scattered. No invoice ever reads "reporting: $1,400." The cost lives inside the analyst's calendar, broken into half-hour and forty-five-minute fragments across the month.
A realistic decomposition for a single mid-tier account looks like this:
- Two hours pulling and reconciling data across Search Console, GA4, rank trackers, backlink tools, and call tracking.
- One hour reviewing anomalies and tagging the ones that need explanation.
- Two hours writing the executive summary, building the narrative, and annotating screenshots.
- One hour formatting the deliverable to match the client's brand template.
- Forty-five minutes on the recap email and any pre-meeting prep.
- Another hour on the QBR or check-in call where the report gets walked through.
That is roughly seven to eight hours per account per month before a single strategic recommendation gets drafted.
Multiply across a 60-account book carried by four analysts and the reporting layer absorbs around 450 hours monthly—close to three full FTEs of senior staff time that the retainer is not explicitly paying for. McKinsey's analysis of generative AI's productivity frontier estimates that current generative AI and adjacent technologies have the potential to automate work activities absorbing 60 to 70 percent of employees' time, with data collection, analysis, and reporting cited as among the most automatable knowledge-work tasks 10. Applied to that 450-hour pool, the addressable reclaim sits between 270 and 315 hours per month.
Converting Reclaimed Hours Into Priced Output
Reclaiming 270 hours a month does not automatically expand margin. What happens to those hours is the entire question. Three patterns dominate, and only one of them moves the P&L.
- Pattern one: the hours disappear into the existing workload. Analysts use the recovered time to catch up on Slack, attend more internal meetings, and absorb scope creep that was previously deferred. Utilization stays flat. Margin moves a point and stops.
- Pattern two: the hours are removed from the cost base through headcount reduction. The agency runs leaner, gross margin improves on paper, and the client deliverable narrows to the automated artifact. Retention softens within two to three renewal cycles because the relationship thinned out alongside the cost.
- Pattern three: the hours are repriced. Each analyst's recovered capacity—call it 60 to 80 hours per month at the portfolio level above—gets redirected into deliverables the agency now sells as part of the retainer or as add-on scope. Competitive content gap analysis. Monthly schema audits. AI search visibility reviews. Conversion path diagnostics tied to call tracking data. The retainer price holds or rises; the cost-to-serve drops because the labor inputs to the baseline report have collapsed.
Deloitte's State of AI survey found that 66 percent of organizations report productivity and efficiency as the top realized benefit of enterprise AI adoption 7. That benefit is real, but for agencies it converts to margin only when the reclaimed capacity is matched to billable scope inside the same retainer. The conversion rate from saved hours to priced hours is the variable that separates the agencies expanding margin from the agencies running the same automation stack at flat economics.
Reporting Economics Across an Agency Portfolio
This section is written for agency owners managing 25 or more client accounts, where reporting cost compounds into a portfolio-level P&L issue rather than an individual account inefficiency.
At portfolio scale, the cost of reporting stops behaving like a fixed overhead line and starts behaving like a variable input that distorts the entire retainer model. The math below holds three states of the same 60-account book against each other, using labeled variables rather than vendor pricing.
Assume a blended senior analyst fully-loaded cost of C per hour, a baseline of H reporting hours per account per month, and an average retainer of R. Reporting cost per account equals C × H. Reporting cost as a share of retainer equals (C × H) / R.
| State | Hours per account (H) | Reporting cost per account | Analyst capacity (accounts each) | Margin behavior |
|---|---|---|---|---|
| 1. Manual analyst-built reports | 7–8 | C × 7.5 | 12–15 | Baseline. Reporting absorbs the largest single non-billable cost inside the retainer. |
| 2. Automated reports with human review | 2–3 | C × 2.5 | 20–25 | Cost-to-serve drops ~65%. Margin moves if the freed hours leave the cost base; flat if they get reabsorbed. |
| 3. AI-coordinated reporting tied to execution | 1–1.5 | C × 1.25 | 30–40 | Cost-to-serve drops ~80%. Reclaimed hours convert to priced scope; retainer holds or rises while delivery cost falls. |
The spread between State 1 and State 3 is where the McKinsey envelope shows up. McKinsey's cross-industry analysis of automation use cases reports margin improvements ranging from 30 percent to 128 percent depending on workflow context, with realization contingent on operating-model redesign rather than tool deployment alone 2. Agencies that move from State 1 to State 2 without changing pricing or scope land near the floor of that range. Agencies that move to State 3 and reprice the retainer against the new deliverable density land toward the top.
One number worth tracking explicitly: accounts per analyst. It is the cleanest portfolio-level proxy for whether reporting automation has actually changed the unit economics. If the book grew from 60 to 90 accounts without adding analyst headcount, the model worked. If headcount grew proportionally with the account count, the automation paid for the tooling and nothing else.
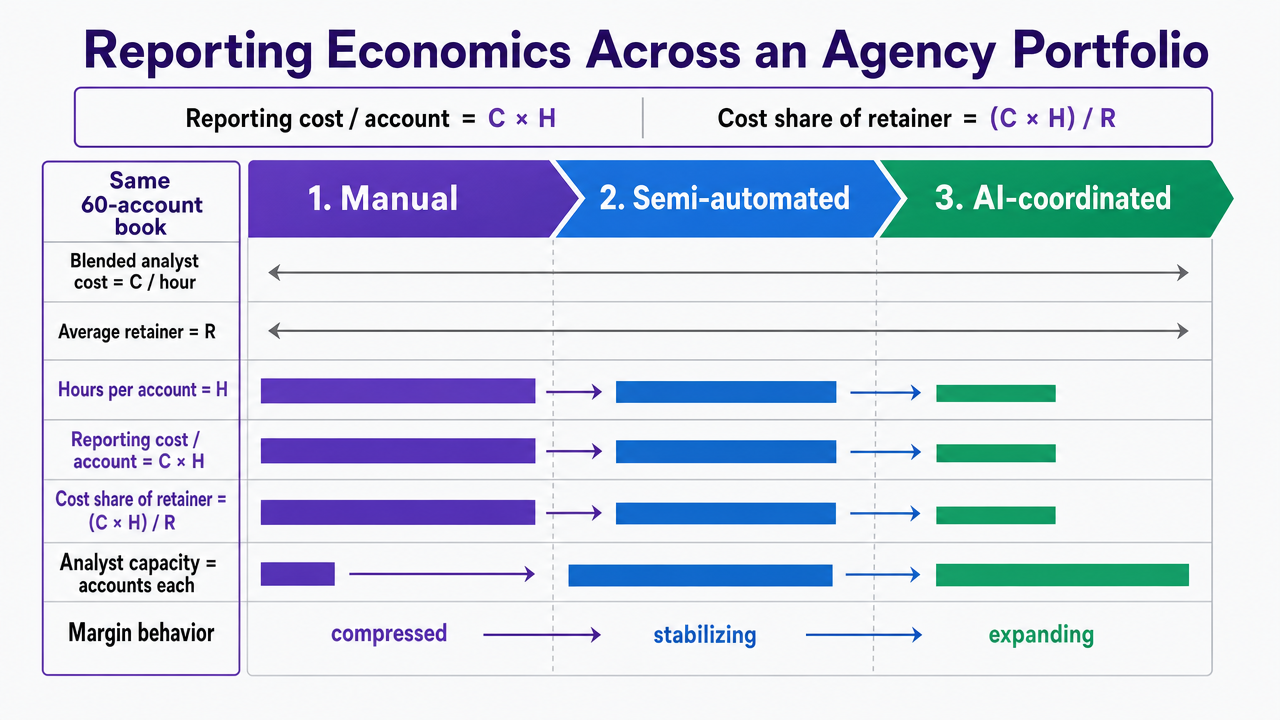 Visualize the three-state operating model comparison from the section's table, showing how reporting hours, cost-to-serve, and accounts-per-analyst shift across manual, semi-automated, and AI-coordinated states
Approval-Gated Automation as a Margin Lever
The instinct among owners watching the automation curve is to ask how far it can run without a human in the loop. The wrong question. Full autonomy in client reporting is where agencies surrender the one thing the retainer is actually paying for: judgment applied to numbers.
Approval gates are not a brake on automation. They are the mechanism that converts automation into defensible margin. Deloitte's State of AI survey found that only about one in five organizations has mature governance for autonomous AI agents, even as worker access to AI rose roughly 50 percent in 2025 7. That governance gap is where mistakes ship to clients—misattributed traffic drops, hallucinated competitive claims, recommendations that contradict the work the agency delivered last week. One incident inside a top-20 account is more expensive than a year of analyst hours.
The operating pattern that holds: machines assemble, humans approve, machines execute. The automated layer pulls the data, drafts the narrative, flags the anomalies, and proposes the next-month actions. A strategist signs off—or rewrites—before anything reaches the client. Once approved, downstream execution (content briefs, technical fixes, internal linking changes) runs without further routing. Harvard's analysis of AI in marketing emphasizes that automated outputs still require human interpretation for bias, context, and fairness 4. That review step is also the agency's billable surface.
The margin effect is two-sided. Approval gates compress the time strategists spend producing reports while preserving the time they spend defending them. Clients buy the defense, not the deck. Agencies that automate the production and keep the approval visible expand margin without thinning the relationship—the only configuration that survives renewal cycles.
See How Automated SEO Reporting Increases Agency Profitability
Request a walkthrough of automated reporting workflows that reduce production hours by up to 60% and enable real-time KPI tracking across all active SEO campaigns.
The New Measurement Layer: AI Search Visibility Reporting
Only 16 percent of brands systematically track how they perform inside AI-powered search surfaces, according to McKinsey's analysis of how LLM assistants and AI overviews are reshaping discovery 6. That gap is the cleanest near-term revenue line on the agency side of the table.
Traditional SEO reporting was built around the ten blue links: keyword rank, impressions, clicks, position changes. AI search has different mechanics. The questions clients now ask—"are we cited in the AI overview for our top-funnel queries," "which competitors get named when ChatGPT or Perplexity answers our category question," "how often does our brand appear in the source list versus the answer body"—do not resolve inside a standard rank tracker. Most agencies running automated SEO reports are still shipping a dashboard that does not measure where a growing share of discovery now happens.
The productization opportunity is direct. Agencies that build an AI search visibility layer—citation tracking across major LLM assistants, answer-share monitoring for priority queries, source-list presence audits, and content recommendations tied to how AI engines select citations—can attach it to existing retainers as net-new scope or sell it as a separate diagnostic. The marginal cost of producing it, once the data pipeline exists, sits close to the cost of an automated traditional report. The marginal price is whatever the client will pay for visibility into a channel 84 percent of brands are not measuring 6.
This is where reclaimed analyst hours convert into priced output most cleanly. The hours stripped out of manual reporting are exactly the hours needed to interpret a measurement layer no off-the-shelf tool fully covers yet.
What Stays Human in an Automated Reporting Model
The automation conversation tends to fixate on what machines can absorb. The more useful question for an owner sizing margin is what they cannot—and what the agency should never let them try.
Three categories stay human:
- Causal interpretation. A 22 percent traffic drop has a dozen plausible explanations: a core update, a tracking break, a seasonal pattern, a competitor's content push, a CMS migration the client did not flag. Pattern-matching the right one against the account's history is judgment work. Harvard's analysis of AI in marketing notes that automated outputs still require human review for bias, context, and interpretation 4. The strategist who can name the cause in a 15-minute call is the line item the retainer is actually paying for.
- The client-specific recommendation. Automated systems can rank opportunities by traffic potential or difficulty score. They cannot weigh those against the client's sales capacity, brand constraints, legal review cycle, or the CMO's quarterly narrative. That weighting is the difference between a recommendation that ships and one that sits in a backlog.
- The relationship layer. The renewal conversation, the scope expansion pitch, the moment a senior client contact leaves and the new one needs to be re-sold on the agency's value—none of that runs through a dashboard. Automation produces the artifacts. People defend the account.
Building the Operating Model: A 90-Day Reset
A 90-day window is enough to move a reporting stack from cost center to margin lever, provided the work is sequenced against the operating model rather than the tool stack.
- Days 1–30: Instrument the baseline. Measure what the agency actually spends on reporting today. Track analyst hours per account across data pulls, narrative writing, formatting, QA, and client walkthroughs. Calculate accounts-per-analyst by tier. Tag the share of senior staff time that touches a report versus a strategy artifact. Without this baseline, any future margin claim is unfalsifiable. McKinsey's analysis of automation outcomes shows margin improvements span 30 to 128 percent depending on workflow context, with realization tied to operating-model redesign rather than tool selection 2—the spread comes from how rigorously the starting state is measured.
- Days 31–60: Compress production, preserve approval. Move data assembly, anomaly flagging, and first-draft narratives into the automated layer. Hold the strategist's review step as a hard gate—no report leaves the agency without a signed-off interpretation. BCG's argument for AI-driven operating-model reinvention is that accelerating individual tasks underperforms redesigning the end-to-end workflow 3. The compression should change accounts-per-analyst, not just hours-per-report.
- Days 61–90: Reprice the retainer against new deliverable density. Attach AI search visibility reporting, competitive intelligence, or pipeline-tied content strategy to the existing scope. Renew the top decile of accounts first; the conversation is easier where the relationship is strongest. This is where Vectoron's approval-gated execution model fits agencies running this reset—machines assemble and execute, strategists approve, retainers expand.
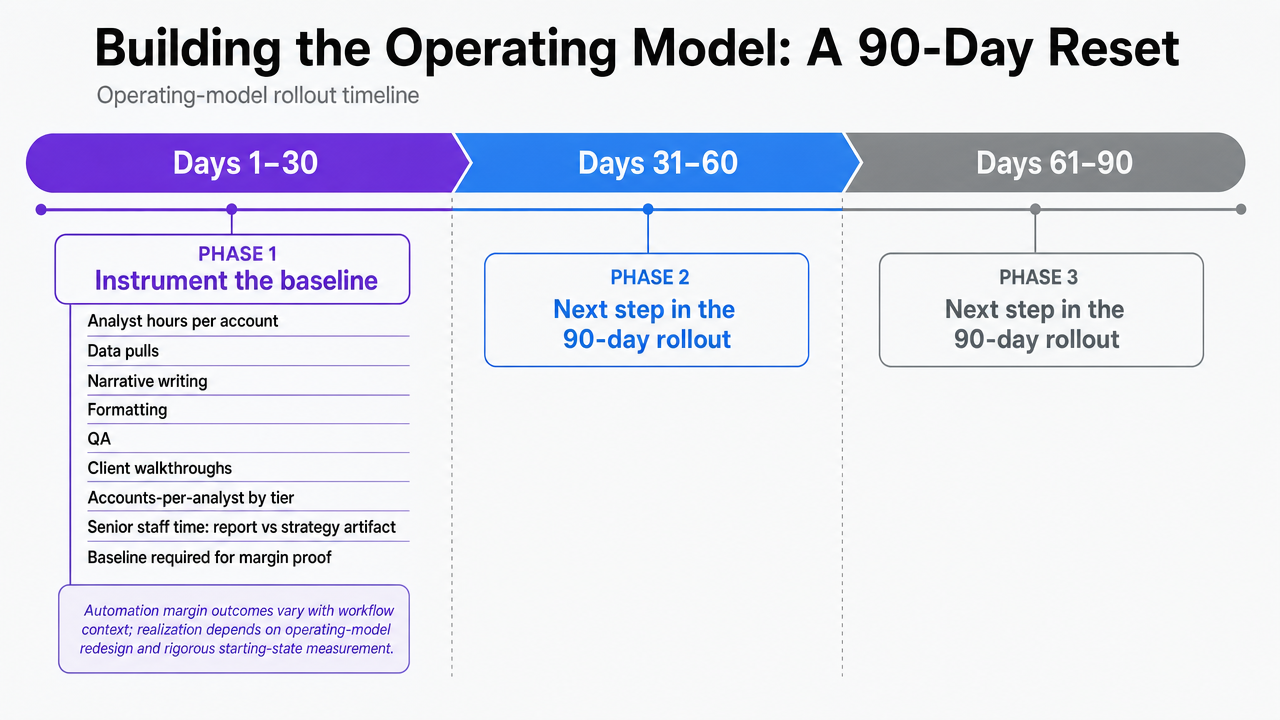 Visualize the three sequenced 30-day phases described in the section as a clear operating-model rollout timeline
Frequently Asked Questions
References
- 1.The state of AI in early 2024: Gen AI adoption spikes and the future of work reshapes.
- 2.Driving impact at scale from automation and AI.
- 3.From Campaigns to Business Value: How AI Will Transform Marketing.
- 4.AI Will Shape the Future of Marketing.
- 5.Marketing in the AI era: To matter more or cost less?.
- 6.Winning in the age of AI search.
- 7.The State of AI in the Enterprise - 2026 AI report | Deloitte US.
- 8.AI Jobs Barometer.
- 9.The Competitive Advantage of Using AI in Business.
- 10.Economic potential of generative AI: The next productivity frontier.
- 11.The State of AI: Global Survey 2025 - McKinsey.