Key Takeaways
- Roughly 40% of marketing automation deployments miss projected benefits, and the failures usually trace back to operating model decisions made before any vendor contract is signed 11.
- Reorder the RFP so readiness audit, operating model choice, and integration plan come before platform selection—teams that do this report 65% higher satisfaction and 45% better ROI 8.
- License fees represent only 30-40% of first-year spend, while integration, migration, and training consume another 35-45%, making integration the real project and configuration the footnote 2.
- Focus next on choosing between build, buy, or orchestrate based on governance maturity and channel mix, then calibrate scoring and attribution quarterly rather than treating them as one-time setup.
The 40% Failure Rate Nobody Puts in the Sales Deck
Roughly 40% of marketing automation deployments fail to deliver projected benefits within two years of go-live 11. This figure rarely surfaces in procurement discussions, yet it should be central to any conversation about adopting or replacing a marketing automation system.
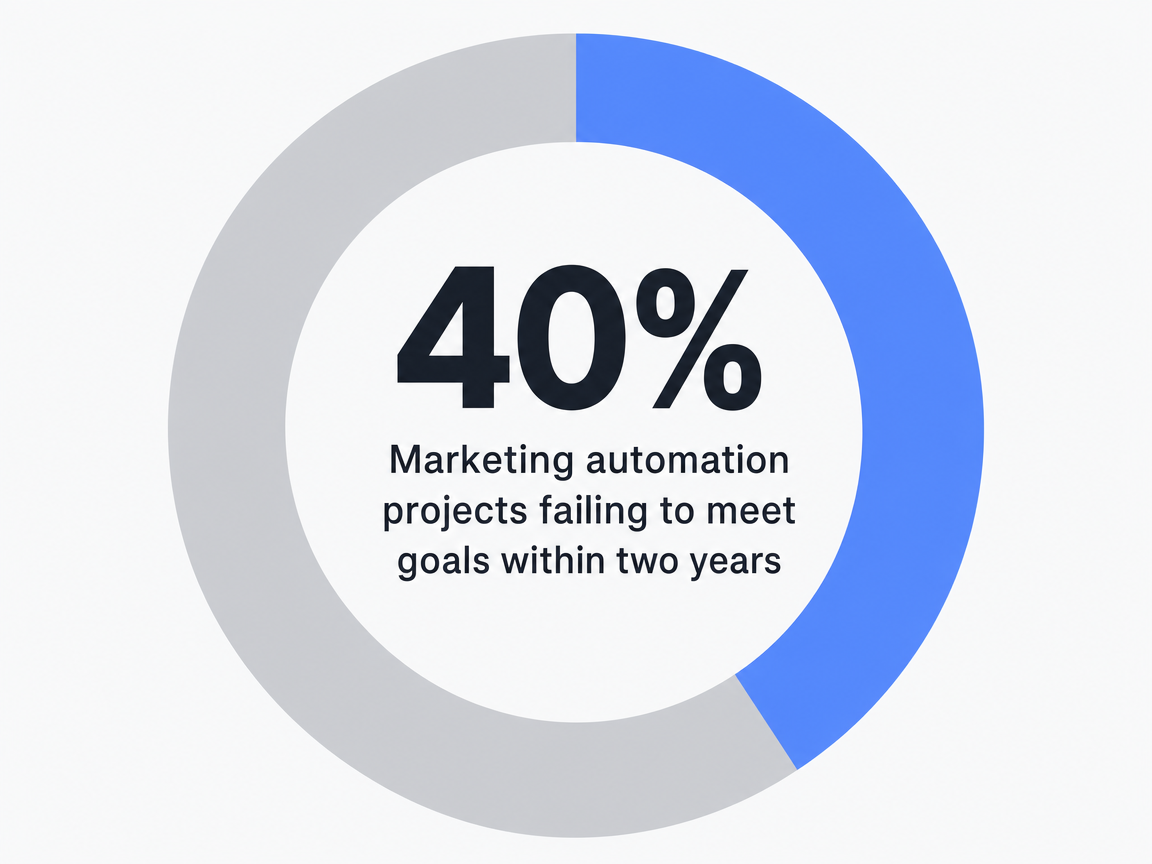 Marketing automation projects failing to meet goals within two years: 40%
The pattern of failure is not random. Aberdeen's tracking of over 500 B2B implementations reveals that only 23% of organizations achieve advanced maturity within 24 months, with the median team requiring 18 to 24 months to progress from basic automation to coordinated lead orchestration 5. The time between platform purchase and payoff is measured in fiscal years, not quarters.
Research consistently shows that failures stem from operating model decisions made before vendor contracts are signed. Data governance gaps, undefined cross-functional processes, and absent integration plans account for the majority of stalled deployments 11. The platform itself is seldom the cause of failure.
For a SaaS growth leader considering renewal, replacement, or first-time adoption, the framing of the decision is crucial. A marketing automation system is no longer just an email engine; it is a coordination layer for SEO, paid media, content, and backlink investments, all aimed at a single acquisition goal. Approaching the decision as a mere feature comparison often leads to the 40% failure rate.
What the Next Generation of Marketing Automation Looks Like
The marketing automation category is evolving beyond workflow-builder user experience as its primary differentiator. Features that were once defining—such as drag-and-drop email composers, branching nurture canvases, and form-handler libraries—are now standard, making it difficult for satisfaction reviews to distinguish between platforms 10. Customer outcomes are no longer tied to the friendliness of a builder but to the system's ability to align SEO, paid, content, and backlink efforts with a single acquisition target under one cohesive plan.
This shift is evident in adoption data. AI-agent usage in marketing automation is projected to increase from 15% of teams in 2024 to 45% by 2026, while mid-market B2B platform adoption is expected to rise from 61% to 78% in the same period. Growth is not in workflow builders but in execution layers that handle the cross-channel coordination previously managed by internal operations teams and account managers.
For a SaaS growth leader, this means the renewal or replacement decision is fundamentally different from three years ago. The key question is not which platform offers the cleanest canvas, but which execution model—best-of-breed, agency retainer, or AI-coordinated orchestration—best suits the team's governance maturity and funded channel mix.
Vectoron operates in this orchestration tier, managing SEO, content, PPC, and backlink activities against a single account-level plan with approval workflows that empower growth teams to control strategy without the burden of coordination overhead.
Why the Category Is Mis-Framed as a Platform Problem
From Email Engine to Customer Acquisition Operating System
The term "marketing automation" still evokes its origins: a 2010s email engine integrated with a CRM, designed for drip campaigns and form-fill nurture tracks. This definition no longer aligns with the budget a SaaS growth leader actually manages.
Marketing budgets now encompass SEO content production, paid search and social bidding, conversion infrastructure, and backlink acquisition. These channels share a common acquisition target but rarely a unified execution layer. When a platform is evaluated solely on its email and lead-nurture capabilities, the 60-80% of marketing spend outside this scope continues to operate on separate tools, dashboards, and with different agencies.
This fragmentation is the core operational challenge. Capterra's survey of over 1,000 marketing operations professionals found that platform "ease of use" ranked fifth among decision factors, significantly behind integration capability and existing system compatibility 9. Buyers instinctively understand that the critical question is not which workflow builder is most user-friendly, but which system can unify and hold SEO, paid, and content investments accountable to a single metric.
Reframing marketing automation as a customer acquisition operating system, rather than just an email tool, clarifies which capabilities are essential and which vendor claims are irrelevant.
What the Maturity Curve Actually Looks Like at 24 Months
Vendor implementation timelines often diverge from actual customer experience. Aberdeen's longitudinal study of B2B implementations highlights a significant gap between sales promises and cohort data, showing that the median organization requires 18 to 24 months to progress from basic automation to coordinated lead orchestration 5.
The maturity curve typically has three stages. Basic automation, including triggered emails, list segmentation, and form handling, is usually live within 90 days. Intermediate maturity, which adds lead scoring, multi-step nurture, and bidirectional CRM sync, generally stabilizes around months 9 to 12. Advanced maturity, where the platform truly coordinates SEO traffic, paid acquisition, and sales handoff against shared revenue targets, is where the curve often flattens.
This flattening is structural, resulting from accumulated integration debt, governance gaps, and team turnover over the first two fiscal years. Growth leaders who plan platform decisions based on a four-quarter business case are using an unrealistic horizon. The realistic horizon is two budget cycles, and the crucial question is what the operating model will look like in the second cycle, not what the demo showed in week one.
Readiness Before Platform: The Sequence That Predicts ROI
The Pre-Work Most Teams Skip
The most impactful factor in marketing automation outcomes is whether a team conducts a formal readiness assessment before vendor selection. Organizations that do so report 65% higher satisfaction and 45% better ROI than those that don't 8. However, only 31% of organizations actually perform this crucial step 8.
This oversight explains a significant portion of the 40% deployment failure rate. Gartner's benchmarking indicates that successful deployments require 6 to 12 months of pre-work on data architecture and process definition, and skipping this phase leads to 2.5 times higher failure rates 1. Essentially, two out of three teams begin platform evaluation without a documented baseline for the data, processes, and governance the platform is intended to automate.
This pre-work is often unglamorous, involving audits of customer record locations, authoritative fields, sync paths (batch vs. real-time), and documented vs. tribal cross-functional handoffs between marketing and sales. It also requires defining the single acquisition metric against which the system will be measured, before vendor demos can skew the conversation towards features.
Teams that rush this phase to meet fiscal deadlines often inherit every undefined process as a configuration debt, which surfaces around month nine, once the platform is live but integrations are not.
A Five-Step Decision Sequence That Reorders the RFP
The conventional approach prioritizes platform selection, treating data, integration, and governance as mere implementation details. Evidence suggests the inverse order is more effective.
Step one is the readiness audit: an inventory of customer data sources, field ownership, current sync architecture, and unresolved process gaps between marketing, sales, and revenue operations. Step two is the operating model decision—build, buy, or orchestrate—made before any vendor RFP, as this model dictates relevant vendor categories. Step three is the integration plan, scoped against the audit, with clear ownership for middleware versus point-to-point patterns 6. Step four is platform selection, narrowed to vendors whose architecture aligns with the integration plan, rather than those with the best workflow-builder demo. Step five is governance setup: defining who approves campaigns, owns scoring calibration, and arbitrates conflicts between paid and SEO efforts.
Reordering the RFP this way shifts platform selection from step one to step four. This sequence change accounts for the 65% satisfaction delta. It doesn't require more budget, but rather a commitment to completing the first three steps, with documented sign-offs from cross-functional owners, before scheduling vendor demos.
Test Unified Marketing Automation on Live Campaigns
Experience measurable campaign results in your actual market with full platform access for seven days.
The Real Cost: TCO Beyond the License Line
Vendor proposals typically quote a license fee, which represents only about a third of the actual first-year cost. Forrester's Total Cost of Ownership (TCO) analysis indicates that software licensing accounts for 30-40% of total first-year spend, with integration, data migration, and training making up another 35-45%. Ongoing optimization and support then comprise 20-30% of annual operating costs from year two onward 2. The license fee is the smallest variable in this equation.
This cost distribution often leads to budget surprises around month six. Procurement approves the license figure, but the integration scope expands once the data audit encounters real systems, causing the professional services line item to double. This pattern is predictable enough that it should be factored into the original business case, rather than discovered later.
The table below compares three execution models against key cost categories. Dollar figures are omitted due to variability based on team size and channel mix; the ratios and timeframes are derived from research.
| Cost Category | Best-of-Breed Stack + Internal Ops | Traditional Agency Retainer | Unified AI-Coordinated Execution |
|---|---|---|---|
| Year-1 license/fee share of total spend | 30–40% 2 | Bundled into retainer | Bundled into platform fee |
| Integration & migration overhead | High; multi-vendor sync | Low; agency owns tools | Moderate; single data layer |
| Ongoing FTE coordination load | Heavy across channels | Account-manager dependent | Approval-workflow only |
| Time-to-advanced-maturity | 18–24 months 5 | Variable; resets on turnover | Compressed via shared plan |
| Primary failure mode | Channel silos, attribution gaps | Coordination drag, missed handoffs | Governance under-investment |
This table reveals that no model eliminates cost; each merely shifts it. Best-of-breed models shift costs to internal coordination headcount. Agency retainers shift costs to account-management overhead and turnover risk. Unified execution shifts costs to governance and approval discipline. The decision is not about which model is cheapest on paper, but which cost category a growth team is best equipped to absorb.
Build, Buy, or Orchestrate: Three Operating Models for SaaS Growth
Comparing the Three Execution Models
The platform question often obscures a more fundamental choice: the operating model a team will adopt. Three distinct models are prevalent in the market, and they are not interchangeable.
Build involves assembling a best-of-breed stack: a marketing automation platform for email and lead management, a separate SEO suite, a paid media management tool, an outreach platform for backlinks, and middleware to connect them. The team bears the internal integration burden and manages cross-channel orchestration. This model suits teams with mature marketing operations staff and an established data architecture.
Buy entails contracting a traditional agency or multiple agencies to manage channels under a retainer. The agency controls the tools, execution cadence, and most coordination overhead. The growth team provides the brief and budget. This model exchanges internal complexity for vendor management, but its effectiveness can reset with agency account team turnover.
Orchestrate means running channels under a single, account-level plan with a unified execution layer—increasingly AI-coordinated—that holds SEO, paid, content, and backlinks accountable to the same acquisition metric. The team approves strategy and publishing decisions via a workflow interface, while the system handles the cross-channel coordination typically managed by internal operations or agency account managers.
This choice should precede any vendor RFP, as each model dictates a different shortlist. Best-of-breed evaluations lead to one set of vendors, while orchestration evaluations lead to another. Mixing these criteria often results in a platform whose architecture conflicts with the team's actual operating model needs.
Why Best-of-Breed Stacks Amplify Coordination Drag
The best-of-breed argument often assumes integration is a solved problem, but data suggests otherwise. 87% of marketing operations professionals cite data integration complexity as their top implementation challenge, surpassing all feature concerns 9. Each additional tool in the stack introduces another sync path, potential failure point, and undocumented field-mapping decision.
Coordination drag manifests downstream as attribution gaps. SEO traffic resides in one analytics layer, paid acquisition in another, lead scoring uses a third dataset, and sales handoff originates from a fourth. Teams then spend time reconciling channel-level dashboards instead of operating against a unified acquisition metric.
SiriusDecisions' research on automation failure reinforces this point from an organizational perspective: without predefined cross-functional processes, automation exacerbates existing misalignment between marketing and sales rather than resolving it 11. A best-of-breed stack distributes this misalignment across more vendors. The solution is not a better workflow builder, but fewer execution layers aligned to a single plan.
Integration Is the Project, Configuration Is the Footnote
Vendors emphasize configuration, while customers prioritize integration. This mismatch is the primary cause of timeline delays. Deloitte's data architecture research attributes 75% of marketing automation implementation delays to data integration challenges, not platform configuration 6. Configuration—building workflows, designing email templates, mapping form fields—is the visible part of go-live and what demos highlight. Integration, however, involves reconciling customer records across CRM, billing, product analytics, ad platforms, and data warehouses, and this is where timelines often break.
The realistic scope involves determining which sync paths are real-time versus batch, which system holds authoritative ownership of each customer field, and how identity is resolved across anonymous web sessions, known leads, and product accounts. These are architectural decisions, not vendor features. Teams that defer these decisions to implementation kickoff will face scope creep by month four.
Two integration patterns are common, each with trade-offs. Point-to-point connections are quicker to set up for individual syncs but increase maintenance costs as the stack grows. Middleware patterns require upfront investment but can accommodate new tools without re-wiring existing connections 6. The optimal choice depends on the number of systems needing to communicate and the frequency of stack changes—questions that should be addressed during the readiness audit.
The operational takeaway is to treat integration as the primary project and platform configuration as a subsequent task. Reversing this order is precisely what the 75% delay figure reflects.
See How Top SaaS Teams Automate Unified Marketing Operations
Connect with our experts to discover how a single AI-driven platform can streamline SEO, PPC, and content production—delivering measurable acquisition results at scale for agencies and enterprise marketing teams.
Lead Scoring, Attribution, and Other Features That Underperform Without Calibration
Lead scoring is frequently highlighted in vendor demos but often disappoints in practice. 60% of organizations deploying lead scoring report minimal impact on sales productivity, with failures stemming from model calibration rather than platform capability 3. Scoring weights set at go-live, based on assumed conversion behavior and never re-validated against actual pipeline outcomes over twelve months, produce metrics that sales teams quickly disregard.
A similar calibration gap affects attribution. Multi-touch models adopt the channel taxonomy configured on day one and are rarely re-tuned when the SEO mix shifts, paid creative rotates, or a new backlink program drives assisted conversions. The output appears precise, but the inputs are often outdated.
The practical solution is to treat scoring and attribution as quarterly recalibration tasks, not one-time configurations. Scoring weights should be tested against closed-won and closed-lost data from the previous two quarters, adjusting the model when behavioral signals fail to predict conversion. Attribution windows should be re-evaluated whenever the channel mix changes significantly.
Features alone do not deliver ROI; calibrated features do. A platform's scoring engine is only as accurate as the conversion data feeding into it, a loop that most teams fail to close.
Hub-and-Spoke Governance for Multi-Product and Multi-Location Operators
Centralized control often lacks local responsiveness, while fully decentralized execution struggles with consistency. The hub-and-spoke model outperforms both: a central governance layer establishes standards, data definitions, and brand guidelines, while distributed execution handles local campaigns, regional creative, and product-line nuances.
McKinsey's operations research shows that organizations using centralized governance with distributed execution achieve 40% faster implementation and 30% higher adoption rates compared to fully centralized or decentralized models 4. The hub manages decisions that would otherwise fragment locally (e.g., lead scoring weights, attribution windows, naming conventions, consent logic), while spokes maintain the agility of running campaigns close to the market.
For a SaaS team with multiple product lines, the hub defines shared qualified pipeline definitions, the unified scoring model, and cross-product attribution rules. Each product team operates as a spoke, adhering to the same plan. This structure also applies to multi-location operators, where service lines or regions act as spokes, and a central operations function defines the rules they execute.
Before implementation, it's crucial to map out which decisions reside at the hub, which at the spoke, and which require explicit cross-functional sign-off. Without this clarity, distributed execution can lead to the misalignment that SiriusDecisions warns automation tends to amplify 11.
Regulated Verticals: The Compliance Tax on Implementation Timelines
Healthcare operators face an implementation burden not typically included in standard vendor timelines. HIMSS data indicates that healthcare organizations require an additional 8 to 16 weeks of configuration for HIPAA, consent management, and patient privacy controls beyond the baseline implementation schedule. Notably, 73% of healthcare buyers underestimate this overhead during vendor selection 7.
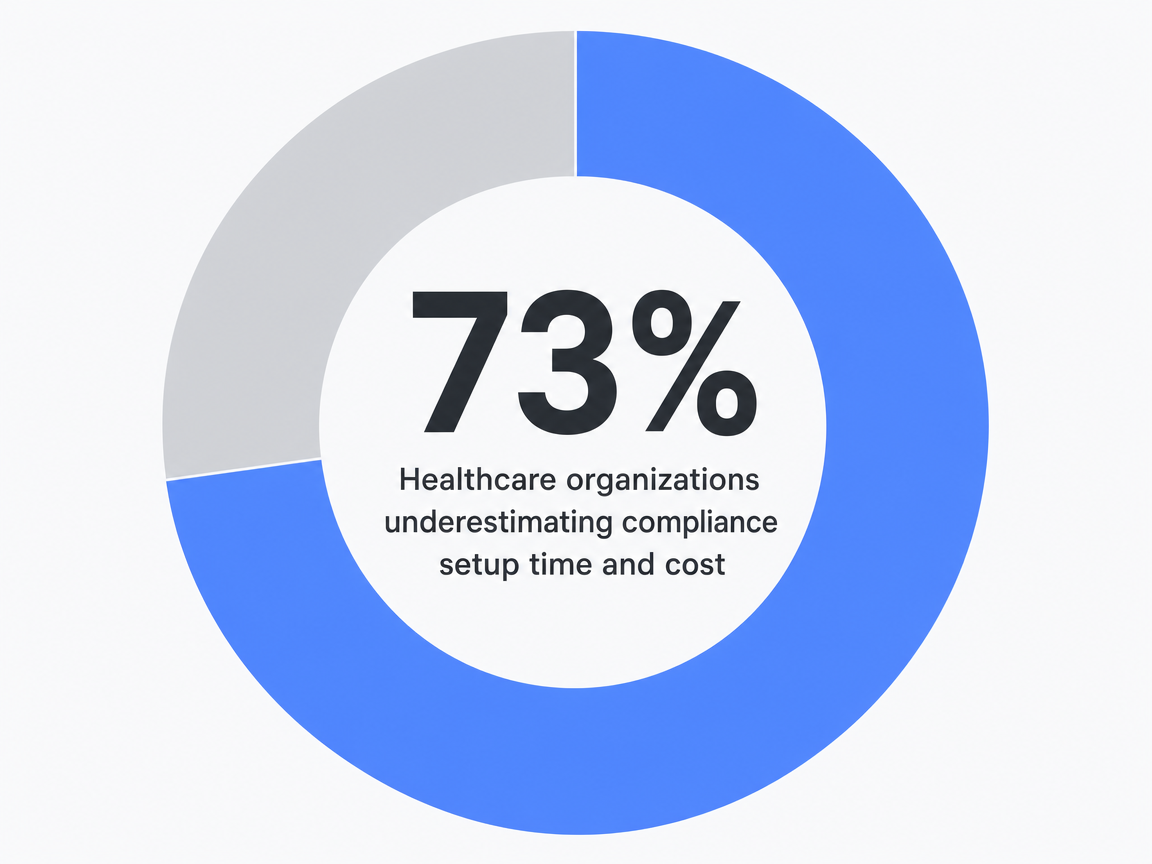 Healthcare organizations underestimating compliance setup time and cost: 73%
This principle extends to any vertical operating under jurisdictional privacy laws, such as financial services, education, and increasingly, any team with customers across state-level privacy regimes. Compliance configuration is not a simple feature toggle; it dictates how consent flows through nurture sequences, how identity resolves across PHI-adjacent and marketing data, and which automated decisions require human review under emerging transparency rules 7. Teams that address compliance after platform selection often face rework. Those that scope it during the readiness audit establish a more realistic timeline.
Frequently Asked Questions
References
- 1.Gartner Magic Quadrant for B2B Marketing Automation Platforms (2025).
- 2.Forrester: The Total Cost of Ownership for Marketing Automation (2024-2025).
- 3.Forrester Wave: Lead Management Platforms (2024).
- 4.McKinsey: Scaling Marketing Operations (2025).
- 5.Aberdeen Group: Marketing Automation Maturity Study (2025).
- 6.Deloitte: Marketing Technology Integration and Data Architecture (2025).
- 7.Healthcare Information and Management Systems Society (HIMSS): Healthcare Marketing Automation Compliance Study (2025).
- 8.American Marketing Association (AMA): Marketing Automation Adoption and Outcomes Study (2025).
- 9.Capterra Workflow Automation and Integration Report (2025).
- 10.G2 Crowd: User Reviews and Satisfaction Analysis (2025).
- 11.SiriusDecisions Research on Marketing Operations and Automation.