
Key Takeaways
- Reporting consistency, not headcount, breaks first as agencies grow, because inconsistent metric definitions across analysts create dashboard drift that compounds with every new client added to the roster.
- Treat reporting software selection as a measurement-governance decision, evaluating metric definitions, data-quality standards across cycles, standardized infrastructure, and auditable exports rather than chasing feature checklists 7, 8.
- Build the reference stack on Search Console for query, page, and country data 3, GA4 for conversions through its Data API schema 4, and Looker Studio as the unified client view 1.
- Cross the row-limit threshold by moving to Search Console bulk export to BigQuery 11, because UI-bound connectors quietly truncate long-tail queries once client count and page volume climb.
- Commercial tools justify their fee through non-Google data, white-label delivery at volume, and governance enforcement, but they fail at scale when they inherit row limits and hide GA4 field choices 4, 5.
- Compare manual UI assembly, templated Looker Studio dashboards, and warehouse-backed reporting by analyst hours per client per cycle, since the crossover point depends on roster size and loaded rate, not theory.
- Report on qualified organic conversions, branded versus non-branded splits 3, and impression coverage of indexed pages, because rankings alone describe a symptom rather than the engagement outcomes that drive renewals 10.
- Before signing, run a live sandbox on two client properties, inspect GA4 field mappings against the schema 4, test metric-definition storage, audit raw exports, and review connector change logs 14.
Why reporting breaks before headcount does
Most agencies hit a reporting wall somewhere between the 15th and 30th retained client. The team has not run out of analysts. It has run out of consistency. One account uses sessions as the headline metric, another uses clicks from Search Console, and a third quietly tracks a custom GA4 conversion that nobody can reproduce from the schema 4. By the time a quarterly review lands, three different definitions of "organic performance" are circulating inside the same agency.
The pattern is predictable. Manual assembly from Search Console and GA4 dashboards scales linearly with client count, while data-integrity errors scale faster than that. Search Console exposes performance by queries, pages, and countries 3, but the way one analyst slices that report rarely matches the way another does. Without enforced metric definitions and a standardized export path, every new client adds a fresh source of dashboard drift.
That is the framing this guide uses: SEO reporting software is a measurement-governance decision, not a feature checklist. The sections ahead evaluate tools against that standard.
Measurement governance as the real selection criterion
What governance means in a reporting context
Governance, in measurement terms, is the discipline of fixing what a number means before anyone draws a chart with it. NIST defines metrics as "measures and assessment results designed to track progress, facilitate decision-making, and improve performance with respect to a set target" 7. That definition does most of the work an agency needs. A metric is not a column in a dashboard. It is a measurement attached to a target, captured under stated conditions, and reproducible across reporting cycles.
Apply that frame to SEO reporting software and the evaluation criteria shift. The question is no longer "does this tool show clicks and conversions in one view." The question becomes whether the tool enforces a single, documented definition of each client KPI across every account, every cycle, and every analyst on the team. NIST's broader role is to provide the measurement infrastructure that keeps results comparable over time 8. An agency reporting stack has the same job at a smaller scale: make November's organic conversion count for Client A directly comparable to October's, without anyone having to ask which filter was applied.
The four governance controls to evaluate in any tool
Four controls separate reporting software that scales from software that only demos well. Each one maps to an established measurement-governance principle, and each one should be tested against the tool, not assumed.
- Metric definitions. Every recurring KPI needs a written definition stored inside the tool, not in a separate document. NIST treats metrics as measures tied to a target 7, which means the tool should let an agency declare, for example, "organic conversions = GA4 event X attributed to Default Channel Group = Organic Search, sessionDefaultChannelGroup dimension, 30-day window." If the platform cannot store and version that definition, dashboard drift is guaranteed.
- Data-quality standards across recurring cycles. Performance-monitoring guidance notes that organizations rarely need laboratory-grade rigor, but they do need consistent rigor across cycles 9. Translate that into vendor questions: how does the tool handle backfills, sampling, and source outages between months?
- Standardized measurement infrastructure. NIST frames standards as the basis for comparability across measurements 8. In practice, that means shared templates, shared field mappings, and shared connector configurations across the client roster.
- Auditable exports. NIST's information-quality standards emphasize reliability and auditability 6. Any tool that cannot export the underlying data behind a chart, in a format an analyst can re-run, is a black box on the client's behalf.
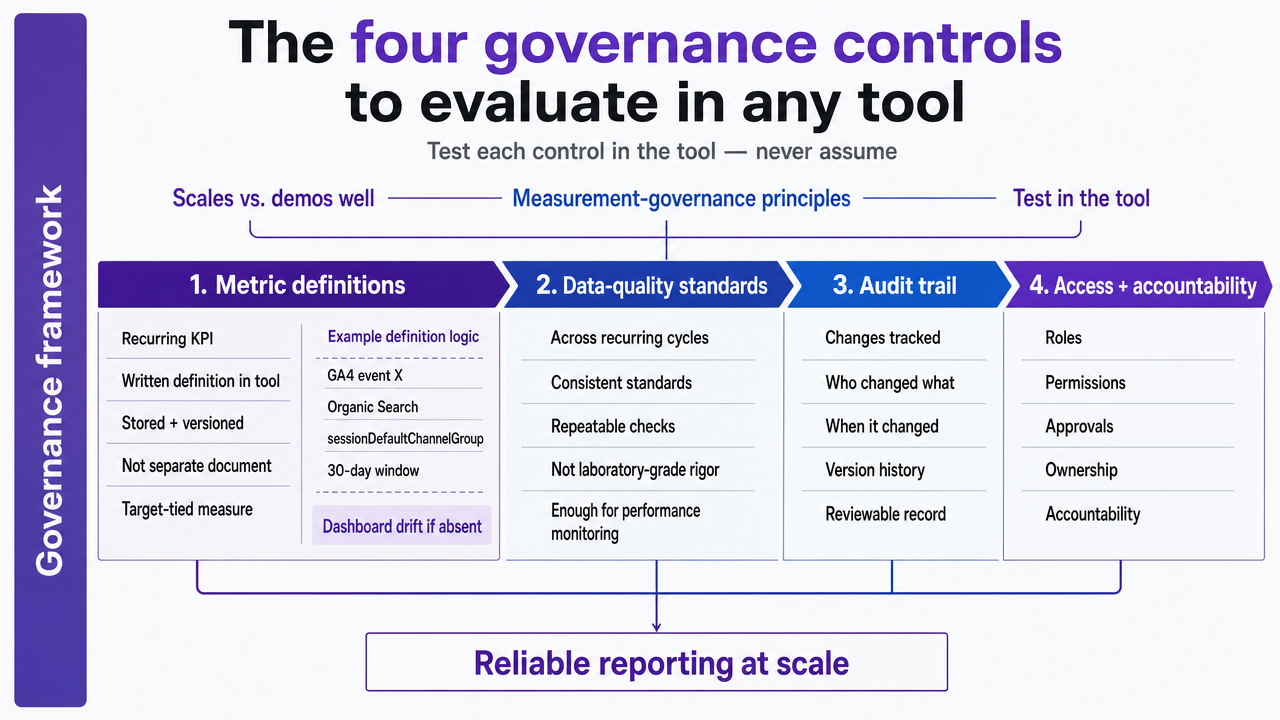 Visualize the four governance controls as a framework that readers can reference when evaluating tools
The reference architecture: Search Console, GA4, Looker Studio
Search Console as the first reporting layer
Every agency reporting stack should start with the same foundation across every client property: Search Console, configured identically, reporting the same dimensions in the same order. Google's own documentation describes the Search performance report as the canonical view of "how much traffic you're getting from Google Search, including breakdowns by queries, pages, and countries" 3. Those three breakdowns are not a starting suggestion. They are the minimum standardized layer that every client report should expose before anything else is added.
Standardization here is the operational point. When the same query, page, and country views appear in every client account, an analyst moving between properties does not have to relearn the report. Onboarding a new client becomes a templated step rather than a custom build. Google's foundational guidance reinforces this by treating Search Console monitoring as an ongoing discipline, not a one-time check 2.
What Search Console does not do is connect organic performance to revenue or to the events a client cares about. That is where the second layer comes in.
GA4 as the conversion and behavior layer
GA4 carries the part of the report that Search Console cannot: what happens after the click. Conversions, engagement events, channel attribution, and audience behavior all live here, and they are the metrics most clients actually use to judge an SEO engagement. The catch is that GA4 reporting depends on valid combinations of dimensions and metrics, defined in the Data API schema 4. Pair the wrong dimension with the wrong metric and the query silently returns nothing, or worse, returns plausible-looking numbers that do not mean what an analyst assumed.
That schema constraint is the single most common source of broken client dashboards. A custom report built by one analyst against, for instance, sessionDefaultChannelGroup may quietly diverge from another analyst's report using firstUserDefaultChannelGroup, even though both look like "organic sessions" in the chart title.
For agencies running GA4 across dozens of properties, Google's developer documentation frames the implementation as something to manage programmatically, with tooling built to handle integrations "at scale" 13. That framing matters: configuring GA4 by hand per client is fine at five accounts and a liability at fifty.
Looker Studio as the unified client view
Looker Studio is where the first two layers become a single client deliverable. Google's own SEO documentation walks through visualizing Search Console and GA4 data together in Looker Studio, including how to troubleshoot the data mismatches that come up when both sources are charted in the same view 1. The native Search Console connector handles the SEO side directly, with Google describing it as the path to "measure and analyze your site's performance on Google Search" inside the same dashboard layer 5.
The practical advantage for an agency is templating. One dashboard definition, parameterized by client property, becomes the recurring monthly report for the entire roster. Field mappings, calculated metrics, and date controls are written once and inherited everywhere. That is the closest a free tool gets to enforcing metric standardization across accounts.
The ceiling shows up at volume. The native Search Console connector pulls from the same UI-bound dataset, which carries row limits that become a problem as client count and page count grow. That ceiling is the subject of the next section.
Test Data-Driven SEO Reporting At Scale Now
Experience streamlined, fully operational SEO reporting workflows on live campaigns before making a commitment.
The dividing line: row-limited exports vs. warehouse-grade data
Somewhere around the fortieth client property, the native Search Console connector stops being a reporting tool and becomes a rate limiter. The UI-bound dataset that powers Looker Studio's native connector 5carries the same row caps as the Search Console interface itself, which means high-traffic sites lose long-tail queries to truncation and lower-traffic clients lose comparative context. Google acknowledged the gap years before solving it, expanding export options to include "multiple report tabs and more complete downloadable data than a single-screen view" 12. The expansion helped individual analysts. It did not solve the agency-roster problem.
The 2023 release of Search Console bulk data export to BigQuery is the actual dividing line. Google describes it as "a daily data dump into your BigQuery project" 11, which means an agency operating above the row-limit threshold can finally query Search Console data the way it queries any other warehouse table: full granularity, full history, full query-page-country breakdowns 3across every client property in one place.
The trade-off is configuration. Bulk export requires a Google Cloud project, billing, and permissions setup per property. Agencies running fewer than roughly fifteen clients rarely hit the row ceiling and can stay on native connectors without losing fidelity. Above that threshold, the math reverses. The infographic below maps each required data source—Search Console queries, pages, and countries 3; GA4 conversion events from the Data API schema 4; ranking and backlink data—against its official export path, native connector availability, or dependence on community connectors 14, which carry their own maintenance risk. Agencies that cross the bulk-export line stop assembling reports and start querying a warehouse. Agencies that do not cross it eventually stop scaling.
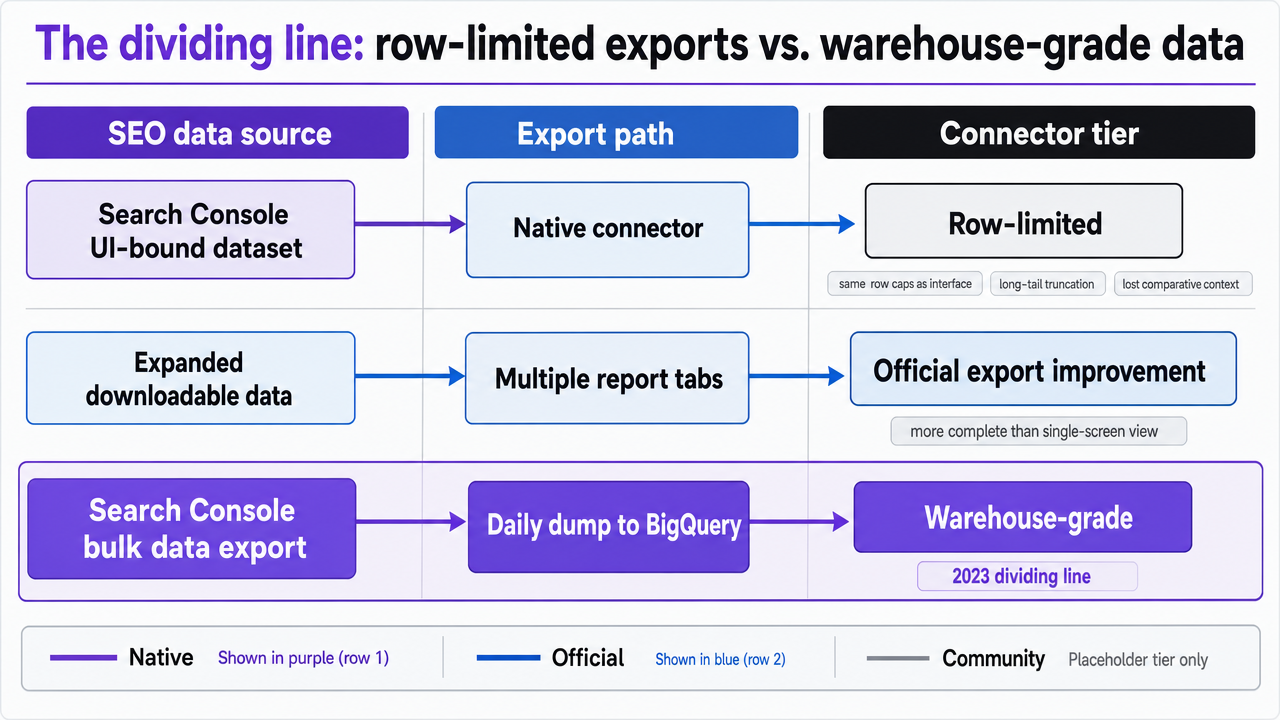 Map each required SEO data source against its export path and connector tier, supporting the section's comparison of native, official, and community connector strategies
Evaluating commercial reporting software against the baseline
Where commercial tools add real value
Commercial SEO reporting platforms earn their seat in the stack when they do work the Google reference architecture genuinely does not do. Three categories qualify.
The first is non-Google data. Rank tracking at SERP-feature granularity, backlink indexes, competitive share-of-voice, and on-page audit data are not exposed by Search Console or GA4. An agency that needs daily keyword positions across thousands of tracked terms is buying a data source, not a dashboard.
The second is client-facing presentation at volume. White-label reporting, automated PDF generation, scheduled delivery, and per-client branding controls are operational features. They remove hours from the recurring cycle and standardize what arrives in a client inbox on the first of every month.
The third is governance tooling the free stack lacks. A handful of commercial platforms let an agency store metric definitions, lock dashboard templates against editing, and audit which analyst changed which calculation. That maps directly to the metric-definition discipline NIST anchors as the basis of comparable measurement 7. When a commercial tool enforces those definitions across every client account at once, it is doing governance work, not visualization work, and that is where the license fee starts to defend itself.
Where commercial tools quietly fail at scale
The failure modes are predictable and rarely show up in a sales demo. Most commercial reporting software pulls Search Console data through the same UI-bound API the native Looker Studio connector uses 5, which means it inherits the same row limits Google partially addressed through expanded export options 12and fully addressed only through bulk export to BigQuery 11. A vendor dashboard that looks complete at ten clients can silently truncate long-tail queries at fifty.
GA4 integrations fail in a quieter way. Commercial tools expose simplified field pickers that hide the underlying Data API schema 4, which makes it easy for one analyst to build a "sessions" widget using one channel-group dimension while another analyst builds the same widget using a different one. The chart titles match. The numbers do not. Without a way to inspect the exact dimension-metric combination behind each visualization, an agency cannot reconcile the discrepancy at month-end.
The third failure is template drift. Tools that allow per-client dashboard customization without version control end up with fifty subtly different reports after a year. The platform did not enforce the standardized measurement infrastructure that keeps results comparable across cycles 8, and the consistency problem the agency was paying to solve quietly returned.
Connector strategy: native, official, and community trade-offs
Connectors determine whether a reporting stack stays reliable through the next twelve client onboardings or starts breaking in ways nobody can diagnose. Three tiers are worth distinguishing.
Native Google connectors, like the Search Console connector documented for Looker Studio 5and the GA4 integration governed by the Data API schema 4, carry the lowest maintenance burden. Google owns the contract on both sides. When the schema changes, the connector changes with it. The trade-off is the row-limit ceiling already covered.
Official vendor connectors, built and maintained by the reporting platform itself against documented APIs, sit in the middle. Reliability depends on how quickly the vendor updates when an upstream API shifts. An agency should ask for the vendor's change log on GA4 and Search Console integrations before signing.
Community connectors are the highest-risk tier. Google's own documentation describes them as enabling "direct connections from Looker Studio to internet-accessible data sources" 14, which is useful when no official path exists. The cost is maintenance ownership: when a community connector breaks mid-month, the agency owns the client conversation. Use them for non-critical enrichment data, not for the headline KPIs on a client's quarterly review.
If you manage a portfolio: the economics of reporting models
A note on audience scope: this section is written for owner-operators running a portfolio of client accounts, not for analysts producing a single report. The math only matters once the roster crosses the point where reporting hours start cannibalizing strategy hours.
The economics of SEO reporting software are best understood as analyst hours per client per reporting cycle, multiplied by client count, multiplied by loaded hourly rate. Three models sit on that curve, and the differences are operational, not theoretical.
Model A is manual UI assembly. An analyst opens Search Console, exports the query, page, and country views per property, opens GA4, pulls conversion and channel data through the interface, and pastes the results into a templated deck. Call the per-client hours H_a. Across a roster of N clients at loaded rate R, the monthly cost is H_a × N × R. H_a does not fall as N grows; it scales linearly.
Model B is templated Looker Studio dashboards using the native Search Console connector 5and the GA4 integration governed by the Data API schema 4. The template is built once and parameterized per property. Per-client hours H_b are dominated by onboarding, exception handling, and the monthly QA pass. H_b is meaningfully lower than H_a, and the gap widens as N grows, because the template absorbs the work that manual assembly repeats.
Model C is warehouse-backed reporting. Search Console bulk export delivers "a daily data dump into your BigQuery project" 11, the GA4 Data API is configured programmatically as Google's developer documentation frames implementation "at scale" 13, and the dashboard layer queries the warehouse instead of the UI. Per-client hours H_c are the lowest of the three at steady state, but the fixed setup cost F_c is real: cloud project configuration, billing, permissions, and the engineering time to maintain the pipeline.
The crossover point is where H_a × N × R exceeds F_c + H_c × N × R. Plug in actual numbers from the last quarter rather than guessing. Agencies that run the calculation honestly tend to find Model B pays for itself early, while Model C pays for itself somewhere past the row-limit threshold discussed earlier, when truncation starts costing analyst hours in reconciliation rather than saving them.
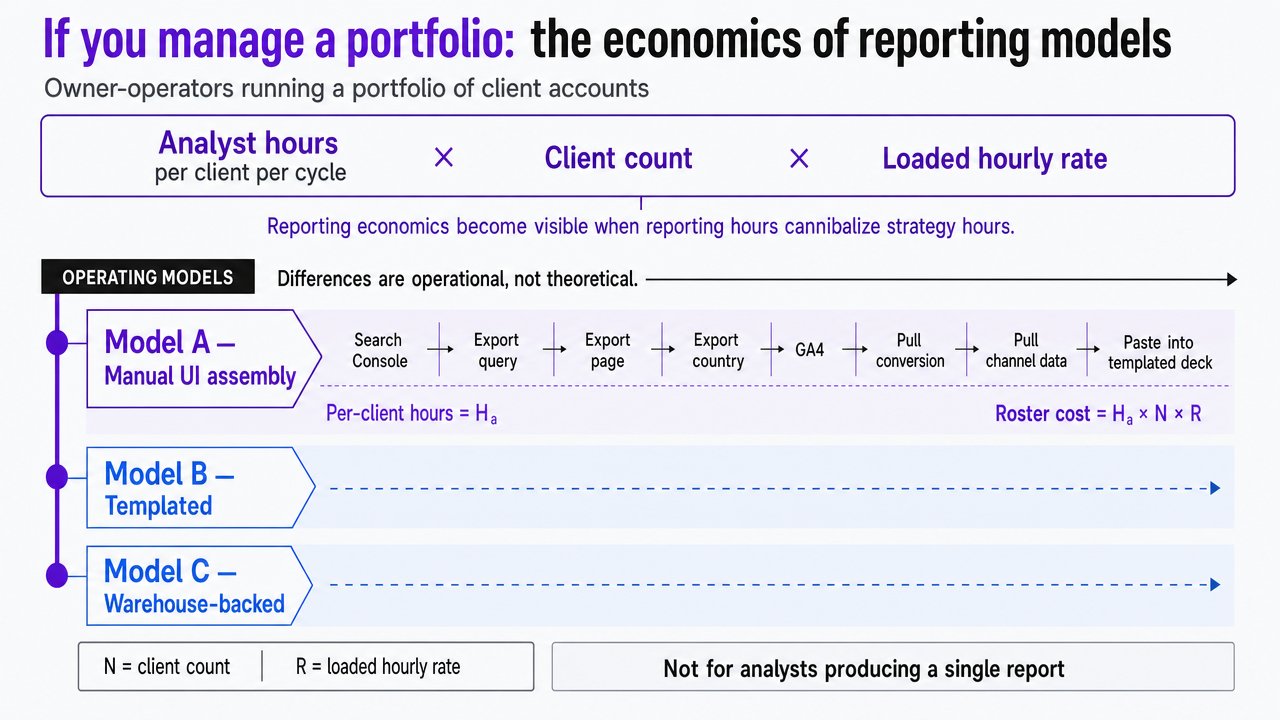 Visualize the three operating models (manual, templated, warehouse-backed) and their cost structures as described in the section
See How Scalable SEO Reporting Delivers Agency Efficiency Gains
Request a walkthrough of unified reporting workflows and approval-first automation for agencies managing multi-client SEO at scale. Learn how leading teams reduce reporting hours by 40% while improving data accuracy and client transparency.
Tracking outcomes the client actually cares about
Clicks and rankings are inputs. They are not what shows up in a renewal conversation. Google's own explanation of how Search ranks results points to meaning, relevance, and quality as the drivers behind any position change 10, which means a client report built around position alone is reporting on a symptom rather than the work. The KPIs that earn renewals sit one layer deeper: qualified organic conversions tied to a documented GA4 event, assisted revenue from organic sessions, branded versus non-branded query splits pulled from the Search Console performance report 3, and the share of indexed pages that actually receive impressions over the cycle.
Google's foundational guidance frames Search Console monitoring as an ongoing discipline focused on user-relevant performance 2, not a snapshot. Reporting software earns its place when it can express that discipline as a recurring view: which pages gained or lost qualified traffic this month, which queries converted at above the roster average, and which technical issues correlated with impression loss. If the tool cannot answer those questions without an analyst rebuilding the query each cycle, it is reporting on the wrong layer.
A practical evaluation sequence before you sign a contract
Vendor demos answer questions the sales team wants to answer. A useful evaluation answers the questions an agency will care about in month six. Run the sequence below against any reporting platform under consideration, in this order.
- Request a sandbox connected to two live client properties. Static demo data hides the issues that matter. Connect Search Console and GA4 for an existing high-traffic account and a low-traffic account, then check whether long-tail queries match the bulk export reference 11or quietly truncate against the UI-bound dataset 5.
- Inspect the GA4 field layer. Open a sessions widget and confirm which dimension and metric combination it uses against the Data API schema 4. If the tool will not expose the underlying fields, two analysts will eventually build divergent versions of the same chart.
- Test metric-definition storage. Declare "organic conversions" once and confirm the definition propagates across every client template and survives an edit by a second user. NIST's framing of metrics as measures tied to a stated target 7is the standard to test against.
- Audit the export path. Pull the raw data behind one chart. If the export does not reconcile, the dashboard is unauditable.
- Review the connector change log. Ask for the last twelve months of updates to Search Console and GA4 integrations, plus the maintenance posture on any community connectors in use 14.
An agency that runs all five steps before signing rarely renews a tool it regrets.
Frequently Asked Questions
References
- 1.Using Search Console and Google Analytics Data for SEO.
- 2.Search Engine Optimization (SEO) Starter Guide.
- 3.How To Use Search Console | Documentation.
- 4.API Dimensions & Metrics | Google Analytics.
- 5.Connect to Search Console | Data Studio.
- 6.NIST Guidelines, Information Quality Standards and Administrative ....
- 7.metrics - Glossary - NIST CSRC.
- 8.Measurements and Standards | NIST.
- 9.Performance Monitoring & Evaluation TIPS #12: Data Quality Standards.
- 10.How Does Google Determine Ranking Results.
- 11.Bulk data export: a new and powerful way to access your Search ....
- 12.More and better data export in Search Console.
- 13.Google Analytics for developers.
- 14.Data Studio Community Connectors - Google for Developers.