
Key Takeaways
- Average position no longer predicts traffic because AI Overviews cut top-result CTR from 7.3% to 2.6% on triggering keywords, requiring a new measurement framework 8.
- A three-layer scorecard—Presence (citation frequency), Prominence (position and framing within answers), and Pull-Through (downstream conversion)—replaces rank as the defensible KPI architecture for AI visibility.
- Segmenting KPIs by query intent is essential, since AI Overviews appear on 98% of informational queries but behave differently on navigational, commercial investigation, and transactional terms 10.
- Heads of SEO should assign clear KPI ownership using a NIST-style Govern-Map-Measure-Manage model, per-engine tracking schemas, and baseline analyst hours to protect retainer margins across portfolios 12.
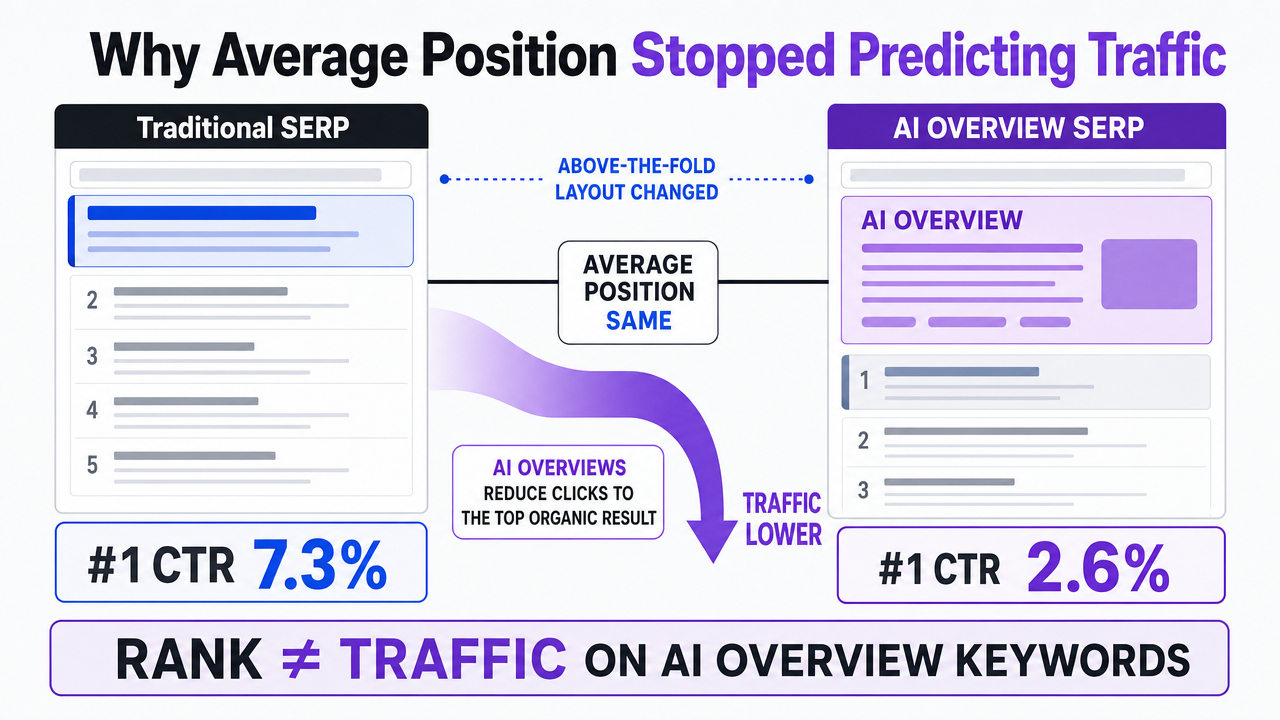
Why Average Position Stopped Predicting Traffic
Rank tracking was designed for a search results page dominated by ten blue links. This traditional layout is now less common, especially above the fold, for a growing number of queries. Google has confirmed that AI Overviews reached over a billion users in the U.S. shortly after launch and has since expanded this feature into AI Mode, leveraging Gemini 2.0 for enhanced reasoning and multimodal capabilities 6, 7. The dynamic nature of these AI-powered search results means the traditional KPI of "average position" on client dashboards no longer accurately reflects performance.
A key data point illustrating the inadequacy of average position comes from Digital Content Next. For keywords that trigger AI Overviews, the click-through rate (CTR) for the number one organic result saw a significant decline, dropping from 7.3% to 2.6% 8. This represents a 34.5% decrease. While this figure specifically targets top-ranked results on AI-Overview-triggering keywords, it highlights a fundamental shift. Position one, once the most valuable spot on the page, now yields roughly one-third of its previous clicks when an AI Overview appears above it.
For agencies managing multiple client accounts, this shift impacts the overall portfolio. A retainer based on organic traffic promises becomes unsustainable when a significant portion of a client's keywords trigger AI Overviews, and the top position's CTR plummets. While rank charts might show improvement, session charts often trend downwards. This divergence necessitates a new measurement framework to reconcile these conflicting performance indicators.
Replacing average position requires a comprehensive scorecard that assesses whether a client's content is present within AI answers, prominent when it appears, and effectively driving qualified traffic to conversion.
 Visualize the dramatic CTR drop for the #1 result on AI Overview keywords, directly supporting the section's core claim
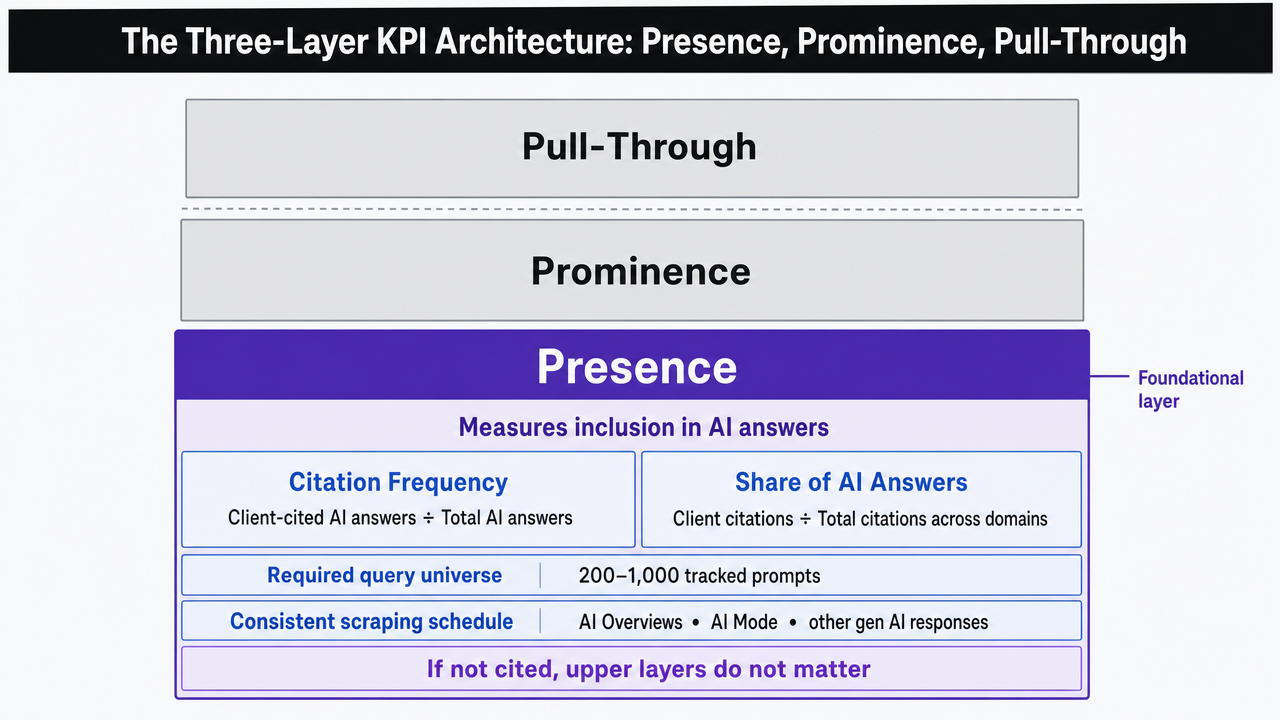
The Three-Layer KPI Architecture: Presence, Prominence, Pull-Through
Presence: Citation Frequency and Share of AI Answers
Presence determines if a client's domain is cited within AI answers and its frequency relative to competitors for a given set of queries. This foundational layer is crucial because prominence and pull-through are irrelevant if the domain is never included in the AI response.
Citation frequency is calculated by dividing the number of AI answers that link to or attribute content to the client's domain by the total number of AI answers observed for a fixed query set. Share of AI answers is the client's citation count divided by the total citations across all domains for that same query set. Both metrics require a defined query universe, typically 200 to 1,000 tracked prompts per client, and a consistent scraping schedule for AI Overviews, AI Mode responses, and other generative engines.
The measurability of Presence is directly linked to content strategy. Controlled experiments by the GEO paper demonstrated that incorporating inline citations, direct quotations, and statistics into source content led to a 115.1% visibility increase for a page ranked fifth in classic SERP results when featured in a generative answer engine 1. While this doesn't guarantee similar results for every page, it confirms that citation-worthy formatting—such as verifiable data, named sources, and expert quotes—is a key input for improving Presence.
Agencies should track Presence as a weekly rolling rate against a defined benchmark. Google's own guidance supports this approach, emphasizing optimization to help generative features understand and surface content effectively 4. The KPI shifts from simply publishing articles to demonstrating a measurable increase in citation frequency on tracked query sets, for example, from 12% to 19% quarter over quarter.
Prominence: Position and Framing Inside the Answer
Being cited in an AI answer is distinct from being prominently featured. Prominence measures where a client's content appears within the AI response and how it is presented.
This layer involves three sub-metrics:
- Citation position: whether the client's link is in the primary answer body, a supporting list, or a less visible "sources" tray. Google describes AI Overviews as providing a snapshot of key information with links for further exploration 5, indicating a hierarchical display of links.
- Quotation depth: whether the content is paraphrased briefly, directly quoted, or expanded into a multi-sentence passage treated as authoritative.
- Framing sentiment: whether the citation supports the main claim, offers a counterpoint, or is merely a "see also" reference. Since AI Overviews aim to quickly convey the gist of a topic 3, an early, affirmative citation carries significantly more weight than a late, qualifying one.
Prominence is more complex to automate than Presence, as it requires parsing the answer's structure beyond just detecting a link. Agencies typically use a 1 to 5 rubric applied to a sampled subset of queries—perhaps 20% of Presence-tracked queries—reviewed weekly. This rubric provides an objective framework for what would otherwise be a subjective assessment.
Measuring Prominence separately is crucial because two clients with identical Presence rates can have vastly different performance outcomes. One might be quoted at the top of answers, while the other is relegated to the source tray. A single "citation count" metric would obscure this critical distinction and hide the true drivers of performance.
Pull-Through: Downstream Conversion from AI-Exposed Queries
Pull-through connects the scorecard to tangible business results. While Presence and Prominence describe visibility, Pull-Through measures the subsequent user actions: clicks, branded searches, or on-site conversions after exposure to client content within an AI answer.
The core formula compares the conversion rate of sessions attributable to AI-exposed queries with the conversion rate of comparable non-AI queries. Tracking this ratio over time reveals whether AI visibility generates qualified demand or merely consumes brand equity. Data sources include Google Search Console's (GSC) search appearance filters for AI-linked impressions and clicks, GA4 session data segmented by landing page and query family, and branded search lift measured against a rolling baseline.
Direct attribution can be challenging. The Digital Content Next analysis showed that the top organic result on AI-Overview-triggering keywords now has a 2.6% CTR, down from 7.3% 8, suggesting direct click volume from AI-exposed queries may be low. Google's AI Overview documentation confirms the feature is designed as a starting point with links for further exploration 13, not as a direct traffic pipeline mirroring classic SERPs.
Agencies address this by measuring pull-through as a composite metric. This includes direct clicks from AI-linked impressions, plus the lift in branded queries on the same topic clusters within a 30-day window, and assisted conversions on landing pages that received AI citations. Individually, these metrics may be imperfect, but combined, they provide a robust signal that Presence and Prominence are contributing to business outcomes, which is the key information a client's CMO needs.
 Visualize the three-layer KPI framework introduced in this section as a stacked/tiered process diagram
Segmenting KPIs by Query Intent
A single, portfolio-wide "AI visibility rate" can be misleading. The Medill Spiegel Research Center's 160-query test found AI Overviews appeared on 43% of queries overall, but on 98% of informational queries 10. This wide disparity means an unsegmented average will misrepresent risk across a client's keyword list. Search Engine Journal's analysis of approximately 500,000 prompts further revealed AI Overviews on 87% of prompts overall and 88.5% on decision-stage prompts 9. This indicates that AI answers are most likely to intercept clicks at critical funnel stages where clients prioritize conversions.
Segmentation is not optional; it differentiates a scorecard that accurately predicts client outcomes from one that requires defensive explanations during quarterly business reviews (QBRs).
A practical intent taxonomy for agency reporting includes four categories:
- Informational queries (e.g., "how does X work," "what causes Y") have the highest AI Overview trigger rates and lowest expected click volume, making Presence and Prominence the dominant scorecard metrics.
- Navigational queries, where users already know the brand, typically yield classic results and should retain conventional rank and CTR tracking.
- Commercial investigation queries (e.g., comparisons, reviews, "best X for Y") are in the middle, requiring both citation share and downstream conversion tracking.
- Transactional queries at the bottom of the funnel behave inconsistently across verticals and necessitate per-client baselines rather than portfolio benchmarks.
Each category should have specific targets:
- For informational queries: Presence at 20% or higher on the tracked query set within two quarters.
- For commercial investigation: a Prominence rubric score of 3.5 or higher on cited answers.
- For transactional queries: a pull-through conversion rate within 15% of the pre-AI baseline.
Reporting these distinct lines across intent segments provides clear performance insights that an aggregate visibility score cannot.
Query-set assembly requires initial tagging per client, with quarterly updates as new terms are added. Google's guidance identifies informational and exploratory queries as prime candidates for AI Overviews 3, aligning the tagging schema with the platform's own segmentation. Agencies that omit intent segmentation risk reporting a portfolio average that combines highly triggered informational queries with less affected mixed sets, resulting in an inaccurate and indefensible performance metric.
Measure True Visibility Impact With Live Data
Get actionable AI-driven visibility metrics and publish real content to see measurable results in your workflow.
Formulas and Data Sources for Each Metric
What GSC, GA4, and Answer Scraping Actually Cover
Each metric in the scorecard relies on specific data sources, each with its own limitations. Understanding these coverage maps is essential for creating defensible KPIs.
Google Search Console (GSC) provides data on impressions and clicks from Google surfaces, including AI-linked impressions via search appearance filters. It shows what Google displayed and what users clicked. However, GSC does not indicate whether a citation appeared within an AI Overview, its position, or the quoted text. GSC primarily contributes to the click and branded-impression components of Pull-Through.
GA4 tracks on-site user behavior after a session begins. This includes conversion rates on AI-exposed landing pages, assisted conversions on cited URLs within a 30-day window, and branded search lift against a rolling baseline. GA4 cannot directly "see" the AI answer itself; it records referrer information (or lack thereof) and subsequent session activity.
Answer scraping bridges the data gaps left by GSC and GA4. It involves sampling AI Overviews, AI Mode responses, and third-party engines for a fixed query set. It records whether the client's domain was cited, the citation's position, and the quoted text. This is the only direct source for populating Presence and Prominence metrics. Google's documentation describes AI Overviews as designed to surface links for further exploration 13, meaning the citation slot is observable but not exposed through first-party analytics APIs. Scraping serves as a necessary workaround and requires a consistent cadence for reliability.
Per-Engine Tracking When No Cross-Engine Metric Exists
The "Measuring Brand Visibility Across AI Search Engines" preprint highlights a critical challenge for agencies: no single metric can accurately describe visibility across platforms like ChatGPT, Perplexity, Gemini, and Google AI Overviews simultaneously 2. Each engine cites, ranks, and frames sources differently. For instance, a 22% citation share on Google AI Overviews does not translate directly to a comparable figure on Perplexity, and averaging these disparate numbers yields an uninformative result.
The operational solution is per-engine tracking using a shared schema. Each engine should have its own Presence rate, Prominence rubric score, and Pull-Through composite. These are computed using the same tracked query set but reported in separate columns. Maintaining a consistent schema ensures clients can interpret the scorecard without needing a new legend for each engine. The individual values should not be rolled up into a single "AI visibility score," as this would obscure the variances that inform strategic decisions.
Tracking cadence also varies by engine. Google AI Overviews and AI Mode evolve frequently, warranting weekly sampling, especially given Google's continued expansion into more reasoning-heavy and multimodal responses 7. Third-party engines with less frequent model updates can be sampled biweekly without significant loss of signal. The reporting template should dedicate a row to each engine, allowing trend lines, rather than averages, to convey the performance narrative.
A Governance Model Borrowed from NIST's Measure Function
A scorecard without clear ownership leads to distrust. The NIST AI Risk Management Framework offers a valuable model, organizing trustworthy AI around four functions: Govern, Map, Measure, and Manage 11, 12. The Measure playbook specifically outlines how to define metrics for trustworthiness, transparency, accountability, and pre- versus post-deployment performance. While not designed for search agencies, this framework effectively scaffolds AI visibility programs across numerous client accounts.
Govern : Assigns KPI ownership. For an agency, this typically falls to the Head of SEO, who approves the scorecard schema, target thresholds, and the query universe for each client. Without a designated owner, Presence rates can become inconsistent as different analysts sample varying query sets and present them as comparable.
Map : Defines the scope. Before data collection begins, each client needs a documented query universe, an intent taxonomy, and a per-engine tracking plan. This mapping step is often overlooked by agencies but is crucial for enabling portfolio-wide reporting later.
Measure : Encompasses the ongoing work: weekly Presence sampling, biweekly Prominence rubrics, and monthly Pull-Through composites. NIST's emphasis on pre- and post-deployment metrics directly applies here; a client onboarding into the program requires a baseline captured before any content changes are implemented, ensuring that subsequent performance deltas are defensible in QBRs 12.
Manage : Establishes the response loop. When Presence stagnates or Prominence declines, the governance model specifies who reviews the issue, who approves content-side changes, and who authorizes republication. Treating AI visibility as a governed program, rather than an ad-hoc dashboard, enables an agency to confidently defend its numbers when a client's CMO questions accountability.
See How AI-Driven Visibility Metrics Outperform Traditional Rankings
Connect with our team to explore how integrating AI-powered search visibility KPIs can enhance reporting accuracy, automate performance tracking, and deliver actionable insights across all client accounts.
If You Manage Multiple Client Accounts: Portfolio Measurement Economics
While the framework above assumes a single client, agencies managing 20 to 200 accounts face a different challenge: the labor required for Presence, Prominence, and Pull-Through tracking multiplies across the portfolio, often without a corresponding increase in analyst headcount. This shifts the measurement question from methodology to economics.
The traditional rank-tracking model concentrated labor on setup and monthly report assembly. AI visibility measurement redistributes this effort. Answer scraping is continuous, Prominence rubrics require weekly human review, and intent segmentation needs re-tagging as the tracked query universe evolves. Agencies that simply add these tasks to existing analyst workflows without consolidation often incur double costs: for the legacy rank tracker they can't yet retire, and for the manual AI visibility work layered on top.
The table below illustrates the labor shift for a 25-client portfolio. The hours are illustrative ranges, and Heads of SEO should use their own timesheets and blended rates for accurate figures. The purpose is to highlight the nature of the change, not absolute numbers.
| Measurement task | Legacy rank-tracking model (analyst hrs/mo per client) | Unified AI visibility workflow (analyst hrs/mo per client) | Delta per client |
|---|---|---|---|
| Query universe setup and maintenance | 1.0 | 1.5 | +0.5 |
| AI Overview presence audits | 0 | 2.0 | +2.0 |
| Citation share-of-voice tracking | 0 | 1.5 | +1.5 |
| Intent segmentation and tagging | 0.5 | 1.0 | +0.5 |
| Rank position monitoring | 2.0 | 0.5 | -1.5 |
| Client reporting assembly | 3.0 | 1.5 | -1.5 |
| QBR narrative prep | 2.0 | 1.5 | -0.5 |
| Total per client | 8.5 | 9.5 | +1.0 |
For 25 clients, this manual approach adds approximately 25 analyst hours per month. This figure drives the operational decision. Agencies that automate answer scraping, Prominence scoring, and reporting assembly can recover this delta and often operate below the legacy baseline. Agencies that treat AI visibility as an additive service without consolidating the underlying data pipeline will see analyst utilization increase, compressing retainer margins.
NIST's Measure playbook guidance on pre- and post-deployment metrics also applies at the portfolio level 12. A Head of SEO should establish baseline analyst hours per client before implementing the new scorecard and track this figure quarterly. If the hours-per-client trend does not decrease within two quarters of consolidation, it indicates that the workflow is merely stacked, not consolidated. This signals the need for a unified execution layer rather than just another dashboard.
Presenting the Scorecard in a QBR Without Losing the Room
When a CMO first sees the new scorecard, they will likely ask two questions: why rank tracking is no longer effective, and what the new metrics mean for contractual traffic promises. Both questions must be addressed within the first five minutes of the QBR to ensure the rest of the presentation is not defensive.
The opening slide should feature a single comparison, not the entire scorecard. Display a single client's Presence trend line against the intent-segmented benchmark from the tracked query universe, separating informational queries from commercial investigation queries. This view effectively demonstrates that the client's content is being selected within AI answers, where the classic SERP no longer drives clicks as it once did.
Prominence and Pull-Through should be presented in the middle of the deck, framed as evidence that Presence is generating business outcomes, not just vanity citations. Pairing a Prominence rubric score with branded search lift on the same topic clusters provides a robust defense. Google's own description of AI Overviews as a "jumping-off point" rather than a direct traffic pipe 13 anchors the reporting narrative: the client is cited where decisions are now formed, and downstream signals confirm this citation is effective.
The closing slide should name the owner. Under the governance model, the Head of SEO signs off on the scorecard, the analyst team executes the Measure cadence, and the client's CMO receives a documented review point each quarter. This framework maintains engagement. The KPI changed because the search surface changed, and the accountability chain evolved accordingly.
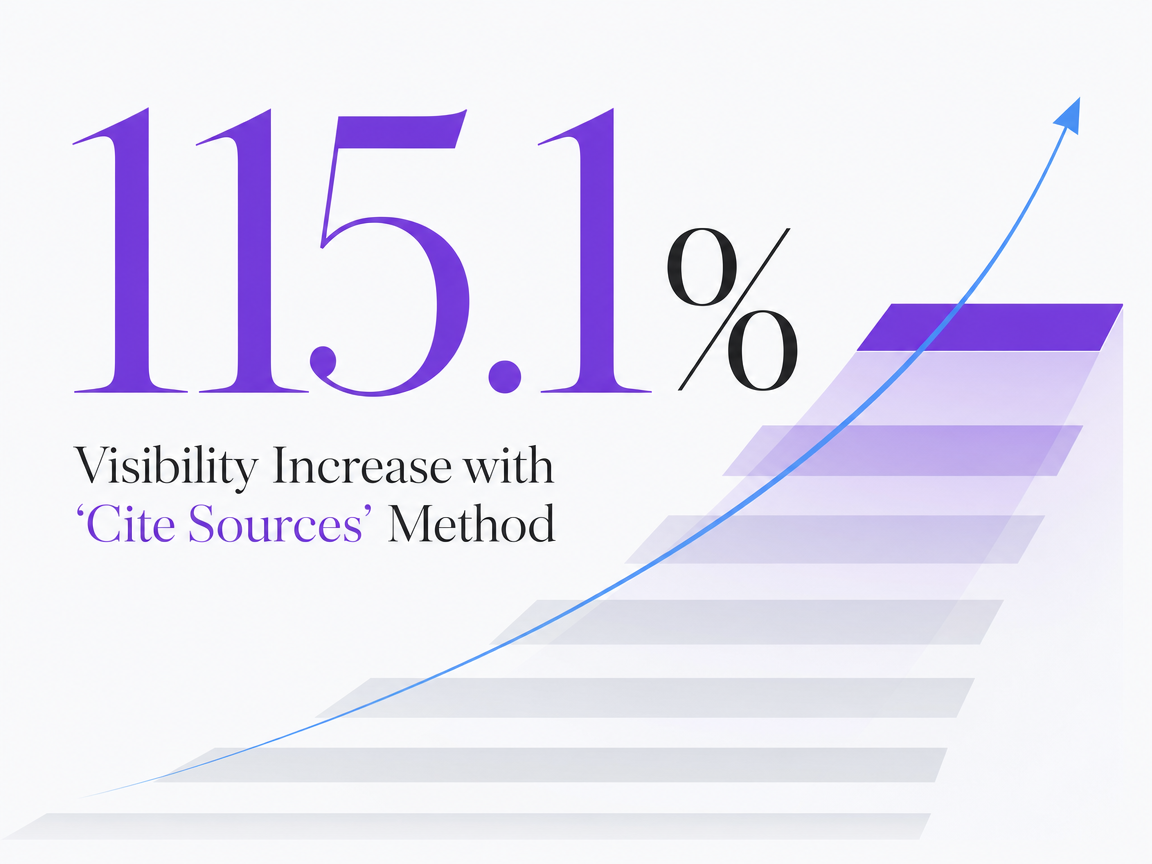 Visibility Increase with 'Cite Sources' Method
Visibility Increase with 'Cite Sources' Method
Frequently Asked Questions
References
- 1.GEO: Generative Engine Optimization.
- 2.Measuring Brand Visibility Across AI Search Engines.
- 3.AI Features and Your Website | Google Search Central.
- 4.Optimizing your website for generative AI features on Google Search.
- 5.Google AI Overviews - Search anything, effortlessly.
- 6.Generative AI in Search: Let Google do the searching for you.
- 7.Expanding AI Overviews and introducing AI Mode.
- 8.Google's AI overviews linked to lower publisher clicks.
- 9.Google AI Overview Data Looks Different For Commercial Queries.
- 10.Google AI Overviews Decoded - Medill Spiegel Research Center.
- 11.AI Risk Management Framework (AI RMF 1.0).
- 12.Measure - AIRC - NIST AI Resource Center.
- 13.How AI Overviews in Search work.