
Key Takeaways
- AI share of voice behaves as a distribution across prompts, models, and time, so a defensible report shows a median, a range, and run count rather than a single percentage 13.
- Track four components separately—citation frequency, narrative inclusion, sentiment and framing, and generative share of voice—because they move independently and require different optimization levers 8.
- Model family and geography materially shift results, with a 30.6-point gap between Chinese and international LLMs on equivalent queries, so break reporting out by surface instead of aggregating 14.
- Translate visibility into pipeline using standardized prompts, repeated-run medians, and existing conversion multipliers, reporting a 25th-to-75th-percentile band that finance can audit against the $750 billion AI discovery opportunity 10.
Why a single AI visibility score will mislead your next budget review
A CEO asks the marketing VP a reasonable question: "Are we showing up in AI?" The honest answer is that the question itself is malformed. AI search outputs are non-deterministic, which means a brand can appear in ChatGPT, Perplexity, Gemini, or Google's AI Overviews on Monday and vanish from the same prompt on Thursday without any change in the underlying content. Day-to-day source overlap in repeated AI search runs averaged only 34–42%, with brand-level overlap landing between 45–59%, based on controlled testing across major LLM-powered search surfaces 13. A single observation is not a measurement. It is a sample of one from a distribution.
That distinction matters in a budget conversation. McKinsey estimates AI search could affect roughly $750 billion in revenue by 2028, yet only 16% of brands systematically track AI search performance today 10. The brands that report a clean number to their board are usually reporting noise. The brands that ignore the channel entirely are conceding it.
The rest of this analysis treats AI share of voice as a distribution across prompts, models, and time, ties that distribution to excess-share-of-voice growth logic, and lays out an operating model that does not require another agency retainer. The goal is a defensible methodology, not a vanity dashboard.
What AI share of voice actually measures
From media spend to model mentions: the inherited logic
Classic share of voice was a spend metric. Nielsen has defined it for decades as a brand's media expenditure expressed against total category spend, with the underlying assumption that paid impressions buy attention and attention compounds into preference 15. The competitive benchmarking logic is intact in AI environments. The data source is not.
AI share of voice replaces the impression with the model response. A brand competes for inclusion in the answer Perplexity returns, the citation ChatGPT footnotes, the entity Gemini names when a user asks for the three best options. Spend buys nothing here directly. What buys visibility is whether the model's training data, retrieval layer, and ranking logic surface the brand when a category-relevant prompt is issued.
The inherited concept is comparative visibility against a defined competitor set in a defined category. The new measurement substrate is a probabilistic system that emits different answers to the same question depending on phrasing, recency, and run order. VPs who lift the old formula without rebuilding the data layer end up reporting a number that looks familiar and behaves nothing like the original.
The four components VPs should track separately
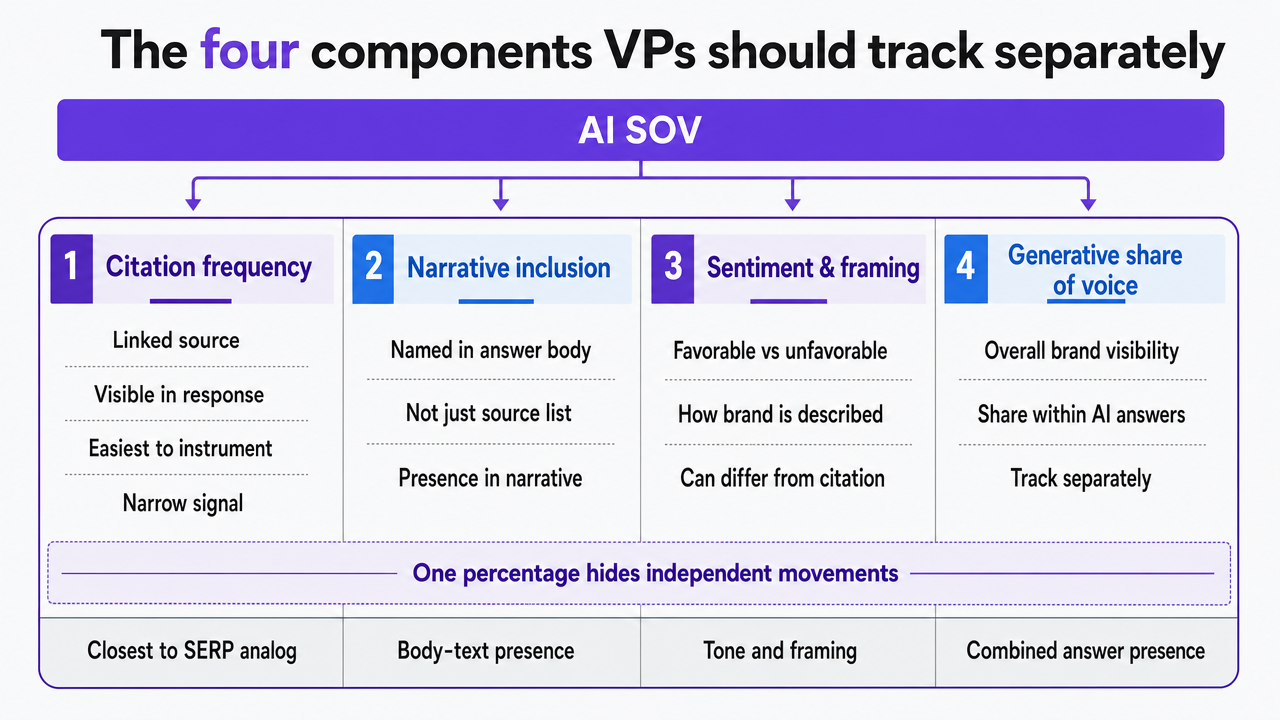
Treating AI SOV as a single percentage collapses four distinct measurements that move independently and require different optimization work. The cleanest decomposition splits brand visibility in AI answers into citation frequency, narrative inclusion, sentiment and framing, and generative share of voice 8.
Citation frequency : Counts how often a brand's owned domain or content appears as a linked source beneath an AI answer. This is the closest analog to organic SERP presence and the easiest to instrument, because the citations are usually visible in the response. It is also the narrowest signal. A brand can be cited often and still be described unfavorably one paragraph above.
Narrative inclusion : Tracks whether the brand is named in the body of the answer itself, not just in the source list. A model that pulls facts from a brand's site but never mentions the brand by name produces citation frequency without narrative presence. That pattern shows up regularly for category-defining queries where the model summarizes rather than attributes.
Sentiment and framing : Measures how the brand is described when it does appear: leader, challenger, budget option, niche specialist, problem case. Two competitors can hold equal mention counts and very different positioning in the same answer.
Generative share of voice : The comparative measure across the competitor set: out of all brand mentions the model produced for a defined prompt set, what percentage belonged to the focal brand. This is the metric closest to classic SOV in spirit and the one most likely to be misread if the other three are ignored.
Each component requires its own data capture, its own optimization lever, and its own reporting cadence. A board-ready AI SOV view is a quadrant, not a headline number.
 Visualize the four-component decomposition of AI SOV that the section explains, since this is a framework without chartable data
Treating AI SOV as a distribution, not a snapshot
Day-to-day instability in repeated AI search runs
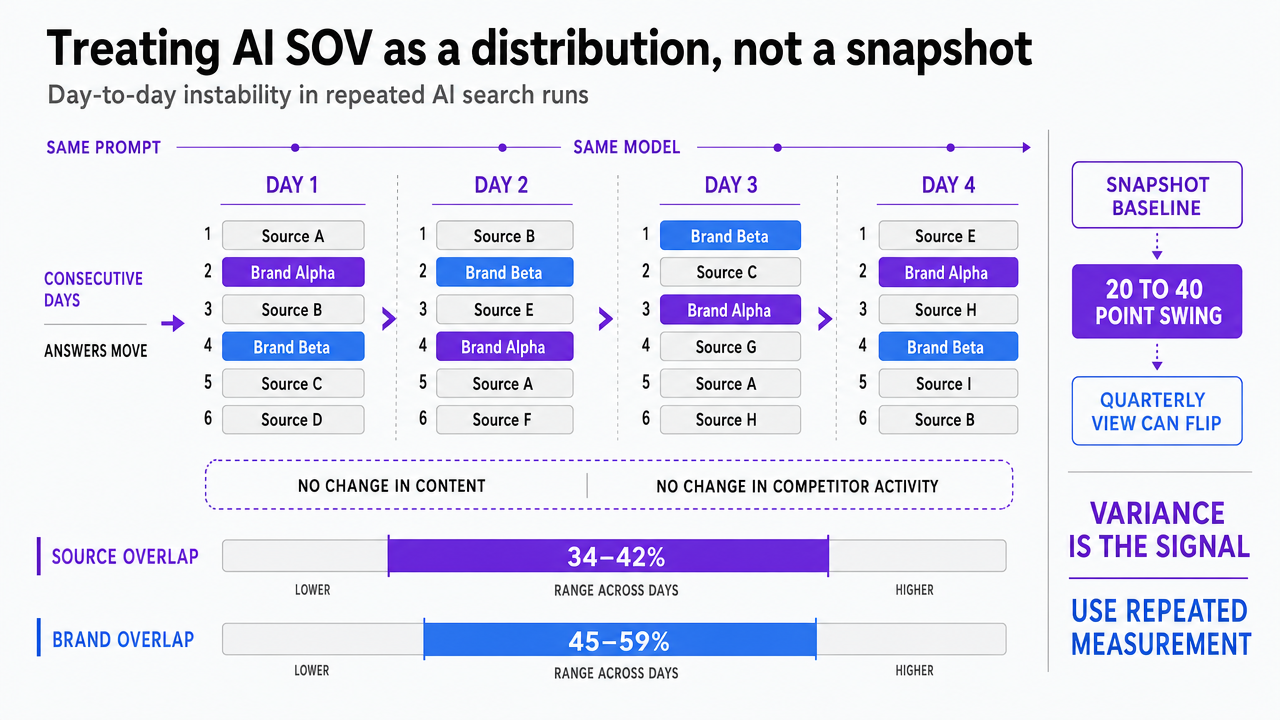
The cleanest way to see why AI SOV resists single-number reporting is to issue the same prompt to the same model on consecutive days and log the brands named. The answers move. Controlled testing across major AI search surfaces found day-to-day source overlap averaging only 34–42% and brand-level overlap of 45–59% when the same prompts were re-run on the same models 13. Roughly half the citation set turns over from one observation to the next, with no change in the underlying content or competitor activity to explain it.
That variance is not noise to be averaged away in a single weekly check. It is the signal. Sampling one response per prompt and treating the result as a baseline produces a number that may swing 20 to 40 points the following week, which is enough to flip a quarterly trend line in either direction.
The same research recommends at least 7 repeated runs per prompt to stabilize brand-level visibility tracking and 8 runs to stabilize source-level coverage 13. Below those thresholds, the confidence interval around any single AI SOV figure is wide enough that competitor comparisons become unreliable.
The operational implication is straightforward. A defensible AI SOV report shows a range, a median, and a run count, not a single percentage. Reporting infrastructure has to log every run, timestamp it, and store the raw response so that distributions can be reconstructed when a board member asks why the number moved. Anything thinner is a screenshot, not a measurement.
Prompts as a sampling design, not a creative exercise
Once the run count is fixed, the next variable is the prompt set itself. In classic SEO, a keyword list is a demand map. In AI SOV, a prompt set is closer to a survey instrument: each prompt is a question whose phrasing materially shapes the answer the model returns. That makes prompt construction a sampling design problem rather than a copywriting task.
Research on LLM product recommendations shows the size of the framing effect. Cognitive biases embedded in prompt language change which brands the model surfaces and how it ranks them, with social proof cues meaningfully boosting recommendation rate and scarcity or exclusivity cues pulling visibility down 16. A prompt that asks for "the most popular options used by thousands of teams" will produce a different brand list than "a curated short list of specialist providers," even when the underlying intent is identical.
The methodological correction is to fix the prompt set, document its construction logic, and refresh it on a known cadence rather than letting individual analysts rewrite prompts between reporting cycles. Each prompt should map to a defined buyer scenario, a defined category framing, and a defined competitor set. Variants should be tested deliberately to measure framing sensitivity, not introduced ad hoc.
Reported alongside median visibility and run count, prompt-set version becomes the third coordinate that lets a CFO read AI SOV the way they read any other sampled metric: with a clear scope and a stable instrument.
 Visualize the day-to-day instability finding that underpins the section's core argument about repeated measurement
Test AI share of voice metrics in action
Get real-time insights on your brand’s digital share of voice using your own campaigns and data.
The Existence Gap: why model family and geography change the score
Run count and prompt design control the noise within a single model. They do not address what happens when the same brand is queried across different model families. AI SOV varies by which LLM is answering, and the variance is not small.
Research on cultural encoding in LLM-mediated brand discovery measured brand mention rates across model families and found Chinese-developed LLMs surfacing brands at 88.9% versus 58.3% for international LLMs on equivalent category queries — a 30.6 percentage-point gap traced to differences in training-data composition, language coverage, and retrieval behavior rather than the underlying brand strength 14. One case study in the same work recorded 0% visibility in international LLMs against 65.6% in Chinese LLMs for a brand that performed well in its home market 19. A brand can be present in one ecosystem and effectively absent in another without any change to its own content, site, or PR footprint.
The practical consequence for a US-based VP is that an AI SOV report built only on ChatGPT and Perplexity reflects a slice of the discovery surface, not the whole of it. Gemini draws on a different retrieval substrate. Copilot weights enterprise content differently. Regional models matter for any brand selling into Asia-Pacific, Europe, or Latin America, where local LLMs and AI assistants are absorbing share of category queries from international platforms.
A defensible measurement plan names the surfaces it monitors and acknowledges what it is not measuring. The reporting view should break AI SOV out by model family, not aggregate everything into one figure. When the gap between model families exceeds the gap between competitors on a single model, that pattern is itself the strategic finding — it tells the team whether the optimization problem is content authority, entity recognition, or training-data presence in a specific ecosystem.
Tying AI SOV to ESOV and pipeline a CFO will accept
The 10-point rule and its limits in AI environments
Visibility metrics without a growth model attached are decoration. The classic bridge from share of voice to share of market is excess share of voice: the difference between a brand's voice and its current market share, with empirical work showing that every 10 percentage points of ESOV corresponds to roughly 0.5% of additional market share growth per year, averaged across categories and countries 4. That figure is an average effect, not a guarantee, and it was derived from advertising-spend SOV in well-defined consumer categories. The logic transfers to AI environments. The coefficient does not transfer cleanly.
Three differences matter when porting ESOV into AI SOV:
- The denominator is unstable. Classic SOV uses a known category spend total; AI SOV uses a brand-mention universe defined by the prompt set, which can be widened or narrowed by adding queries.
- The visibility unit is non-deterministic, so the SOV term itself is a distribution rather than a point estimate.
- AI surfaces compress the consideration set. A model that names three brands in an answer behaves differently from a TV category that exposes a viewer to a dozen advertisers in a week.
The defensible move is to treat the 10-point rule as a directional anchor rather than a forecast. A brand running at +15 points of ESOV on a stable prompt set across two or more major LLMs should expect share gain pressure to build over a multi-quarter horizon. A brand at -10 points is bleeding mindshare in the discovery layer, regardless of what its current SEO dashboard reports. The number to defend in front of a CFO is the sign and magnitude of ESOV, with confidence intervals attached, not a precise share-growth projection.
Translating visibility distributions into pipeline math
ESOV explains the long-run direction. A pipeline conversation needs a shorter-horizon model. The translation runs through three multipliers a finance team can audit: prompt-to-session conversion, session-to-qualified-lead conversion, and qualified-lead-to-revenue conversion.
The starting variable is prompt volume by buyer scenario. Each prompt in the standardized set maps to an estimated query volume — drawn from internal call logs, search demand data, and sales-conversation transcripts — and a median visibility figure produced by the repeated-run methodology. Multiplying expected query volume by median brand-mention probability yields an expected impression count on AI surfaces for that scenario. Roughly half of consumers already use AI search, and AI-mediated discovery could affect about $750 billion in revenue by 2028 10, which sets the order of magnitude for why this denominator is no longer negligible.
From there, the math behaves like any other channel model. Apply an AI-referral click-through assumption from server logs, a session-to-lead rate from existing analytics, and a lead-to-revenue rate from CRM. The output is a pipeline contribution range, not a point estimate, because the visibility input is itself a range. Reporting it as a 25th-to-75th-percentile band keeps finance honest about the uncertainty without abandoning the channel. That is the form of AI SOV reporting a CFO will sign off on: bounded, sourced, and tied to the same conversion ladder the rest of the marketing P&L already uses.
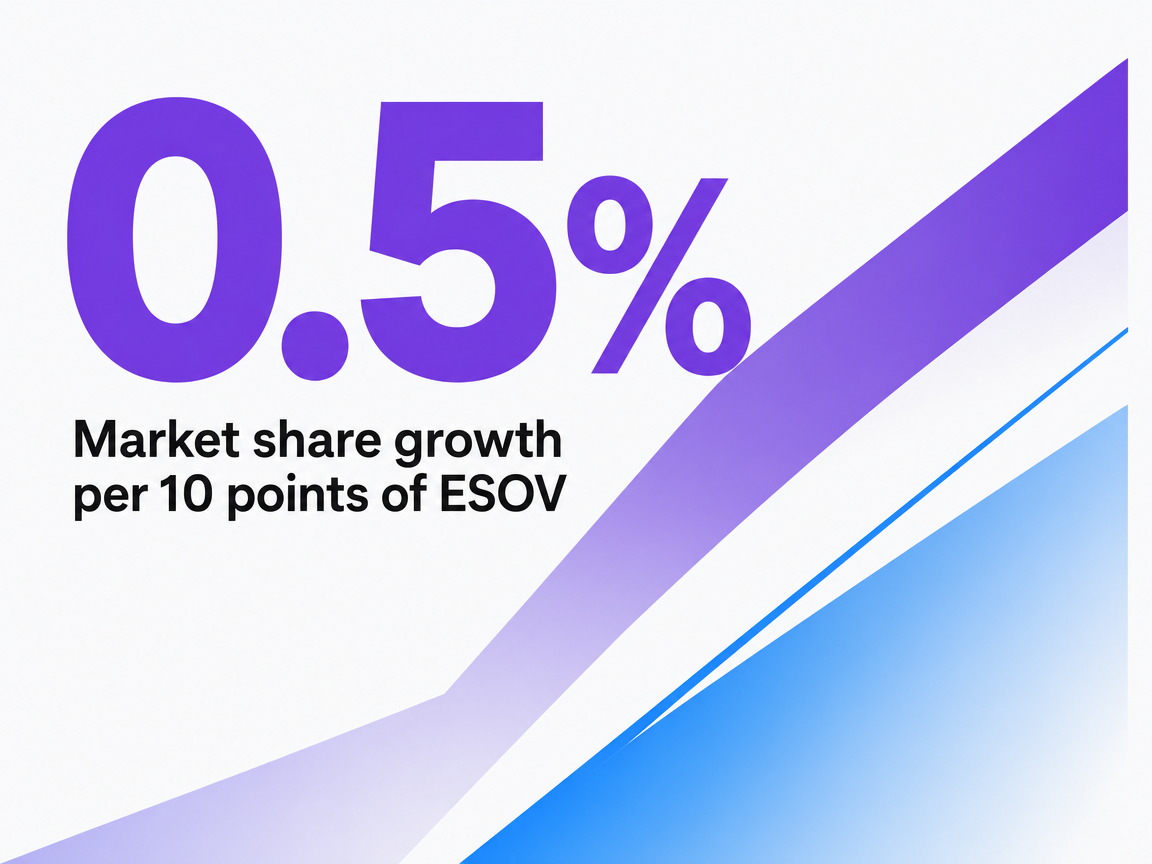 Market share growth per 10 points of ESOV
Market share growth per 10 points of ESOV
See How Leading Teams Quantify AI Share of Voice in Competitive Markets
Request a demo to benchmark your brand’s AI share of voice against industry leaders and discover data-driven methods to optimize channel investment for predictable pipeline growth.
Failure modes: volume without authenticity, mentions without sentiment
Two patterns regularly produce an AI SOV chart that climbs while the underlying brand position weakens. Both are visible in the data if the report is built to surface them.
The first is volume without authenticity. AI-assisted content production can lift output by an order of magnitude, and experimental work on generative AI in social environments documents a dual effect: engagement and content volume rise while perceived quality and authenticity fall in the same audiences 18. A brand can flood category prompts with citable assets, watch citation frequency climb, and lose narrative weight at the same time. The model is naming the brand more often and describing it less distinctively.
The second is mentions without sentiment. Generative SOV counts presence. It does not, on its own, register whether the brand is framed as the leader, the cautionary example, or the budget fallback. Two competitors holding equal mention counts can occupy opposite positions in the same answer, and a rising mention curve paired with flat or declining favorable framing is a warning, not a win. Sentiment and framing have to be scored on the same cadence as the count, or the dashboard misreads its own data.
Operating model: agency stack versus an in-house execution loop
The competitive whitespace most brands are still ignoring
The measurement work described so far — repeated runs, standardized prompt sets, model-family decomposition, sentiment scoring — is not exotic. It is also not what most marketing teams are doing. Roughly 16% of brands systematically track AI search performance today, against a McKinsey estimate that AI-mediated discovery could touch about $750 billion in revenue by 2028 10. The gap between those two figures is the competitive whitespace.
A VP looking at that ratio should read it as a timing argument. The 84% of brands without a tracking program are not absent because the work is impossible. They are absent because the work does not fit cleanly into existing vendor contracts. SEO agencies own keyword rank reports. PR firms own earned-media mentions. Analytics vendors own dashboards. None of them, by default, own a repeated-prompt visibility instrument that spans ChatGPT, Perplexity, Gemini, and Copilot.
The brands that build a defensible AI SOV program in the next 12 to 18 months establish baselines before their categories saturate with optimization work. The brands that wait inherit a tracking problem with their competitors' content already cited.
Vendor coverage compared to a consolidated AI execution loop
The standard way to assemble AI SOV coverage today is to stitch it across the existing vendor roster. An SEO agency adds a generative-engine-optimization line item. A PR firm tracks AI-driven mentions through its monitoring tool. An analytics vendor builds a dashboard pulling from whichever APIs are available. A content vendor produces the assets the strategists ask for. The work happens. The seams show up in the approval cycle.
The table below maps the variables a VP can actually audit against this split model versus a consolidated AI execution loop. Dollar figures are not included because competitor agency pricing is not standardized across the supplied research.
| Variable | Split agency stack | Consolidated AI execution loop |
|---|---|---|
| Vendors coordinating the work | 3–4 (SEO, PR, analytics, content) | 1 platform, internal owner |
| Approval cycle length | 7–14 days across briefings and handoffs | Same-day to 48-hour review windows |
| Prompt-set refresh cadence | Quarterly, if owned at all | Monthly with version logging |
| Monitored model surfaces | 1–2 (typically ChatGPT, sometimes Perplexity) | 4+ (ChatGPT, Perplexity, Gemini, Copilot, AI Overviews) |
| Citation, narrative, sentiment, generative SOV scored together | Rare; usually split across vendors | Unified in one reporting view |
The point of the comparison is not that agencies do poor work. It is that the unit of work in AI SOV — a repeated, versioned prompt set scored across four sub-metrics on four-plus surfaces — does not decompose cleanly across four vendors. Experimental work on AI-assisted production shows personalized AI-generated content can outperform generic equivalents in perceived effectiveness 17, which raises the throughput ceiling for any team that consolidates execution under a single approval workflow rather than routing every asset through external briefing cycles.
If you manage multiple locations or practices
The reader scenario shifts here. Single-brand VPs can report one AI SOV distribution per major surface. Operators running multi-location service businesses — law firm networks, behavioral health groups, dental support organizations, home services franchises, senior living portfolios — face a different reporting problem. AI answers to "best [category] in [city]" produce a different brand-mention distribution for each market, and the local distributions do not average cleanly into a corporate number.
A defensible portfolio view scores AI SOV by location, by service line, and by buyer scenario. A practice that holds 40% generative SOV in one metro can sit at 5% in the metro 80 miles down the road, on the same prompt set, with the same parent brand. The optimization work — local entity signals, location-specific content authority, review presence in retrieval corpora — runs per location, not per brand.
The operating model that holds up under that load is the same consolidated loop, indexed by location. One prompt-set framework, one scoring rubric, location-level reporting, approval gates that scale without adding a project manager per market. Vectoron is built for that shape of work.
Frequently Asked Questions
References
- 1.What Is Share of Voice? Measure Visibility & Outrank Rivals.
- 2.Share of Voice Guide: Calculation, Tools, and Best Practices.
- 3.Excess Share of Voice (ESoV): The Single Number That Predicts Whether You Gain or Lose Share.
- 4.Excess Share of Voice (ESOV): The Evidence-Based….
- 5.Budgeting for the Upturn - Does Share of Voice Matter.
- 6.Share of Voice vs Share of Market (SOV–SOM) Framework.
- 7.Understanding AI visibility.
- 8.Why Brand Visibility Is The AI Era's Performance Metric.
- 9.Winning AI Search: How AI Visibility and Optimization Put Consumers First.
- 10.Winning in the age of AI search.
- 11.The Role of Artificial Intelligence in Personalizing Social Media Marketing Strategies.
- 12.Will Brand Discovery Happen Mostly Within AI-Driven Agents?.
- 13.Don't Measure Once: Measuring Visibility in AI Search (GEO).
- 14.The Existence Gap in AI-Mediated Brand Discovery.
- 15.Need to know: What is share of voice?.
- 16.The Impact of Cognitive Biases on LLM-Driven Product Recommendations.
- 17.The potential of generative AI for personalized persuasion at scale.
- 18.The impact of generative AI on social media: an experimental study.
- 19.The Existence Gap in AI-Mediated Brand Discovery.
- 20.Don't Measure Once: Measuring Visibility in AI Search (GEO).