
Key Takeaways
- Traditional single-ratio ROI was built for B2C transactions and breaks down in B2B service cycles, where strategic factors often outweigh pure return on spend 2.
- Build a fully-loaded cost baseline covering internal labor, external spend, tooling, distribution, and management overhead, since in-house teams routinely undercount true costs by 40-60%.
- Layer four measurement methods to match executive questions: the AMA financial formula for cost discipline, MMM for demand contribution, multi-touch attribution for pipeline influence, and TEI for multi-year investments.
- Track brand equity, sales enablement, and share of search as leading indicators, and pursue the 15-20% reallocation opportunity McKinsey identifies through analytics-driven execution 8.
Why the ROI formula your CFO wants was built for a different business
The traditional ROI formula, "return minus cost, divided by cost," is designed for quick, transactional sales typical of B2C contexts, like retail purchases or direct-response ads 1. This formula struggles when applied to B2B service verticals, where sales cycles can extend from six to eighteen months and involve multiple gated approvals. In such scenarios, a single ROI number can be misleading, fluctuating wildly depending on the reporting quarter and failing to accurately reflect content's long-term contributions.
The core issue is that ROI is often expected to answer questions it was not designed for. Forrester analysts emphasize that ROI is just one metric among many, and strategic considerations can often outweigh a purely financial return on investment 2. A single ratio cannot differentiate between a nurture asset that accelerated a $400,000 deal and a top-of-funnel guide that built pipeline for the following fiscal year. Yet, marketing VPs are frequently tasked with defending these distinctions to CFOs who rely on a single spreadsheet figure.
This article addresses this fundamental mismatch by outlining a measurement architecture that provides comprehensive answers beyond the limitations of a single ROI formula.
Reframing ROI as a measurement design problem, not a math problem
What single-number ROI can and cannot answer in a long sales cycle
A single ROI figure oversimplifies complex buyer journeys that span months, especially in service industries with gated approvals and sales-assisted deals. While it can confirm if a program broke even against a defined cost, it cannot distinguish the impact of an asset that closed a $250,000 legal engagement from a pillar page that generated numerous unqualified inquiries in the same quarter. Forrester states that strategic factors frequently outweigh pure return on spend 2.
Academic research further supports this, indicating that content marketing effectiveness is heavily influenced by contextual factors such as strategy alignment, content quality, and audience targeting, rather than just spending levels 3. This means two programs with identical budgets and ROI ratios could have vastly different strategic values, a nuance that a single ratio fails to capture.
While single-number ROI can provide a cost baseline and indicate directional shifts over time, it cannot explain the reasons behind those shifts, identify which specific assets were responsible, or predict whether influenced pipeline will convert into revenue.
The four questions executives are actually asking
When a CFO requests content ROI, they are typically bundling four distinct questions that a single ratio cannot address. Recognizing these questions is key to a more productive conversation.
The first is a cost-discipline question: Is the content function accurately reporting its fully-loaded costs, or is the reported spend understating the true investment? The second is an attribution question: How much pipeline and closed revenue can be credibly linked to content touchpoints, and through which attribution model? The third is an efficiency question: Can the same outcomes be achieved with less spending, or better outcomes with the same spending? McKinsey's analysis suggests that 15–20% of marketing budgets could be reallocated without loss of ROI through improved models 8. The fourth is a strategic-fit question: Does content investment advance long-term brand goals, sales enablement, and category leadership?
Each of these questions requires a different measurement approach—cost baselining, multi-touch attribution, marketing mix modeling, and Total Economic Impact narratives, respectively. Each method provides a distinct signal on a different timeline. Attempting to answer all four with a single ratio obscures valuable insights; separating them is the foundation of a robust measurement architecture.
Building the fully-loaded content cost baseline
The cost categories in-house teams routinely undercount
Many in-house content programs report a cost denominator that is significantly lower—often 40 to 60 percent—than their actual production expenses. This discrepancy stems from overlooking key cost categories, not from intentional misrepresentation. Typically, reported spend only covers freelance invoices and a portion of tooling costs.
A defensible ROI calculation requires incorporating five critical cost categories into a single, comprehensive figure:
-
Internal labor: This includes prorated FTE allocations for writers, editors, subject-matter experts, and strategists based on the time dedicated to content. In specialized fields like behavioral health or DSO acquisition, legal and clinical review often consume significant senior-level time, which carries a high loaded cost.
-
External spend: This category, which most teams already track, covers freelance writers, agencies, design contractors, and video producers.
-
Tooling stack: Costs for CMS licenses, SEO platforms, analytics tools, keyword research software, editorial workflow systems, AI writing assistants, and design software, though individually small, accumulate to a material sum.
-
Distribution: Expenses for paid amplification, email platform costs allocated to content sends, syndication fees, and influencer or partner placements should be attributed directly to the content assets they support, not treated as separate media line items.
-
Management overhead: This includes the time spent by VPs, project managers, reporting efforts, and cross-functional coordination with sales and product teams. This category is often omitted by marketing but is highly valued by finance.
McKinsey's research indicates that 15-20% of marketing budgets could be reallocated for better ROI through improved analytics 8. This efficiency potential remains hidden until a truly honest cost baseline is established. A program appearing profitable at half its true cost cannot be effectively optimized because the underlying inefficiencies are masked by underreported spend.
A cost baseline table VPs can adapt without inventing figures
The following table serves as a template, not a benchmark, using category labels and placeholders for VPs to populate with actual figures from finance, HR, and procurement. The objective is to create a single, comprehensive denominator that withstands detailed financial scrutiny.
| Cost category | Included inputs | Allocation basis |
|---|---|---|
| Internal labor | Writer, editor, strategist, SME reviewer FTE loads | % of time on content × fully loaded salary |
| External spend | Freelance writers, design, video, agency retainers | Direct invoice total |
| Tooling stack | CMS, SEO, analytics, editorial workflow, AI assistants, design | Annual license × content share of use |
| Distribution | Paid amplification, email platform, syndication, partner placements | Direct spend attributed to content assets |
| Management overhead | VP time, PM, reporting, sales/product coordination | % of time on content × fully loaded salary |
Two operational aspects are crucial: allocations should be documented and refreshed quarterly to ensure the baseline remains current. Additionally, these same cost categories should inform the numerator of any attribution model, ensuring consistency and a single source of truth for ROI calculations. Forrester emphasizes that effective measurement requires clear objectives, methodologies, and integration with broader performance management 2, a process initiated by this baseline table.
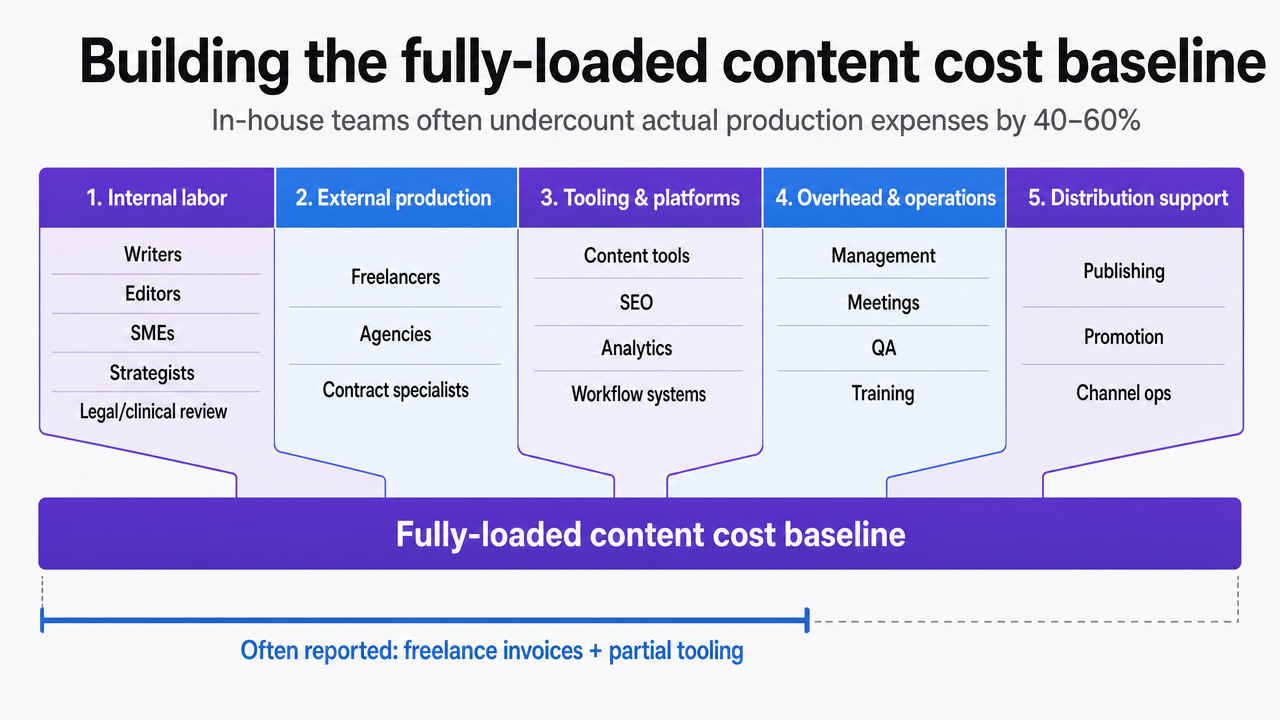 Visualize the five cost categories that make up a fully-loaded content cost baseline, reinforcing the section's core framework that in-house teams undercount by 40-60%
Run a Real-World Content ROI Experiment Now
Measure the impact of new content on your pipeline using your actual data and workflow.
A layered measurement architecture for content contribution
Financial formula: the AMA template and its attribution ceiling
The American Marketing Association's ROI calculator toolkit provides a robust starting point for a defensible financial ratio. It tracks spend, leads, revenue, and ROI across channels using a formula familiar to finance teams and can be adapted for content programs 9. For marketing VPs facing quarterly pressure, it offers a number that CFOs will accept as a common reference point.
However, this approach quickly reaches its limits. A calculator that takes spend and closed revenue as inputs assumes that attribution has already been resolved, which is often not the case in sales-assisted service businesses. If a whitepaper influenced three deals over two quarters and a webinar sequence impacted two of those same accounts, the calculator will credit whichever touchpoint the CRM designates as the source of record. This is an accounting decision, not a true measurement of influence.
The financial formula serves as the cost-discipline layer within the measurement architecture, linking reported spend to reported revenue against a fully-loaded baseline. It should not be relied upon to answer influence-related questions it is inherently incapable of addressing.
Marketing Mix Modeling for top-of-funnel and brand-driven demand
Marketing Mix Modeling (MMM) addresses the limitations of the financial formula. Deloitte describes MMM as a statistical method that quantifies the relationship between marketing inputs (e.g., advertising, content) and outcomes (e.g., sales, pipeline), providing marginal contribution estimates for reallocation decisions 7. Content is analyzed as one variable among many, making MMM particularly effective for measuring brand-driven and top-of-funnel demand that doesn't involve direct form fills.
MMM answers a crucial question: Based on historical spend and outcomes, what is content's marginal contribution to demand, and where should the next dollar be invested for the highest return? It inherently accounts for long lag times and diminishing returns, making it suitable for service verticals where a blog post published in Q1 might generate qualified inbound leads in Q3.
The primary requirement for MMM is extensive, clean historical data on spend and outcomes. Its outputs also rely on model assumptions that CFOs will scrutinize. MMM is best suited for annual planning and budget reallocation, rather than monthly performance reviews.
Multi-touch attribution for pipeline influence and sales-assisted revenue
Multi-touch attribution (MTA) operates at the account and opportunity level, distributing credit across all content touchpoints a buyer engaged with before closing a deal. This method directly addresses the question the AMA formula avoids: which assets influenced pipeline, and how much sales-assisted revenue can be linked to content activity, rather than just the last click before conversion.
Forrester emphasizes that ROI is one metric among many, and strategic factors—including sales enablement and multi-quarter influence—can often be more important than pure return on spend 2. MTA highlights these factors through reports on influenced pipeline, counts of content-touched opportunities, and accelerated stage progression for accounts that consumed specific assets, presenting data in a format recognizable to revenue teams.
MTA relies on accurate stitching of data across CRM and marketing automation systems, spanning sessions, devices, and anonymous-to-known transitions, which is rarely perfect in B2B environments. Different weighting models (e.g., linear, time-decay, position-based) embody distinct theories of buyer behavior, which must be documented and defended. When used transparently, MTA provides crucial mid-funnel signals that prevent the financial formula from underreporting content's true contribution.
Total Economic Impact for CFO-grade business cases
For multi-year investment decisions—such as platform purchases, content operations overhauls, or shifts from agency to in-house execution—the Total Economic Impact (TEI) methodology is the appropriate tool. Forrester's TEI framework analyzes investments across four pillars: benefits, costs, risks, and flexibility, providing an objective assessment of financial impact 10.
TEI's value for content ROI lies in its ability to shift the conversation beyond simple ratios to broader consequences. Benefits include revenue growth and productivity gains; costs encompass the fully-loaded baseline; risks quantify potential downsides; and flexibility assesses the option to adapt the investment. Forrester explicitly positions TEI as a method to provide "an objective analysis of the benefits—including the economic benefits—costs, risks, and flexibility that buyers realize" 11.
For a Marketing VP, TEI presents the content program as a robust business case with quantified downside protection, a format that CFOs are equipped to approve.
Choosing the right method for the question in front of you
These four measurement methods are complementary, not interchangeable. Each addresses a specific executive question, requires a distinct data foundation, and yields signals on a unique timeline. The table below helps clarify when to use each approach.
| Method | Executive question answered | Data requirements | Time-to-signal |
|---|---|---|---|
| Financial formula (AMA template) | Are we breaking even against a fully-loaded cost baseline? | Spend, closed revenue, source-of-record attribution | Monthly to quarterly |
| Marketing Mix Modeling | What is content's marginal contribution to demand, and where should the next dollar go? | Multi-quarter spend and outcome data across channels | Annual planning cycle |
| Multi-touch attribution | Which content assets influenced pipeline and sales-assisted revenue? | CRM + MAP integration, opportunity-level touchpoint data | Rolling, per opportunity |
| Total Economic Impact | Does a multi-year content or platform investment clear the CFO's hurdle rate? | Benefits, costs, risks, flexibility inputs | Investment decision milestones |
Forrester's stance—that ROI is one metric among many and strategic factors can outweigh pure return on spend 2—validates this layered approach. A VP who can leverage all four methods, selecting the appropriate one for each CFO question, can control the narrative rather than merely defending a single ratio.
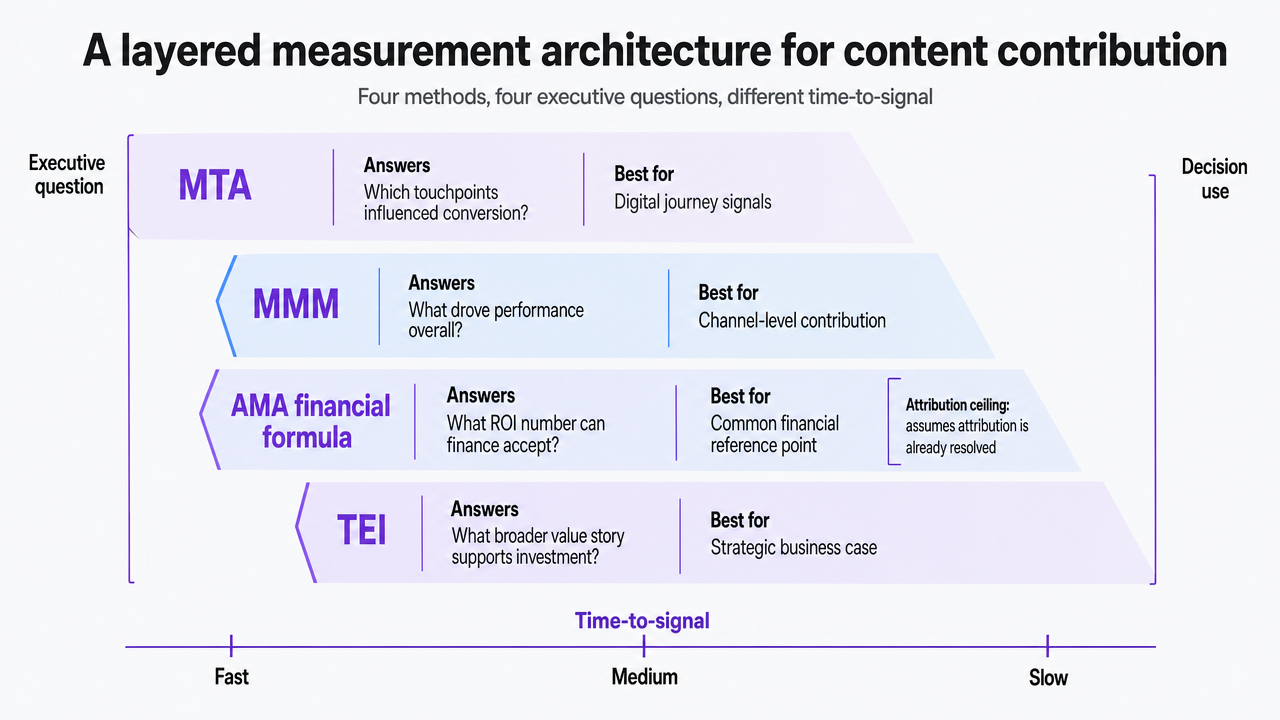 Visualize the four-method measurement framework (AMA financial formula, MMM, MTA, TEI) described in this section, showing which executive question each answers and its time-to-signal
Funnel-stage KPIs that map to the three-lens digital success model
The effectiveness of a measurement architecture depends on KPIs that align with executive priorities. Forrester's digital success benchmark, which focuses on productivity, customer experience, and revenue impact, provides a strong framework 5. Content KPIs can be mapped to these three lenses, allowing VPs to translate complex data into a clear, defensible narrative.
The productivity lens measures throughput and cost efficiency. Relevant KPIs include cost per published asset, editorial cycle time, and the percentage of assets published according to the roadmap. This lens also incorporates the fully-loaded cost baseline, which underpins all subsequent ratios. Finance teams readily understand this lens as it directly relates to operational discipline.
The experience lens assesses how buyers engage with content. Key metrics here include engaged sessions per asset, scroll depth on cornerstone pages, return visitor rates, and assisted conversions from content-touched sessions. This layer provides measurable evidence for the peer-reviewed finding that contextual factors like strategy fit, quality, and targeting significantly influence content effectiveness 3.
The revenue lens quantifies content's contribution to pipeline and closed deals. KPIs such as sales-influenced pipeline, content-touched opportunity velocity, and stage-progression rates for accounts consuming specific assets directly translate content activity into financial metrics that CFOs track. Presenting these KPIs across these three distinct columns, rather than as a single list, helps reinforce a cohesive narrative.
What ROI cannot tell you: brand equity, sales enablement, and share of search
Even a comprehensive measurement architecture will not capture every valuable signal. Forrester's framework explicitly states that ROI is one metric among many, and strategic factors can outweigh pure return on spend 2. Three such factors—brand equity, sales enablement, and share of search—are crucial but often overlooked in traditional ROI calculations.
Brand equity is the first. Metrics like branded search queries, unprompted analyst mentions, or category associations that shorten a buyer's shortlist do not appear in attribution reports. Yet, they reduce the cost per opportunity across subsequent campaigns. Research indicates that brand-driven demand is more tied to strategy fit and content quality than to spending levels 3, making it resistant to simple ROI ratios.
Sales enablement value is the second. Content that shortens discovery calls, equips sales representatives with rebuttal materials, or de-risks procurement reviews generates margin that impacts the sales P&L, not just marketing's. Proxies for this value include content-touched deal velocity and rep-reported asset usage.
Share of search is the third. This metric represents the percentage of category-relevant queries a brand captures relative to competitors. It serves as a leading indicator of pipeline that financial formulas only recognize quarters later, and it should be presented in CFO conversations as forward-looking evidence.
See the True ROI Impact of Your Content Marketing Investment
Request a data-driven ROI assessment tailored to your content strategy. Get clarity on pipeline contribution, CAC, and conversion benchmarks—built for teams managing complex, multi-channel execution.
Closing the efficiency gap with AI-driven execution
Where analytics-driven reallocation actually finds the 15–20%
McKinsey's finding that 15-20% of marketing budgets can be reallocated without ROI loss through better analytics 8highlights inefficiencies in traditional planning. These gaps are particularly prevalent in content programs.
One significant area is asset-level performance drift. Cornerstone pages that once drove substantial pipeline may now generate only a fraction of their previous engagement, yet they continue to consume refresh budgets at the same rate as high-performing assets. An analytics model that scores assets by current contribution, rather than publication date, allows for budget reallocation from maintaining underperforming content to acquiring underserved queries.
Another area is channel overlap. Paid amplification, email, and organic search often target the same accounts at similar funnel stages. Marketing mix modeling frequently reveals that one channel is inadvertently subsidizing another's credit 7. Reallocation decisions should follow the marginal contribution curve rather than historical spending patterns.
Finally, production overhead—including lengthy briefing cycles, numerous revision loops, and extensive coordination time—adds significant cost without directly benefiting the reader. These inefficiencies inflate the fully-loaded cost baseline.
Holding headcount flat while raising output quality
The underlying question in ROI discussions is whether content functions can increase throughput and quality without expanding their teams. Research indicates that content marketing effectiveness is driven by contextual factors like strategy fit, content quality, and audience targeting, rather than just spending levels 3. This suggests that improved execution discipline, not increased headcount, is the primary lever.
AI-driven execution platforms with integrated approval workflows directly address this need. They streamline briefing and revision cycles, maintain strategy, production, and publishing within a single governed loop, and provide ranked recommendations based on live pipeline and cost-per-lead signals. While the VP retains editorial judgment at every approval gate, the platform manages the coordination overhead that typically consumes management time and inflates the fully-loaded baseline.
Framed as a Total Economic Impact case, this approach presents a compelling argument to a CFO: quantified productivity gains, a reduced fully-loaded cost baseline, risk mitigation through consistent quality, and the flexibility to adapt the roadmap as pipeline signals evolve 10. Vectoron exemplifies this operating model, offering AI-powered content production that delivers measurable outcomes at a fraction of the cost of traditional agencies.
Presenting the ROI case: presenting the CFO conversation
When engaging with finance, the CFO will already have reviewed marketing spend, headcount plans, and trailing revenue. The key to a successful conversation is strategic sequencing, starting with the fully-loaded cost baseline before discussing ratios, and then layering in different measurement methods to address specific questions.
A four-step approach is effective. First, present the fully-loaded cost baseline, a single denominator derived from internal labor, external spend, tooling, distribution, and management overhead, refreshed quarterly and reconciled with finance's own figures. Second, introduce the financial ratio calculated from this baseline, using the AMA calculator template as a shared reference 9. Third, transition to attribution and mix modeling to address influence questions that the single ratio cannot answer, citing Forrester's position that strategic factors often outweigh pure return on spend 2. Finally, close with a Total Economic Impact framework—detailing benefits, costs, risks, and flexibility—for any multi-quarter investment under consideration 10. By structuring the discussion this way, the VP shifts from defending a single number to negotiating a strategic portfolio.
Frequently Asked Questions
References
- 1.Asking The Right Questions For B2B Marketing ROI - Forrester.
- 2.How To Measure Marketing ROI - Forrester.
- 3.Determinants of content marketing effectiveness: Conceptual framework and empirical findings.
- 4.2024 B2B Marketing Budget Benchmarks: Overview.
- 5.Forrester's Digital Success Benchmark — How Leaders Should Use It.
- 6.2026 CMO Survey | Deloitte US.
- 7.Maximize ROI with Marketing Mix Modeling for Advertising Success.
- 8.“Smart analytics” can tap up to 20% of lost ROI.
- 9.AMA Marketing ROI Calculator.
- 10.Total Economic Impact Methodology.
- 11.The Value Of Building An Economic Business Case With Forrester.