
Key Takeaways
- Underperforming content programs typically suffer from fit, orchestration, and measurement issues upstream of the asset, not from creative quality—so commissioning more content rarely fixes the pipeline gap.
- Plan around buying-group progression across ten or more channels rather than asset slots on a calendar, using segmented benchmarks instead of one industry average to diagnose real gaps 1, 6.
- Retire marketing-sourced pipeline as the headline KPI and replace it with five to seven opportunity-influence indicators tied to CRM records and stage progression 4, 5.
- Reinvest in three or four anchor assets per quarter with AI-driven derivatives, and direct AI spend toward scoring, prioritization, and nurture velocity rather than draft generation 3, 8.
The Conversion Problem Is Rarely a Creative Problem
Most underperforming content programs do not have a writing problem. They have a fit problem, an orchestration problem, and a measurement problem—often all three at once. The symptoms look creative ("our blog isn't converting," "the eBook flopped"), but the diagnosis almost always sits upstream of the asset.
Consider what B2B buyers actually do now. McKinsey's B2B Pulse research, drawn from surveys of thousands of decision makers, finds that buyers expect to engage across ten or more channels, and that one in five is willing to spend between $500,000 and $5 million on a single remote or self-service interaction 1. A content program built around a quarterly gated asset and a nurture sequence is solving for a buying motion that no longer dominates.
The instinct under pipeline pressure is to commission more assets. Forrester's content operations research pushes the opposite way: continuously producing net-new content usually reflects seller desire more than buyer need, and teams produce better business outcomes by planning fewer rich primary assets with many derivatives 3. Volume is not the lever.
The argument that follows treats content marketing conversion as a system question. Where does conversion actually happen in a 10-channel journey? Which benchmarks describe a real gap versus a fake one? Which metrics survive scrutiny from a CFO? Where does AI compress cycle time without adding headcount? Each section maps a specific lever a VP can pull this quarter.
Where Conversion Actually Happens in a 10-Channel Buying Journey
The Omnichannel Reality Most Content Programs Ignore
The arithmetic of a modern B2B purchase has changed faster than most content calendars. McKinsey's B2B Pulse research finds that companies operating across seven or more channels are significantly more likely to grow market share than peers running narrower mixes 1.
That last figure rewrites what "conversion" means at the asset level. A whitepaper download is no longer the load-bearing event in a journey where a procurement lead can move a seven-figure decision through a self-service path. Content's job is to remove friction, answer objections, and validate fit across every one of those touchpoints—not to herd anonymous visitors toward a single form.
Most content programs still operate as if three or four channels carry the load: the blog, the gated eBook, the nurture email, the webinar. The buyer is reading a peer review on G2, watching a recorded customer panel on YouTube, scanning a Slack community thread, comparing pricing on a partner site, then arriving on the corporate site to verify what they already believe. By that point, the form fill is a confirmation event, not a discovery event.
The practical implication for a VP under pipeline pressure is that channel coverage and message consistency now matter more than asset count. A program that publishes thirty blog posts a quarter into two channels produces less buying-group progression than a program that produces ten primary assets and pushes derivatives into ten channels where the buying group already lives.
Mapping Content to Buying-Group Progression, Not Asset Slots
The standard content brief still reads like a slot-filling exercise: one top-of-funnel post per week, one mid-funnel asset per month, one bottom-funnel case study per quarter. That structure assumes a linear funnel and a single buyer. Neither describes the current reality.
Forrester's content guidance frames the work differently. High-performing B2B teams design "program families" that coordinate tactics across reputation, demand, engagement, and enablement objectives, using audience insight and a campaign theme to thread coherent messaging across stages of the buyer's journey and the customer lifecycle 2. The unit of planning is the buying group's progression, not the asset on the calendar.
That reframe changes three operational decisions. The first is who content is written for. A mid-market deal typically involves a champion, an economic buyer, a technical evaluator, and one or two influencers. Each consumes different content, on different channels, with different objections. A single "buyer persona" document does not capture this; a buying-group map does.
The second is what counts as progression. Movement from one stage to the next is signaled by behaviors—return visits, multi-asset consumption, sales engagement requests, peer-review activity—not by a download. Pipeline-360's research on B2B pipeline growth finds that marketers who align content strategies closely with sales stages report stronger pipeline conversion and forecast accuracy, while gaps in nurture and handoff between marketing and sales remain among the most common drags on pipeline coverage 9.
The third is where the program stops. Enablement content—objection handlers, competitive teardowns, ROI calculators sales reps can send mid-cycle—is part of the conversion engine, not a sales asset that lives outside the content plan.
A Diagnostic Grid: Segmented Benchmarks Over a Single Number
Why One Industry Average Hides the Real Gap
The question "what's a good content conversion rate?" is the wrong question. A single industry average flattens the variables that actually determine performance: deal size, traffic source, asset type, and buyer intent. A VP comparing a 1.2% site conversion rate against a 3% "B2B average" can either panic or relax for entirely the wrong reasons.
Segmented benchmarks tell a more useful story. Enterprise B2B websites typically convert in the 0.5–1.5% range, while email traffic can convert near 19% and paid search around 11%, depending on intent and targeting 6. Asset type splits the picture again: gated assets usually convert at 2–5%, while ungated thought-leadership and blog content converts at 0.5–2% because of its top-funnel role 7.
Read together, those ranges produce a diagnostic grid rather than a verdict. An enterprise site converting at 1% with healthy return-visitor behavior and 3–5 content touches per buyer is performing in band 6. The same 1% on a mid-market site dominated by email-nurtured traffic signals a real gap. A gated asset converting at 1.8% is underperforming the 2–5% band and likely has a fit problem—wrong audience, wrong offer, or wrong promise—rather than a creative problem 7. The grid replaces the "are we good?" debate with a specific question: which cell is furthest from band, and why?
Leading Indicators That Predict Pipeline Quality
Conversion rate is a lagging signal. By the time it moves, the program has either fixed something or broken something months earlier. The metrics worth watching weekly are the behavioral ones that predict whether a visit will become an opportunity.
Three indicators carry most of the predictive weight. Repeat-visitor rate measures whether content earns a second look, which matters in B2B buying journeys where decision makers typically consume 3–5 pieces of content before converting on complex purchases 6. Pages per session and multi-asset consumption signal that a visitor is researching, not bouncing. Time between first visit and conversion gives a read on cycle health—when it compresses, fit is improving; when it stretches, the buying group is stuck on an unresolved objection 6.
None of these matter in isolation. They matter because they connect content behavior to CRM reality. A practical measurement frame links a small set of content KPIs to opportunity records, then tests hypotheses about which assets influence stage progression rather than which assets generate downloads 5. The discipline is choosing a tight KPI set—five to seven indicators tied to SMART goals—instead of tracking every metric the analytics platform exposes 5.
For a VP under board pressure, the operational shift is to report on the leading indicators weekly and the conversion rate quarterly. A spike in repeat visits from target-account domains, combined with rising multi-asset consumption, predicts pipeline two quarters out. A flat conversion rate alone predicts nothing.
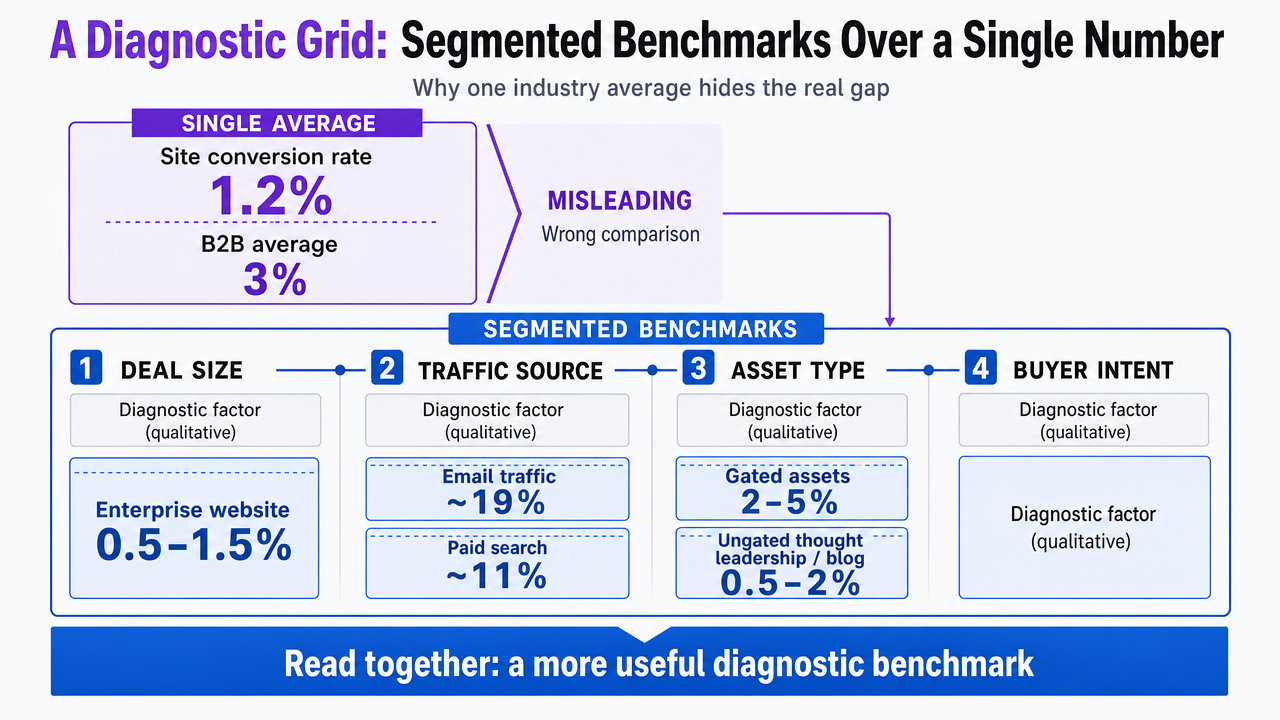 Visualize the segmented B2B conversion benchmark grid cited in the section, giving readers a diagnostic reference matching the prose figures
Experience Data-Driven Content Conversion at Scale
Test real-time content workflows and measure conversion impact directly in your own marketing environment.
Replace Sourcing Metrics With Opportunity Influence
The Case Against Marketing-Sourced Pipeline
Marketing-sourced pipeline is the metric most VPs inherit and most CFOs eventually distrust. It rewards the team for catching first-touch credit on a form fill, then asks that team to defend a pipeline number that ignores the four other people in the buying group who never filled anything out. Forrester's position is direct: sourcing metrics no longer meet the needs of B2B marketing organizations, because they were designed for a single-buyer, single-touch model that has not described enterprise purchasing in years 4.
The practical failure modes are familiar:
- A champion downloads a report, gets tagged as the source, and the deal closes nine months later after seven other stakeholders consumed content the attribution model never saw.
- A renewal expansion gets credited to a webinar registration from a user who was already a customer.
- A self-service buyer worth $750,000 closes through a path the form-based model cannot register at all 1.
The number on the board deck is precise and wrong.
The replacement is opportunity influence measured at the buying-group level. Instead of asking which asset sourced a lead, the question becomes which assets the buying group consumed before an opportunity advanced from one stage to the next, and which assets correlate with stage progression on closed-won deals. That reframe pulls marketing and sales onto the same record—the opportunity—and ends the credit dispute that consumes most quarterly business reviews 4.
A Small KPI Set Tied to CRM Reality
Reporting discipline matters more than dashboard breadth. A measurement guide for content programs recommends defining SMART goals and choosing a small set of KPIs that directly map to those goals, rather than tracking every metric the analytics platform exposes 5. Five to seven indicators, linked to CRM records, beats forty indicators linked to nothing.
A defensible set for a VP under pipeline pressure covers four layers:
- Buying-group layer: number of opportunities with three or more content touches across two or more buying-group members.
- Influence layer: percentage of closed-won opportunities where target content was consumed in the 60 days before stage progression.
- Velocity layer: median days from first content touch to opportunity creation, segmented by target-account tier.
- Asset layer: content pieces that appear in the consumption path of advancing opportunities versus pieces that appear only in stalled or lost ones 5.
The discipline this enforces is editorial, not analytical. Assets that never show up on advancing opportunities get retired or rebuilt, regardless of how much traffic they generate. Assets that appear repeatedly in closed-won paths get more derivatives, more channels, and more refresh investment. Pipeline-360's research on B2B pipeline growth finds that teams who align content strategy closely with sales stages report stronger pipeline conversion and forecast accuracy 9. The KPI set is the mechanism that forces that alignment to happen every week rather than every planning cycle.
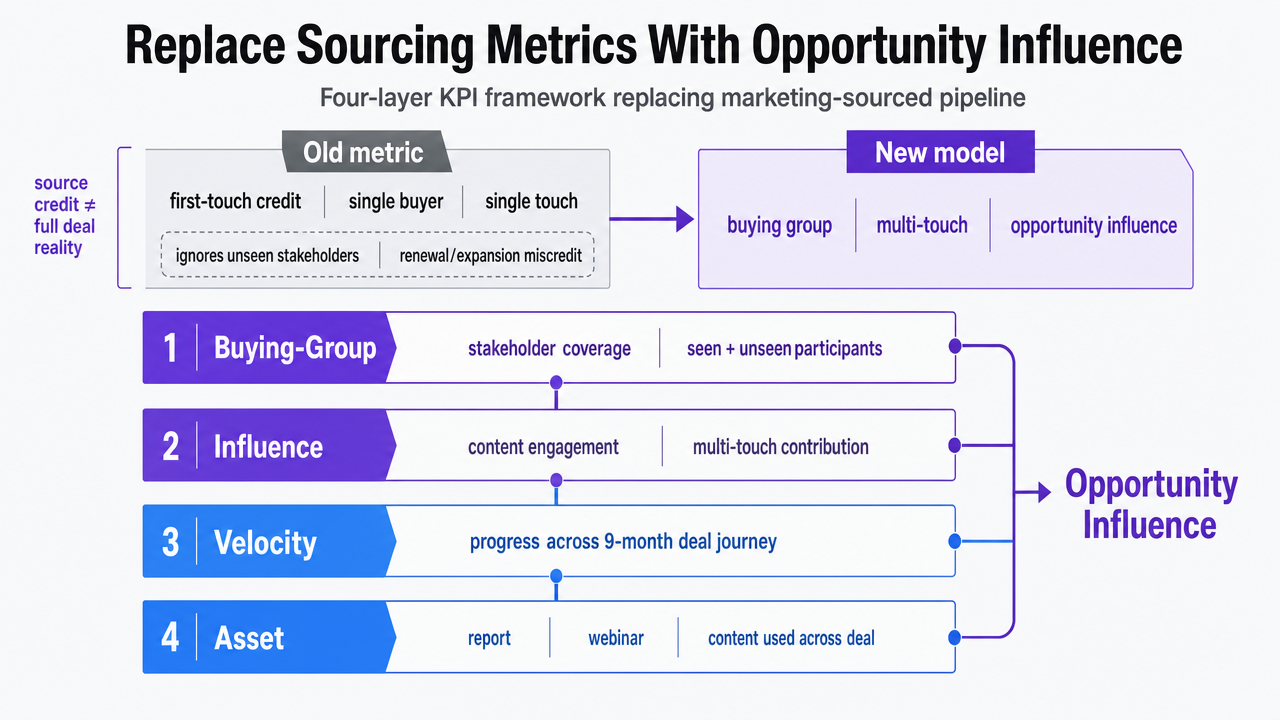 Visualize the four-layer KPI framework described in the section (buying-group, influence, velocity, asset) replacing marketing-sourced pipeline
Production Economics: Fewer, Richer Assets With AI-Driven Derivatives
The default content operating model is asset-volume: a weekly blog cadence, a monthly gated download, a quarterly report, all measured by output rather than influence. It produces a calendar that looks busy and a pipeline that does not move. Forrester's content operations research is blunt on the cause: continuously constructing net-new content usually reflects seller desire more than buyer need, and teams generate better business outcomes by planning a few rich primary assets with many derivatives, using AI and automation for always-on content while measuring only the KPIs that connect to pipeline and revenue 3.
The shift is structural, not cosmetic. In a primary-plus-derivatives model, a quarter's output centers on three or four anchor investments—an original research piece, a customer-validated point-of-view report, a buying-group decision guide, a competitive landscape teardown. Each anchor is sized to earn the buying group's attention on its own merits and engineered for extraction. From one research report, a team produces a methodology blog, a benchmark blog, a webinar, a recorded panel, an interactive calculator, a sales deck, an objection handler, ten LinkedIn posts for the executive team, three sales-rep micro-videos, and a partner co-marketing brief. The anchor does the strategic work; the derivatives do the channel work.
The economics favor the lean team. Sagefrog's 2024 B2B Marketing Mix data shows 72% of B2B companies maintain active blogs and 48% use eBooks, which suggests the format inventory is already broad at most organizations 11. The constraint is not what to produce; it is how to stop producing things that do not influence opportunities. Forrester's guidance pairs the production reframe with a culture reframe: stopping activities that do not contribute to targeted outcomes is harder than starting new ones, and "being 100% busy" producing content is not the goal 3.
AI's role in this model is specific. It is the derivative engine and the always-on layer—turning an anchor asset into channel-shaped variants, drafting refresh updates against performance data, generating localized or persona-specific cuts, and keeping nurture sequences current without a writer touching every send. Human judgment stays on the anchors, the messaging architecture, and the editorial calls about which assets to retire. A four-person content team operating this way produces the channel coverage that a 10-channel buying journey requires 1, without the headcount math that traditional asset-volume models demand.
AI as a Pipeline-Velocity Lever, Not a Content Generator
The first wave of AI adoption in marketing teams optimized for the wrong outcome. Tools were measured by words produced per hour, drafts generated per brief, blog posts shipped per editor. The pipeline number did not move, because the bottleneck was never asset volume. It was scoring, prioritization, and routing—the invisible work that decides which leads sales actually calls and which content reaches which buying-group member at which stage.
The benchmark data tells the more useful story. A 2025 synthesis of AI lead-generation benchmarks, compiled from Salesforce, Gartner, and McKinsey vendor studies rather than a single controlled trial, reports:
- a 73% average increase in qualified lead volume within six months of implementing AI-powered lead generation stacks,
- a 43% improvement in lead-to-opportunity conversion,
- a 68% increase in pipeline velocity attributed to AI-driven lead scoring in Salesforce data, and
- a 31% reduction in sales cycle length in some studies 8.
The figures carry the caveats of vendor-influenced research, but the direction is consistent across sources: AI's measurable impact concentrates on velocity and qualification, not on the act of writing.
The mechanism explains the pattern. AI moves the needle when it scores intent signals across the buying group in near real time, surfaces which opportunities have stalled and which assets correlate with stage progression, drafts the next-best-action for a rep working a $400,000 deal, and keeps nurture sequences tuned to behavior the marketing team would otherwise review monthly. That is orchestration work, not generation work. The same benchmark synthesis frames AI explicitly as an amplifier for existing demand and content programs rather than a standalone tactic 8.
The implication for a VP under headcount constraints is to audit the AI spend against the velocity metrics, not the output metrics. If lead-to-opportunity conversion and median days-to-opportunity are not improving inside two quarters, the AI layer is producing volume the pipeline cannot absorb.
Quantify the Impact of Content Marketing on Pipeline and Conversions
Connect with our team to see how advanced AI-driven execution can streamline your content marketing workflow, directly link efforts to pipeline results, and reduce operational overhead—without increasing headcount.
The Brand-Versus-Demand Budget Tension
The board asks for pipeline this quarter, and the brand budget is the first line item the CFO questions. The instinct is to reallocate everything to demand programs with traceable form fills. The data on executive belief points the other way: 85% of CMOs say investing in brand drives measurable business results, a figure that reflects how senior marketers see brand and demand content as intertwined contributors to pipeline rather than separate cost centers 10.
The split that holds up under pipeline pressure is functional, not philosophical. Brand content earns the buying group's attention on channels where the form does not exist—podcast appearances, peer communities, executive LinkedIn, third-party research citations. Demand content closes the loop on channels where intent is already declared—comparison pages, ROI calculators, decision guides, the late-stage assets sales reps actually send. Both feed the same opportunity record; only one shows up cleanly in last-touch attribution 4.
Cutting brand to fund demand usually compresses the next two quarters of qualified traffic. The defensible move is to hold brand investment steady, measure its contribution through assisted-opportunity influence rather than direct conversion, and concentrate demand spend on the late-stage assets that correlate with stage progression on closed-won deals.
A Reallocation Plan for a Lean Team Under Pipeline Pressure
A VP with three to eight people, two to four vendors, and a board asking for pipeline contribution does not need a new strategy deck. The plan that fits the constraint has four moves, each tied to a specific lever earlier in this article.
- The first move is measurement. Retire marketing-sourced pipeline as a primary KPI and replace it with a five-to-seven indicator set linked to opportunity records: buying-group content touches, influence on stage progression, time-to-opportunity, and the asset-level consumption pattern of advancing deals 4, 5. The dashboard change usually takes a quarter and ends the credit dispute that consumes most QBRs.
- The second move is production. Cut net-new asset volume by 40-60% and reinvest the recovered hours into three or four anchor investments per quarter—an original research piece, a buying-group decision guide, a competitive teardown, a customer-validated POV—each engineered for a dozen derivatives 3. Stop publishing assets that never appear in the consumption path of advancing opportunities.
- The third move is channel coverage. Push derivatives into the seven-plus channels where the buying group already operates, including the peer-review, community, and self-service paths that last-touch attribution does not see 1. Coverage beats cadence.
- The fourth move is AI placement. Spend the AI budget on orchestration—scoring, prioritization, derivative generation, always-on nurture—not on generating more blog drafts the pipeline cannot absorb 8. Audit the AI layer against lead-to-opportunity conversion and median days-to-opportunity inside two quarters. Platforms like Vectoron exist for teams running exactly this playbook without adding headcount.
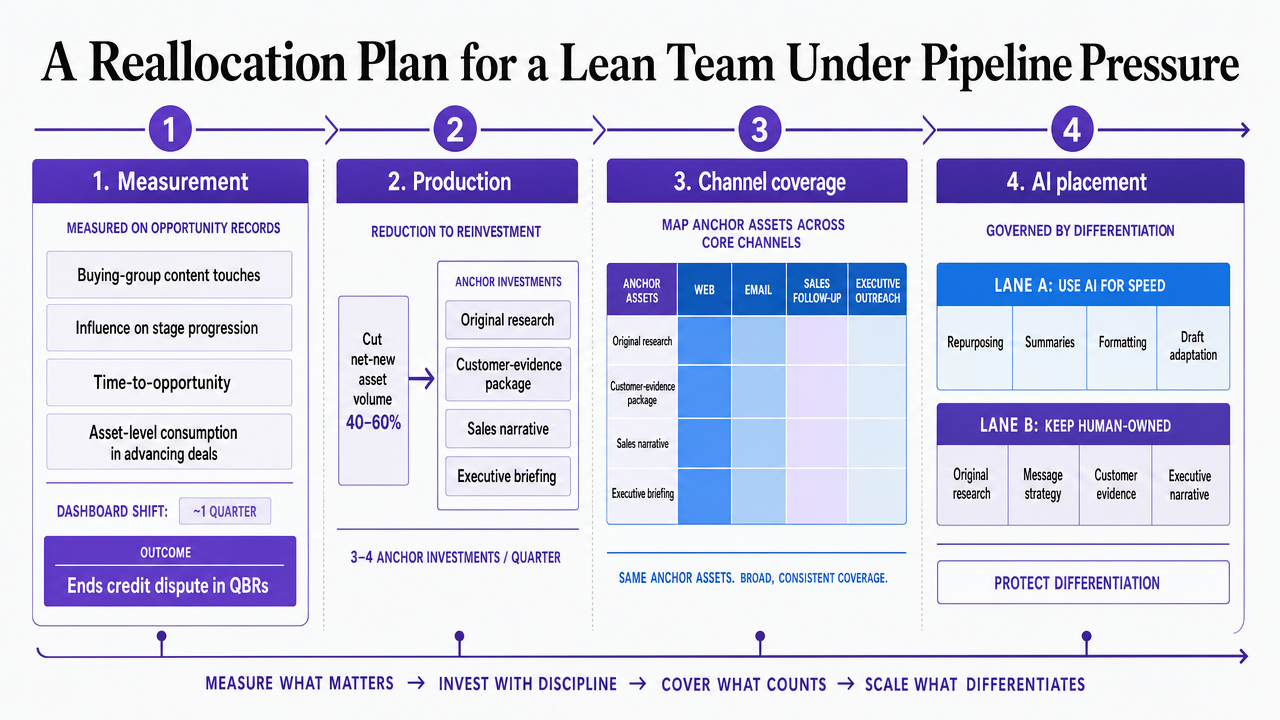 Visualize the four-move operating plan (measurement, production, channel coverage, AI placement) that closes the article
Frequently Asked Questions
References
- 1.The new B2B growth equation.
- 2.The B2B Content Guide: High-Performing Campaigns Succeed Across The Buyer Journey.
- 3.The Definition Of “More From Less” In B2B Content Strategy And Operations.
- 4.B2B Marketers: It's Time To Ditch Sourcing Metrics.
- 5.A Practical Guide to Content Marketing Metrics.
- 6.B2B Conversion Rate Benchmarks 2026: By Deal Size & Channel.
- 7.Content Marketing Benchmarks: What They Are, Why They Matter, and How to Use Them.
- 8.AI Lead Generation Benchmarks 2025.
- 9.The State of B2B Pipeline Growth 2024.
- 10.5 Demand Generation Statistics Every B2B Marketer Should Know.
- 11.9 Proven B2B Marketing Strategies for 2024.