
Key Takeaways
- Treat content goals as a revenue contract co-owned with sales, anchored in opportunity-centric KPIs, reverse-engineered targets, and governed measurement rather than publishing volume or MQL counts.
- Build goals from booked revenue backward using your own historical conversion rates, not borrowed best-in-class benchmarks, which Forrester recommends treating as aspirational ceilings only 7.
- Shift the KPI architecture from leads to demand units and buying groups, measuring marketing-sourced pipeline, opportunity conversion, velocity, customer value, payback, influenced revenue, and retention contribution 3, 8.
- Govern the panel through CMO and CRO sign-off, shared SLAs, and defined triggers for rebenchmarking, so rate degradation or buying-group changes drive reallocation rather than calendar reviews 5, 6.
Content goals as a revenue contract
The strongest content programs treat goals as a contract with the sales organization, focusing on pipeline: opportunities created, opportunities advanced, and revenue recognized. Forrester's lead-to-revenue management model emphasizes processes, goals, and service-level commitments that span the full buyer journey, rather than isolated lead targets 5. Shared revenue goals and consistent metrics are crucial for converting a handoff into a co-owned revenue engine 6.
This contract is anchored by three commitments:
- The KPI set is small and opportunity-centric, reflecting Forrester's shift in the Demand Unit Waterfall toward buying groups and opportunities 8.
- Targets are reverse-engineered from booked revenue using the organization's historical conversion rates, with external benchmarks serving as aspirational ceilings, not planning inputs 7.
- The measurement system is governed: it has an owner, is reviewed regularly, and changes only on defined triggers.
Volume, MQL counts, and reliance on best-in-class benchmarks can undermine this contract. The following sections detail these pitfalls and then outline the goal architecture, KPI panel, and governance loop necessary for a robust planning cycle.
The three habits that quietly break the contract
Volume targets disguised as strategy
Many B2B content planning decks still prioritize publishing quotas, such as assets per quarter or blog posts per month. While volume may suggest productivity, it rarely correlates with pipeline generation.
Forrester's research on B2B content operations suggests that continuous net-new content production often stems from internal pressure rather than buyer demand. They recommend planning a small number of rich primary assets with derivatives instead 2. This guidance also encourages teams to develop and test hypotheses about how specific content influences pipeline and revenue, which is impossible when the goal is merely throughput 2.
Volume targets also contradict Forrester's recommended lifecycle for customer-centric content, where planning, production, promotion, and performance are driven by audience action, not asset count 1. Replacing a goal like "30 blog posts per quarter" with "two primary assets per buying-group priority, each tied to a pipeline hypothesis" makes the contract enforceable.
MQL counts as the primary scoreboard
The MQL (Marketing Qualified Lead) is a coordination artifact, not a revenue outcome. Elevating it to a headline content KPI can inadvertently steer editorial decisions toward gated form-fills, regardless of whether the resulting contacts represent active buying groups.
Forrester's Demand Unit Waterfall shifts the unit of measurement from individual leads to demand units associated with specific opportunities, redefining "buyer" and focusing goals on opportunity creation and advancement 8. More recent planning guidance advises CMOs to move away from net-new lead acquisition and instead focus on opportunity types and their associated buying groups, tracking customer value, profitability, wallet share, and retention 3.
Content goals based on MQL volume tend to inflate easily influenced metrics while neglecting opportunity conversion, pipeline velocity, and revenue contribution. The solution is not to eliminate MQLs but to relegate them from a headline KPI to an operational signal.
Best-in-class benchmarks as planning inputs
Industry benchmark tables frequently appear in content planning documents, often used as target columns. While they may create an illusion of rigor, they rarely reflect the planning organization's actual conversion economics.
Forrester's guidance on benchmarks is clear: marketers should "start with reality" by grounding plans in their own historical Demand Waterfall conversion rates and "be very wary of any broad-based benchmark labeled 'best-in-class'" 7. External numbers should be treated as aspirational ceilings within a reverse waterfall that begins with a revenue target, not as direct inputs for next year's forecast 7.
A content goal tied to a borrowed best-in-class conversion rate is a goal achieved by someone else under potentially unreproducible conditions. Use internal rates to establish the baseline and external rates to identify the potential for improvement.
Reverse-engineering goals from booked revenue
A defensible content goal begins with the income statement and works backward. The planning team, in collaboration with finance and sales, agrees on a booked revenue target. This target is then translated into the upstream activities required to achieve it. Forrester refers to this as a reverse waterfall, emphasizing the use of an organization's own historical conversion rates rather than published benchmarks as mathematical inputs 7.
The process is systematic:
- Start with the revenue target.
- Divide by the average deal value to determine the required closed-won opportunities.
- Apply the historical opportunity-to-close rate to find the necessary qualified opportunities.
- Use the historical engaged-demand-unit-to-opportunity rate to calculate the required engaged buying groups.
- Apply the historical content-engagement-to-engagement rate to determine the necessary content engagements at the asset and channel level.
Each step relies on rates the organization has actually achieved, not borrowed figures.
Forrester's caution regarding benchmarks is particularly relevant here. "Best-in-class" rates are aspirational, not forecast inputs; using them as inputs can lead to unrealistic plans 7. Aspirational numbers belong in a "gap to close" column, not in the "plan" column.
This exercise yields two key outputs:
- A goal hierarchy that the head of sales can easily understand: required opportunities, engaged demand units, and content engagements, each linked to a specific revenue number.
- A list of conversion rates the program commits to maintain or improve. A degradation in any rate triggers reallocation, not merely a quarterly publishing review.
Harvard Business School Online's content strategy guidance supports this sequence: define goals, identify KPIs, benchmark current performance, then track leads, sales, and revenue 4. The reverse waterfall provides the arithmetic foundation for this sequence, preventing KPI selection from being driven by whatever an analytics tool happens to surface.
A critical note on data quality: the historical rates used in the model must align with the opportunity definitions sales uses in the CRM. Discrepancies, such as marketing counting an opportunity at form-fill while sales counts it at stage two, will result in incompatible plans. Reconciling these definitions before calculations begin is a crucial governance act, often revealing disagreements that the KPI set must address.
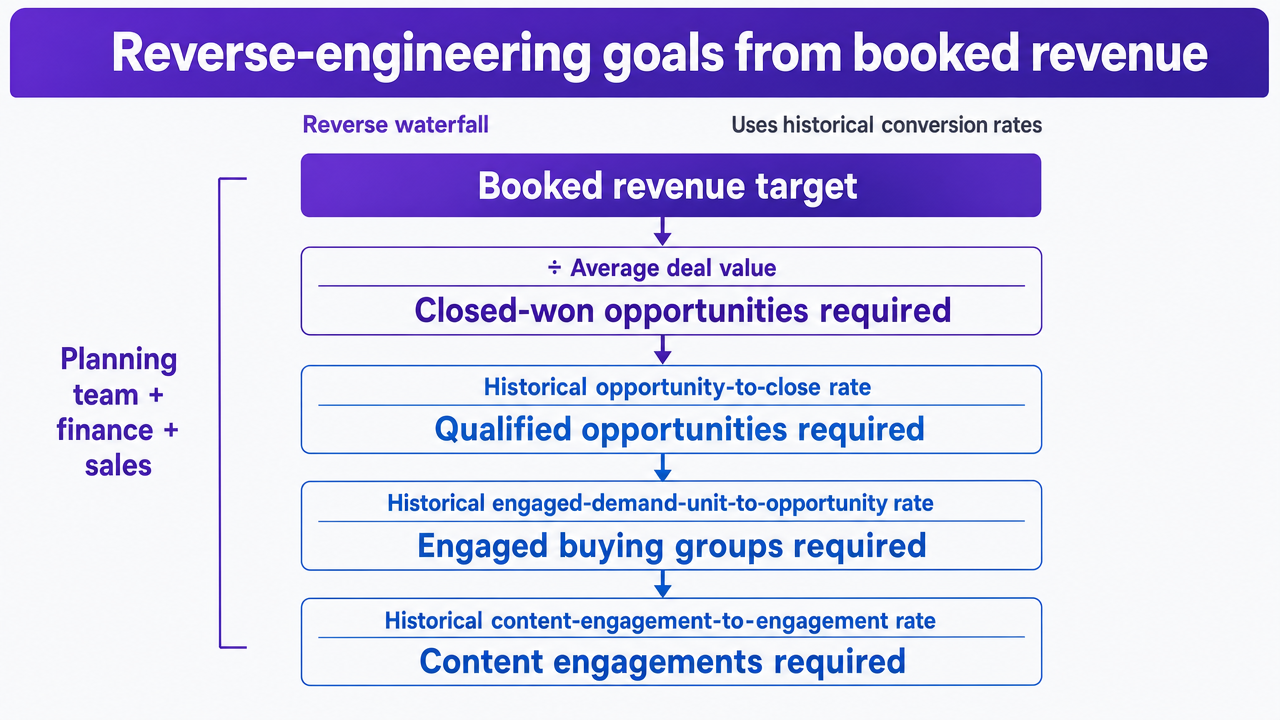 Visualize the reverse waterfall process described step-by-step in this section, showing how booked revenue cascades backward to required content engagements
Test Data-Driven Content Goals in Real Time
Validate your content marketing goals with live publishing and actionable performance insights during your free trial.
From leads to demand units: choosing the right KPI architecture
The chosen KPI architecture dictates what the content program will optimize for. A lead-centric approach prioritizes gated assets, form-fill campaigns, and inquiry volume. An opportunity-centric approach focuses on buying-group coverage, opportunity velocity, and revenue contribution. These two architectures cannot effectively coexist as primary measures without creating conflicting plans.
Forrester's Demand Unit Waterfall shifts the measurement unit from individual leads to demand units linked to specific opportunities, introducing new stages that redefine how organizations perceive a buyer 8. This model considers the buying group, not the individual contact record, as the smallest measurable target. This fundamental change impacts all downstream KPIs: inquiries become engaged demand units, MQLs become qualified opportunities, and SQLs become advancing opportunities tied to forecasted revenue.
The difference is significant:
- A lead-centric panel reports inquiries, MQLs, SQLs, and cost per lead, rewarding top-of-funnel volume.
- An opportunity-centric panel reports engaged buying groups, qualified opportunities, opportunity conversion rate, customer value, and retention contribution, rewarding coverage and progression within targeted accounts.
Forrester's 2023 planning guidance explicitly recommends that high-growth B2B companies move away from net-new lead acquisition. Instead, they should reallocate resources toward specific opportunity types and their associated buying groups, using dashboards that track customer value, profitability, wallet share, and retention 3. Content goals built on this architecture identify the opportunity types they support and the buying-group roles they aim to engage, then measure actual engagement.
Forrester's revenue-stream view extends this logic beyond the sale. By integrating customer lifecycle and revenue contribution into the pipeline, programs can identify where revenue is generated and where it stagnates, rather than viewing the funnel as a simple one-way count 9. Content programs measured this way include goals for post-sale engagement and expansion, not just acquisition.
For the planning cycle, it's crucial to select one architecture and demote the other. A program attempting to give equal weight to both panels will likely default to the lead panel because its numbers move faster and dashboards are easier to populate. The opportunity panel, while taking longer to populate and costing more to instrument, produces the goal set that sales will genuinely defend in a forecast review.
The few measures that matter
A pipeline-grade content dashboard should be concise, fitting on a single screen. Baldrige guidance emphasizes selecting a few important measures, balancing them across financial, operational, customer, and workforce dimensions, and using them to drive decisions 11. NIST's measurement guide similarly insists that measures be tied to goals, use readily obtainable data, and actively direct resources rather than merely describing past activity 10.
Seven KPIs can effectively cover the contract without overwhelming it:
Marketing-sourced pipeline : The dollar value of qualified opportunities where the first measurable touch was a content engagement, measured against the period's revenue target. This is the primary financial measure and should be readily known by the head of sales.
Opportunity conversion rate : The percentage of engaged demand units that convert to qualified opportunities, calculated from the organization's own historical data, not a borrowed best-in-class figure 7. This operational rate indicates whether content is effectively reaching buying groups or just individuals.
Pipeline velocity : The average time from the initial content engagement to a qualified opportunity, and then to a closed-won deal. Velocity highlights stalls that a static conversion rate might obscure and directly aligns with Forrester's revenue-stream view for tracking revenue movement 9.
Customer value : The annualized contract value or lifetime value of customers whose acquisition involved a content touch. This reflects the planning guidance to include customer value, profitability, wallet share, and retention on the executive dashboard 3.
Payback period : The number of months required for marketing-sourced pipeline revenue to cover the content investment for the period. This is a key financial measure for board reviews.
Content-influenced revenue : The dollar value of closed-won deals where content engagement occurred at any point in the buying group's journey, not just as the first touch. This customer-facing measure acknowledges multi-touch reality without overstating sourcing claims.
Retention contribution : Renewal and expansion revenue from accounts engaged by post-sale content. This completes the balanced measurement approach advocated by Baldrige and aligns with Forrester's argument that high-growth programs measure post-sale engagement alongside acquisition 3.
This panel deliberately excludes inquiries, MQL counts, page sessions, and asset-level download totals. While these numbers are useful operational signals for the production team, they should not appear on the executive dashboard. Including them leads to dashboard sprawl, which Baldrige and NIST warn against, and dilutes the contract negotiated with sales 10, 11.
A simple test determines if a measure belongs on the executive panel: if a twenty percent degradation in the rate next quarter would trigger a budget reallocation, then it earns a slot. Otherwise, it belongs in the operational layer.
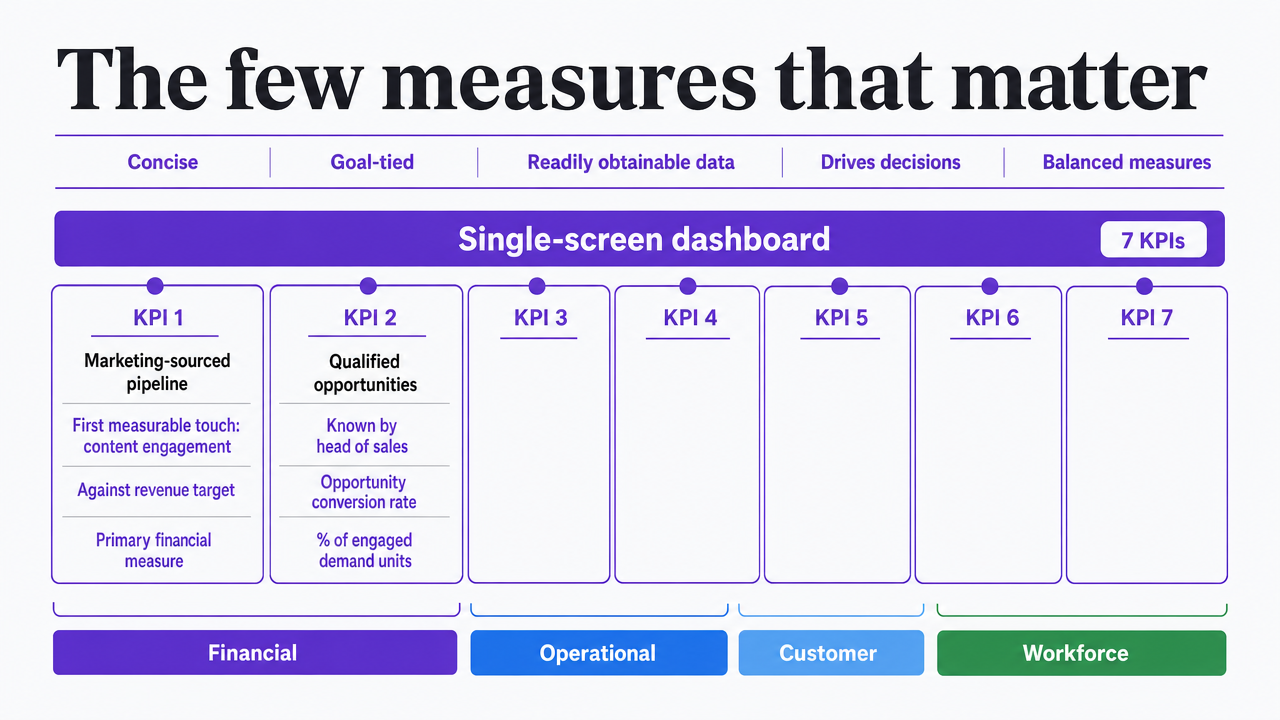 Visualize the seven-KPI executive dashboard panel enumerated in this section, showing the small balanced measure set recommended for the content marketing contract
Governance: who approves the KPI set and when it changes
Shared SLAs across marketing and sales
A KPI set without a co-owner tends to drift. Forrester's lead-to-revenue management model highlights governance as a frequently overlooked layer in content programs, emphasizing defined processes, shared goals, and explicit service-level commitments that span the entire buyer journey 5. These SLAs specify accountability for each rate and the review cadence.
Three commitments should be formally documented:
- Marketing commits to a quarterly volume of engaged buying groups by opportunity type, derived from the reverse waterfall.
- Sales commits to a working window for these engaged groups, measured in days from handoff to the first qualified activity.
- Both commit to a single opportunity definition in the CRM, including the stage at which an opportunity is counted.
Forrester's commentary on L2RM underscores the cultural shift: shared revenue goals, joint planning, and consistent metrics transform a lead-handoff relationship into a co-owned revenue engine 6. The KPI set becomes governable once both functions sign the same document. The CRO and CMO jointly approve the panel at the start of the planning cycle, and the heads of demand and sales operations approve the underlying rate definitions. No metric reaches the executive dashboard without both signatures.
The planning-production-promotion-performance loop
Forrester's customer-centric content framework organizes work into four stages: planning, production, promotion, and performance. Each stage is linked to a measurable buyer action, not an internal milestone 1. Treating these stages as approval gates, rather than just workflow labels, gives the KPI set its effectiveness throughout a quarter.
- Planning approves hypotheses. Each primary asset entering the queue must have a stated pipeline hypothesis: the opportunity type it supports, the buying-group role it addresses, and the expected engagement rate against the reverse-waterfall model 2. Assets without a hypothesis are not produced.
- Production approves the brief based on the planning hypothesis, not a stylistic checklist.
- Promotion approves the channel mix based on the required asset rate, utilizing the consistent metric set Forrester recommends across the lifecycle 1.
- Performance evaluates the outcome: did the engagement rate meet expectations, and if not, what does the variance reveal about the hypothesis?
The loop closes when performance data informs the rate assumptions for the next planning cycle. NIST's measurement guidance emphasizes that measures must direct resources, not merely describe past activity 10. An asset that failed to meet its rate does not automatically get republished; instead, it prompts a hypothesis revision or a decision to discontinue, approved at the same gate that authorized its production.
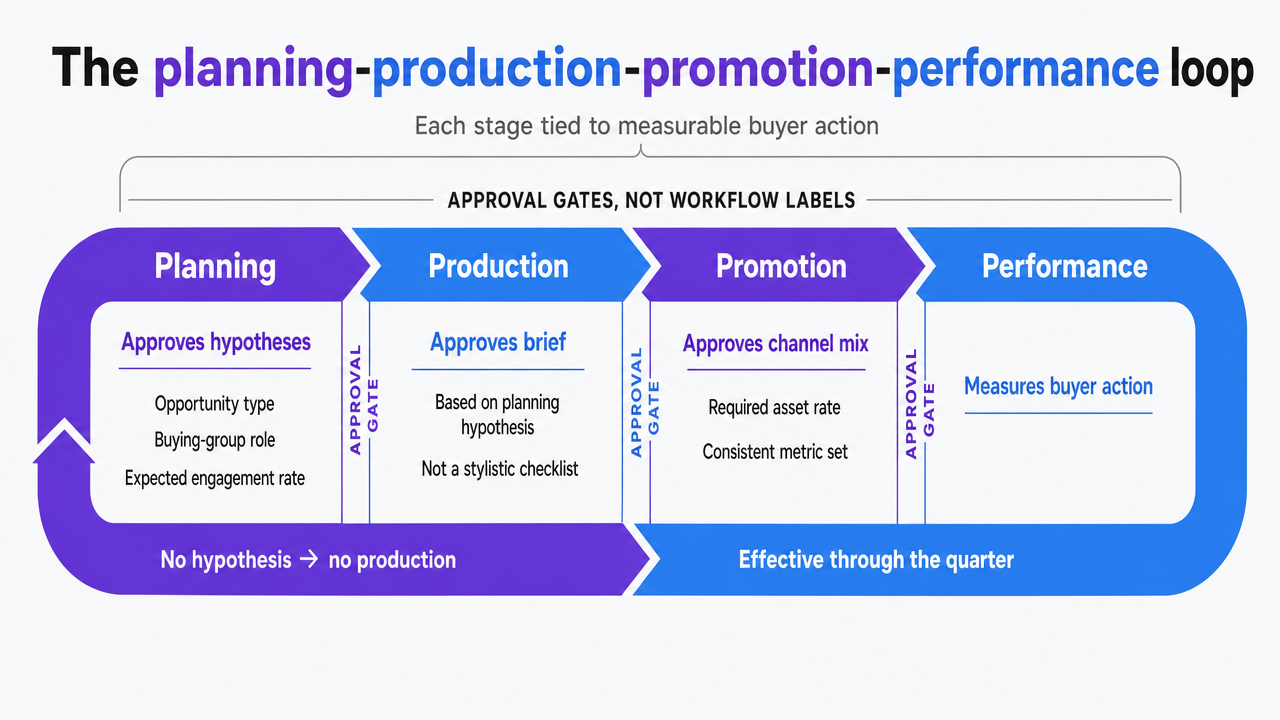 Visualize the four-stage governance loop cited from Forrester's customer-centric content framework, showing approval gates rather than workflow labels
Triggers for rebenchmarking and reallocation
A governed KPI set changes based on triggers, not just calendar dates. Three triggers are typically used throughout the operating year.
The first is rate degradation. If a headline conversion rate drops twenty percent below the reverse-waterfall assumption for two consecutive months, the planning team reopens the model and reallocates budget to address the broken rate, rather than the easiest-to-influence one. The threshold is set in advance to prevent negotiation during reallocation discussions.
The second trigger is a change in buying-group composition. If sales updates opportunity type definitions or named roles within a buying group, the content goal set is rebenchmarked against the new composition. Forrester's planning guidance links dashboards to opportunity types and their surrounding buying groups precisely so that structural changes on the sales side prompt content goal revisions instead of silent drift 3.
The third trigger is annual replanning, during which the reverse waterfall is rebuilt using the prior year's actual rates, and the KPI panel is refined. Baldrige guidance explicitly states that the measure set itself should be reviewed, not just the numbers within it 11. Measures that did not lead to any reallocation decisions during the year are removed from the panel.
See How Unified Content Goals Drive Predictable Pipeline Growth
Request a walkthrough of data-driven content marketing orchestration for agencies and enterprise teams aiming to align strategy, approval, and execution—without expanding your team or increasing vendor complexity.
If a marketing team operates across multiple locations
Why per-location dashboards quietly defeat pipeline goals
This section addresses multi-location service operators, such as dental support organizations, law firm groups, or home services rollups. These entities manage content goals across numerous revenue centers, each with its own intake process, local search footprint, and often, agency relationships.
Per-location dashboards are common in this environment but undermine pipeline goals in three ways:
- They fragment opportunity definitions, leading to inconsistent counting across locations and making a consolidated reverse waterfall impossible to build.
- They incentivize local volume metrics that move quickly, overshadowing the opportunity-centric measures Forrester recommends for executive dashboards 3.
- They hinder L2RM governance, as no single approval gate oversees the full set of rates required for SLAs 5.
A consolidated content goal set necessitates a unified view of the underlying rates.
A consolidation worksheet for content goal economics
The economic question is whether to manage content goals through fragmented per-location agency relationships or a centralized approval workflow that provides a holistic view of all rates. The following worksheet uses variables provided by the operator, plus the fixed post-trial price of the Vectoron platform at $599 per month. No retainer averages or pipeline lift percentages are supplied, as credible figures for these variables are unique to each operator's contracts and CRM.
| Variable | Fragmented per-location model | Centralized approval model |
|---|---|---|
| Locations in scope | L | L |
| Monthly agency retainer per location | R | — |
| Platform cost (post-trial) | — | $599/mo |
| Internal hours per approval cycle, per location | H | H_c (consolidated) |
| Opportunity definitions in use | up to L | 1 |
| Marketing-sourced pipeline contribution rate | P_local | P_central |
| Monthly content goal cost | L × R | $599 + (L × marginal cost) |
Two columns are critical for comparison. The first is the count of opportunity definitions, because a reverse waterfall built from inconsistent definitions cannot be reconciled against booked revenue 7. The second is the internal hours figure, as approval cycles repeated across multiple locations represent a significant cost often overlooked in per-location models. Baldrige guidance stresses that measures must direct resources, not just describe activity 10, 11, and this applies equally to the approval hours supporting those measures. Once L, R, H, and the pipeline contribution rates are populated with the operator's own data, the worksheet provides a defensible cost-per-opportunity figure for each model and a single number the CFO can use.
Putting the contract into the next planning cycle
The contract is formalized during a dedicated planning session. The CMO and CRO, along with the heads of demand and sales operations, agree on the booked revenue target and rebuild the reverse waterfall using the prior year's actual conversion rates, rather than external reports 7. This session establishes the goal hierarchy for the executive dashboard for the next four quarters.
Three key artifacts emerge from this session:
- A signed SLA detailing the volume of engaged buying groups marketing owes by opportunity type and the corresponding working window sales commits to 5, 6.
- A seven-KPI panel, with each measure linked to a goal and a reallocation trigger, excluding any metric that wouldn't prompt budget changes if it missed by twenty percent 10, 11.
- A planning queue of primary assets, each with a pipeline hypothesis targeting a specific buying-group role 2.
From this point, the planning-production-promotion-performance loop operates according to the contract, not a calendar 1. Approval gates replace status meetings, hypotheses replace publishing quotas, and rate variance guides reallocation decisions instead of subjective opinions.
Marketing teams seeking a unified, governed view of their approval workflow and KPI panel often begin by trialing a Command Center designed for this loop. Vectoron offers a two-week trial for VPs ready to integrate this contract into their next quarter's plan.
Frequently Asked Questions
References
- 1.A Guide To Creating Compelling Customer-Centric Content.
- 2.The Definition Of “More From Less” In B2B Content Strategy And Operations.
- 3.Planning Guide 2023: B2B Marketing Executives.
- 4.How to Create a Content Strategy That Drives Results.
- 5.Lead-To-Revenue Management Transforms Tech Marketing.
- 6.Lead-To-Revenue Management Fosters Marketing/Sales Alignment.
- 7.Understanding the Role of Benchmarks in Planning.
- 8.Meet the Newest SiriusDecisions Demand Waterfall!.
- 9.The Revenue Stream: Turning the Sales Pipeline on Its Side.
- 10.NIST SP 800-55r2 initial working draft, Performance Measurement Guide for Information Security.
- 11.Data and Analysis.
- 12.Virtual Conference: Marketing Analytics.