
Key Takeaways
- Content objectives fail when set at the wrong altitude — separate them into business outcomes, journey stages, and production output, each with its own measurement logic and cadence.
- Bind the three altitudes with documented joins: tag every asset to a journey lane, map journey metrics to business outcomes, and mismatch review cadences on purpose.
- Defend budget against paid media by framing content as a fixed-cost asset base and commissioning annual blended measurement, since short-term dashboards understate compounding contribution 18, 9.
- Rewrite the top objective in finance's vocabulary, instrument for privacy-constrained reality with first-party data and modeled conversions, and assign each format to the specialist who can hold quality at cadence 10, 7, 1.
Why Content Objectives Fail at the Wrong Altitude
Most content programs are not cut because the team picked the wrong metric. They are cut because the objectives were set at the wrong altitude — either too tactical to matter to finance, or too abstract to hold anyone accountable. A dashboard full of keyword rankings and pageviews cannot answer a CFO's question about pipeline contribution. A brand-awareness narrative cannot answer a sales leader's question about deal velocity. Both fail the same test: no connective tissue back to revenue.
The peer-reviewed evidence on what actually drives content marketing effectiveness points in one direction. Clarity and commitment in strategy, audience-aligned production, regular performance measurement, and specialization in how work is organized are consistently associated with stronger outcomes 1, 2. What that research does not endorse is the standard template most teams still use — a single tier of objectives that mixes traffic goals with revenue goals and hopes attribution reconciles the gap.
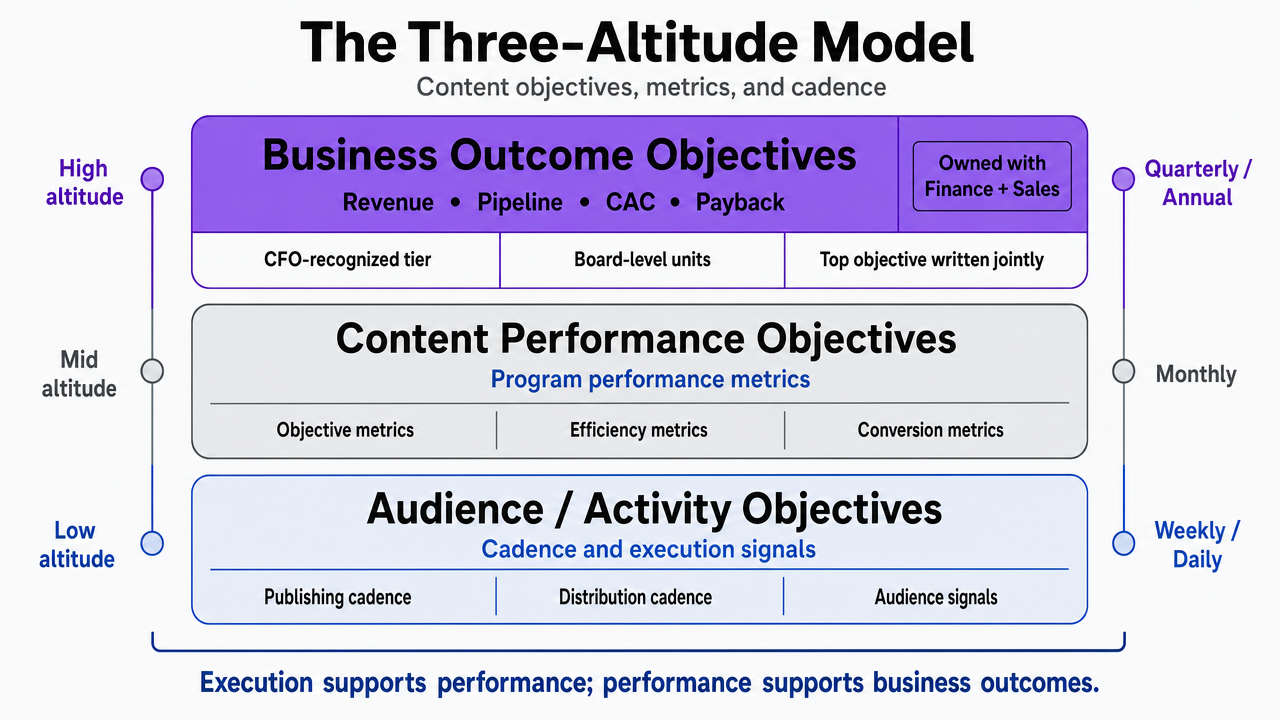
A defensible framework separates objectives into three altitudes and binds them together with measurement. Business outcomes sit at the top: revenue, pipeline, customer acquisition cost. Journey objectives sit in the middle: demand capture, demand creation, retention. Production objectives sit at the base: throughput, quality, coverage. Misalignment between these three is the pattern behind most budget losses, and the rest of this framework treats each altitude as a distinct discipline with its own measurement logic.
The Three-Altitude Model
Business Outcome Objectives: Revenue, Pipeline, CAC
Business outcome objectives are the only tier a CFO recognizes as marketing's contract with the company. They are stated in the same units the board uses: sourced revenue, influenced pipeline, blended and content-attributed customer acquisition cost, and payback period. If a content program cannot express its top objective in one of those units, it will lose budget arguments regardless of how well its middle-funnel metrics move.
BCG's guidance on modern measurement is direct on this point: aligning KPIs across functions is what forges a common definition of success, and it recommends C-suite ownership of that alignment 10. In practice, that means the top objective for a content program is written jointly with finance and sales, not drafted inside the marketing team and circulated for comment. A useful test: if the head of sales cannot repeat the content team's top objective from memory, the objective is not yet at business-outcome altitude.
Three outcome objectives cover most service-business content programs. Sourced revenue captures deals where content was the first identifiable touch. Influenced pipeline captures opportunities where content appeared in the buying group's path, usually measured through a blended attribution model. Content-adjusted CAC compares the fully loaded cost of the program — people, tools, distribution — against the customers it produced or influenced, on a rolling twelve-month basis.
Benchmarks around what these figures should look like are scarce and industry-specific, which is why CMI's measurement guidance recommends establishing internal baselines before comparing externally 17. The first year of a program is usually spent building that baseline honestly.
Journey Objectives: Demand Capture, Demand Creation, Retention
The middle altitude is where most content programs actually live day to day, and it is also where most reporting confusion originates. Journey objectives translate a business outcome into the behavior the audience must exhibit for that outcome to occur. They split cleanly into three lanes.
Demand capture covers audiences already in-market. Its objectives are stated as qualified sessions on high-intent pages, conversion rate on those pages, and the share of branded plus solution-category search that the site owns. These are the metrics closest to pipeline, and they are also the ones most exposed to paid-search cannibalization arguments — which is why they must be reported with channel-of-origin, not as an undifferentiated total.
Demand creation covers audiences not yet in-market. Its objectives measure whether the program is building future pipeline: return visitor growth on educational content, subscriber growth on owned channels, and lift in unaided category recall where the team can afford to measure it. LinkedIn's measurement guidance separates quality attention from quality awareness and quality lift, which is a useful frame for distinguishing engaged reading from mere impressions 19. This lane is the one CFOs most often want to cut, so the objectives here need explicit lag-time expectations attached.
Retention objectives cover existing customers and buyers already in the funnel. Content here targets expansion revenue, product adoption, and reduced churn, and its measurement typically routes through the customer platform rather than the marketing stack. The peer-reviewed evidence on effectiveness treats audience-aligned production and regular measurement as core drivers regardless of stage 1, which argues for consistent measurement discipline across all three lanes rather than heavy instrumentation on capture and thin instrumentation on the other two.
Production Objectives: Throughput, Quality, Coverage
Production objectives sit at the base of the model. They describe what the team can reliably ship, at what standard, across which topics and formats. They are the objectives most likely to be ignored in board reporting and most likely to determine whether the two altitudes above them actually move.
Throughput is stated as assets shipped per period, with the definition of "asset" locked so the number cannot be inflated by counting minor updates. Quality is stated against a rubric the team applies before publish — sourcing standards, subject-matter review, editorial pass — and against post-publish signals such as engaged time, scroll depth, and assisted conversions. Coverage is the map of topics, formats, and journey stages the program is committed to serving, expressed as percentage completion against the plan.
Format mix is where throughput, quality, and coverage collide. CMI's benchmarking of B2B marketers shows short articles and posts, videos, and case studies as the dominant formats in active use 20, and the 2025 B2B benchmarks confirm top teams are shifting format investment toward what actually drives results rather than what is easiest to produce 3. That distribution matters for objective-setting because a coverage plan weighted toward long-form only, or toward video only, will systematically underperform against a mix that mirrors how the audience actually consumes.
The peer-reviewed determinants study frames specialization-enabling processes as a driver of effectiveness 1. In practice, that means production objectives should assign each format to whichever specialist role can hold quality steady at the required cadence, rather than asking generalists to swing between short articles, video scripts, and case studies in the same week.
 Visualize the core framework introduced in this section — the three distinct altitudes of content objectives with their metrics and cadence
Binding the Altitudes: What Connective Tissue Looks Like
Altitudes on their own do not defend a budget. What defends a budget is the chain of evidence that shows how a production objective became a journey objective and how a journey objective became a business outcome. Without that chain, each altitude is measured in isolation and each altitude fails a different stakeholder.
The connective tissue is a small set of joins that any team can maintain. First, every production asset is tagged to the journey lane it serves — capture, creation, or retention — so throughput and coverage numbers roll up into demand-side objectives rather than sitting as isolated publishing counts. Second, every journey-lane metric carries a defined path to a business outcome: qualified sessions map to opportunities through a modeled conversion rate, subscriber growth maps to future pipeline through a lag curve the team publishes and defends, and retention content maps to expansion revenue through the customer platform. Third, the reporting cadence at each altitude is deliberately mismatched — production reviewed weekly, journey reviewed monthly, business outcomes reviewed quarterly — because forcing them onto the same clock produces either noise at the top or negligence at the bottom.
Peer-reviewed evidence supports this discipline: regular performance measurement and data-driven improvement are directly associated with higher content marketing effectiveness 1, 2. BCG frames the same requirement as KPI alignment across functions, with a shared definition of success owned above the marketing team 10. When those joins are documented and re-tested each quarter, the framework survives scrutiny; when they are implicit, the program's contribution becomes an argument rather than a calculation.
Test Content Marketing Objectives With Live Publishing
Experience measurable impact by publishing and tracking real content during your 7-day trial—no commitments required.
Measurement Architecture Under Privacy Constraints
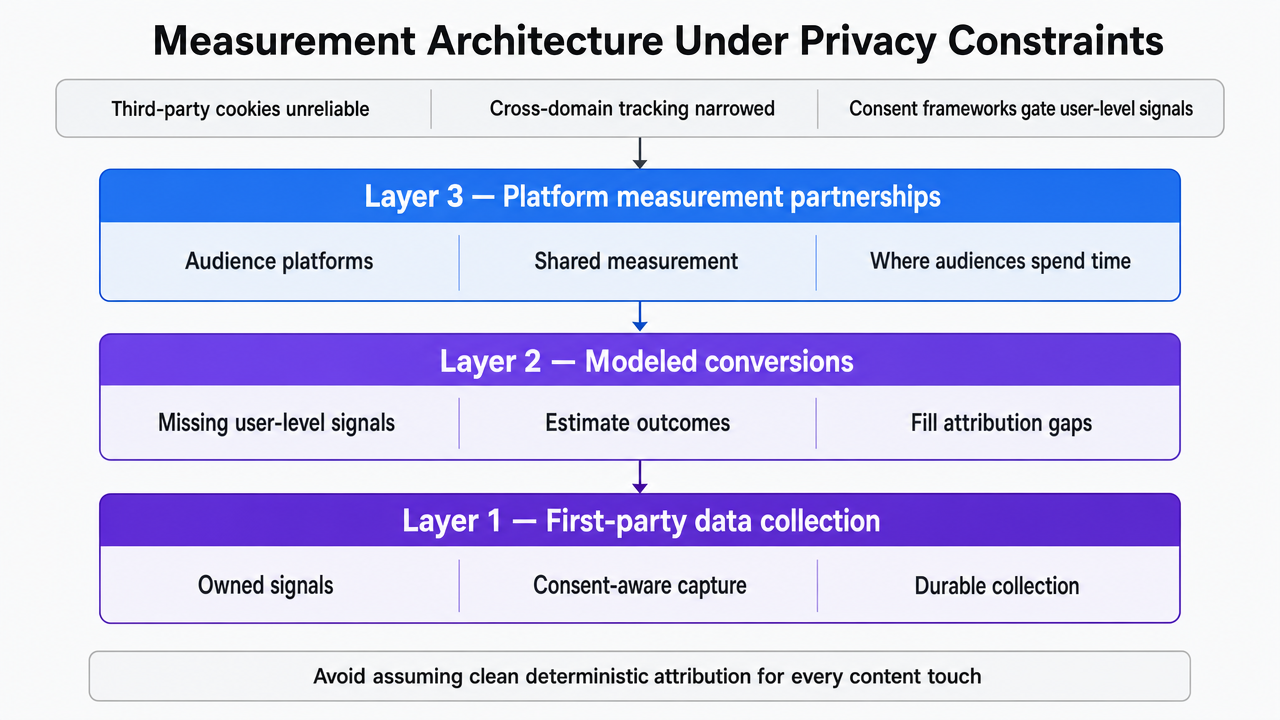
An objective is only as durable as the data pipeline that measures it. Third-party cookies are unreliable, cross-domain tracking has narrowed, and consent frameworks now gate a meaningful share of user-level signals. A framework that assumes clean deterministic attribution for every content touch will report shrinking numbers each quarter, regardless of whether the underlying program is improving.
Google's guidance on privacy-first measurement describes what leading teams are actually doing in response: prioritizing first-party data collection, relying on modeled conversions where user-level signals are missing, and strengthening measurement partnerships with the platforms where the audience spends time 7. That maps to three layers a content program should own before setting its next annual objectives.
The first layer is first-party data collection. Newsletter subscriptions, gated research, account registrations, and logged-in behavior are the events the team fully controls and can retain under its own consent terms. Objectives at the journey altitude — subscriber growth, return-visitor depth, qualified sessions — should be defined against these events, not against ad-platform pixels the team does not own.
The second layer is modeled conversions. Where consent or platform limits break the deterministic path from content view to conversion, modeled conversions fill the gap using probabilistic signals. This is the layer that turns a partial data set into a defensible estimate. Objectives measured here need an explicit confidence band published alongside the number, so the audit trail shows what is observed and what is modeled.
The third layer is unified or blended measurement, which Google describes as a framework that maximizes available data sources to create a single truth 8. Blending methodologies — attribution, incrementality tests, and media mix modeling read together — produces more accurate budget allocation decisions than any single method used in isolation 9. For content, this is the layer where business-outcome objectives get reconciled, because it is the only layer that can compare content's contribution to paid channels on comparable terms.
The peer-reviewed determinants study is clear that regular performance measurement, done as a discipline rather than an event, is directly associated with higher effectiveness 2. The architecture above is what makes that discipline possible in a privacy-constrained environment. Without it, the team ends up defending a program with metrics that were valid three years ago and are now measuring a shrinking slice of reality.
 Depict the three-layer measurement architecture described in the section as a stacked process infographic
Defending Content Budget Against Paid Media
Content programs lose budget arguments to paid media for a specific reason: short-term measurement systematically undercounts what content produces. A paid campaign reports its conversions inside the reporting window. A content asset published in Q1 continues generating organic sessions, assisted conversions, and sales conversations in Q3, Q4, and the following year — and most reporting stacks either never attribute those touches back to the original asset or apply a last-click model that hands the credit to whatever paid channel closed the deal.
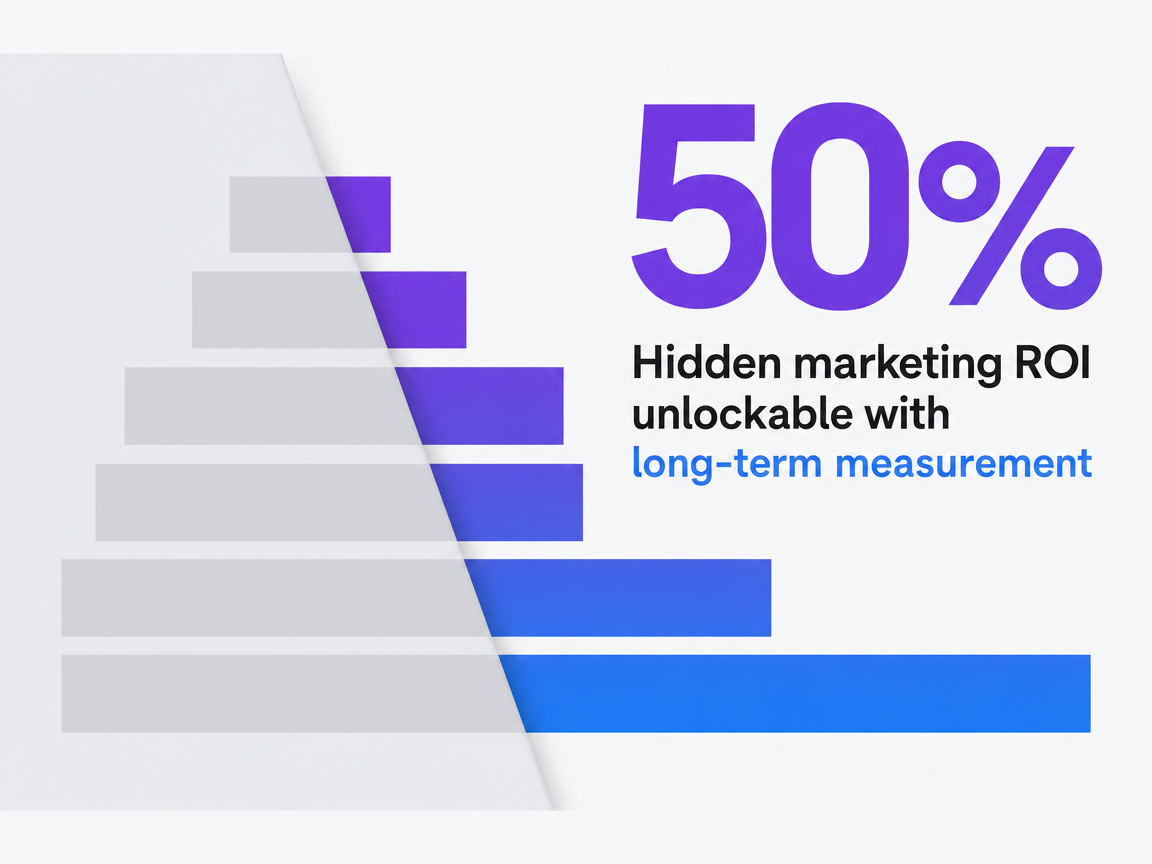
Google's analysis of long-term marketing measurement puts a scale on the gap. It argues that roughly half of marketing ROI sits outside the window that short-term measurement captures, and that methods like media mix modeling are what surface it 18. The scope of that figure matters: it applies to media spend evaluated across brand-building and performance channels using MMM, not to content programs specifically, and the exact share varies by category, sales cycle length, and measurement design. What generalizes is the direction — short-term dashboards understate contribution from anything that compounds, and content compounds harder than most paid formats.
The CFO-facing argument follows from that scope. A quarterly report showing content-attributed conversions is a floor, not a ceiling. Defending the budget requires two additions to the standard deck: a second panel showing organic sessions and assisted conversions on assets older than twelve months, and a media mix or incrementality read commissioned annually so content is compared to paid channels on comparable long-run terms 9. Without those, content will always look like the more expensive per-conversion channel in a monthly review, because monthly reviews are the format paid media was designed to win.
The second argument is structural. Paid media stops producing the moment spend stops. Content assets, once ranked and indexed, continue producing until they are decommissioned or displaced. When the annual budget conversation frames content as a fixed-cost asset base and paid as a variable-cost demand tap, the two stop competing for the same dollar and start being evaluated for what they actually do.
 Hidden marketing ROI unlockable with long-term measurement
Hidden marketing ROI unlockable with long-term measurement
Operating Cadence: Turning Objectives into a Monthly System
A framework that lives in a slide deck is not a framework. It is a document. What turns objectives into a working system is the cadence that governs how they are reviewed, who owns each review, and what decisions each review is authorized to make.
CMI's operational guidance is specific: teams should document goals, priority KPIs, data collection plans, and named responsibility for reporting before they start measuring anything 16. That documentation is what makes cadence possible. Without it, monthly reviews become status meetings; with it, they become decision meetings.
A workable cadence follows the altitude split. Weekly production reviews cover throughput against plan, quality-rubric pass rates, and coverage gaps for the next four weeks. The people in the room are the editors and specialists who can move work. Monthly journey reviews cover demand-capture conversion, demand-creation subscriber and return-visitor trends, and retention content performance read from the customer platform. The people in the room include the demand-generation lead and a sales counterpart. Quarterly business-outcome reviews cover sourced revenue, influenced pipeline, and content-adjusted CAC against the baseline established in year one 17. Finance sits in this review, and the output is a budget decision, not a status update.
Two disciplines make the cadence hold. The first is baselining: every metric enters the system with a documented starting point and a defined method, so later movement is measurable rather than debatable 17. The second is data-driven revision — the peer-reviewed evidence ties regular measurement and continuous improvement directly to higher effectiveness 2, which means each review must produce at least one change to what the team is doing, not just a report on what it did.
See How Leading Brands Operationalize Content Marketing Objectives at Scale
Request a walkthrough of AI-driven frameworks that align content strategy with measurable business objectives—without additional headcount or agency complexity. Benchmark your process against real use cases from top-performing teams.
Named Failure Modes VPs Should Recognize
Four failure modes appear repeatedly when content programs get cut, and each one traces back to an altitude mismatch rather than a bad metric choice.
- Awareness-only reporting. The deck leads with impressions, reach, and social engagement. Finance reads it as marketing describing its own activity, not the company's outcomes. The fix is not to abandon awareness metrics but to demote them below a business-outcome headline that finance recognizes as its own vocabulary 10.
- MQL-only reporting. The opposite failure. Every asset is judged on immediate lead conversion, which starves demand-creation content of runway and produces a portfolio biased toward bottom-funnel pages. The program looks efficient for two quarters and then stalls when the in-market audience is exhausted. The peer-reviewed evidence on effectiveness treats audience-aligned production across stages as a driver of stronger outcomes, not just capture-stage output 1.
- Vanity ranking dashboards. Keyword positions and domain authority scores presented without a modeled path to pipeline. They move independently of revenue, and once a stakeholder notices that disconnect, the entire measurement stack loses credibility. Action-focused metrics — not PR-style awareness numbers — are what CMI's framework guidance recommends in their place 15.
- Attribution absolutism. Insisting on deterministic last-touch credit for every content interaction, then reporting shrinking numbers as consent and cross-domain signals decay. Blended methodologies read together produce more accurate allocation decisions than any single attribution model defended in isolation 9.
If You Manage Multiple Locations: Objectives for Portfolio Operators
This section shifts scope. Readers running a single site can skim ahead; the framework below applies to VPs running content across a portfolio — dental support organizations, behavioral health networks, multi-office law firms, senior living operators, and home services groups where the same program must serve N locations at once.
Portfolio operators inherit a problem single-site teams do not have: every objective at the journey and production altitude has to be resolved twice, once at the network level and once per location. Demand capture is national brand search plus local intent for each market. Demand creation is one editorial voice plus N sets of local proof. Production throughput is one calendar plus a distribution surface that scales with location count. Objectives written only at the network level starve individual markets; objectives written only at the location level fragment the program into work that cannot be measured or defended as a whole.
The peer-reviewed evidence on effectiveness argues for specialization-enabling processes rather than generalist duplication 1. For portfolio operators, that translates into a centralized production model with localized distribution — one team producing category-level assets against a shared quality rubric, with a defined share of localized inserts, provider bios, service-line pages, and market-specific proof layered on top. The alternative — per-location agency retainers producing similar content in parallel — duplicates fixed costs and produces inconsistent quality across the network.
The consolidation math is easier to defend when framed as variables rather than invented figures:
| Variable | Per-Location Model | Centralized + Localized Model |
|---|---|---|
| Content spend | Per-location retainer × N locations | Network production base + localization delta per location |
| Shared vs. localized asset ratio | ~0:100 (each location produces its own) | ~70:30 category assets to local inserts |
| Quality variance across markets | High (vendor-dependent) | Low (single rubric, single editorial pass) |
| Measurement architecture | N disconnected reporting stacks | Single stack, per-location cuts |
Objectives shift accordingly. Business-outcome objectives are set at the network level and cut by location for accountability — sourced revenue, influenced pipeline, and content-adjusted CAC reported per market against a baseline established in year one 17. Journey objectives are dual-tracked: category-level demand creation measured centrally, local demand capture measured per market. Production objectives are stated as centralized throughput plus localization coverage — the share of locations with current service-line pages, provider content, and market-specific proof against plan. When the three altitudes are set this way, the portfolio operates as one program with location-level accountability rather than N programs pretending to share a strategy.
Reallocating Budget from Framework to Practice
A framework earns its keep the first time it changes where money goes. The three-altitude model does that by making misallocation visible: a program overspending on capture-stage assets while starving demand creation shows up as a lopsided coverage plan against a lopsided journey report, and the fix is written into the next quarter's budget rather than argued in a meeting.
Three moves make the reallocation stick. Rewrite the top objective in finance's vocabulary so the quarterly review is a budget conversation, not a status one 10. Instrument the measurement stack for privacy-constrained reality — first-party events, modeled conversions, and a blended read commissioned annually 7, 9. Assign each format and lane to the specialist role that can hold quality steady at cadence, rather than asking generalists to cover everything 1.
Teams pursuing this without adding headcount are the reason platforms like Vectoron exist — coordinating specialist execution against a single approval workflow so the framework operates as a system, not a document.
Frequently Asked Questions
References
- 1.Determinants of content marketing effectiveness: Conceptual framework and empirical findings from a managerial perspective.
- 2.Determinants of content marketing effectiveness.
- 3.B2B Content Marketing: 2025 Benchmarks & Trends.
- 4.B2B Content and Marketing Trends: Insights for 2026.
- 5.Enterprise Content and Marketing Trends: Insights for 2026.
- 6.Enterprise Content Marketing Benchmarks, Budgets, and Trends.
- 7.Privacy-first marketing measurement strategy.
- 8.Unified online marketing measurement.
- 9.Unified Marketing Measurement.
- 10.Six Steps to More Effective Marketing Measurement.
- 11.Marketing and Sales Strategies for Manufacturers.
- 12.Evaluating the Effectiveness of Digital Content Marketing Under Mixed Reality Conditions.
- 13.Influence of short video content on consumers purchase intentions ....
- 14.Beyond the basics: Exploring the impact of social media marketing ....
- 15.5-Step Content Marketing Measurement Framework.
- 16.How to Measure Your Content Marketing Effectiveness.
- 17.How to Measure Content Marketing: The (Updated) Essential Guide.
- 18.Unlock the hidden 50% of your marketing ROI in 2025.
- 19.Measuring and Improving Content Marketing Effectiveness.
- 20.57+ Content Marketing Statistics To Help You Succeed in 2025.