
Key Takeaways
- Build the denominator from fully loaded content cost, including salaries, tooling, reviewers, and amortized evergreen production, so finance cannot challenge a thin cost figure against a generous numerator.
- Use incremental profit rather than gross revenue by applying actual margin and subtracting a counterfactual baseline for revenue that would have closed through referrals, repeat business, or existing demand.
- Make influenced pipeline the primary volume input with a narrow touchpoint definition and a capped influence window, since marketing-sourced pipeline overstates ownership and distorts behavior 8.
- Collapse raw pipeline into stage-weighted expected value using trailing close rates, and apply velocity discounts to aging deals so the numerator becomes a probability-weighted forecast finance already understands 9.
- Align the spend window to the median sales cycle so trailing ROI matches revenue against the cohort that could have influenced it, and report forward ROI separately for budget planning.
- Capture phone-based qualified inquiries through a structured intake layer that tags source, qualification, and CRM match, because service-vertical calculators otherwise miss the highest-intent conversations in the funnel 3.
- Pre-empt CFO objections by documenting the counterfactual baseline method, agreeing a shared-credit framework with sales to prevent double-counting 11, and reporting both trailing and forward ROI with the lag stated.
- Roll up across locations by summing dollars rather than averaging percentages, allocating shared investments on a stated basis, and holding the influenced-pipeline definition identical across units to avoid apples-to-oranges aggregation.
Why most ROI calculators fail the CFO test
Most content marketing ROI calculators collapse under a CFO's first three questions: What baseline are you comparing against? How is incremental profit defined? And why should I trust the pipeline number you're feeding into the numerator? The spreadsheet produces a clean percentage, but the assumptions behind it are either undocumented or indefensible.
Forrester's 2024 survey of B2B marketing leaders found that 64% do not trust their own organization's marketing measurement, and many concede that the metrics they report do not help them make better decisions 3. That figure is self-reported distrust from inside the function, not an external audit. It matters here because the calculators marketing teams are handing to finance are built on the same data those leaders already distrust.
The failure pattern is consistent. Calculators pull gross pipeline rather than incremental profit, ignoring the counterfactual baseline that finance teams apply to every other capital request 1. They treat raw opportunity dollars as if every deal in the funnel were equally likely to close. They lean on marketing-sourced attribution rules that overstate ownership and crowd out sales and product influence 8. And they report a single hero ROI percentage, hiding the assumptions a CFO would otherwise interrogate.
A defensible calculator is not a spreadsheet. It is a governance instrument with named inputs, explicit weights, and assumptions that finance can challenge line by line.
The five inputs that make a calculator defensible
Fully loaded content cost, not media spend
The denominator is where most calculators understate cost and inflate the ratio. Marketing teams pull the line item for freelance writers or an agency retainer, divide it into pipeline, and call the result ROI. Finance reads that and reaches for a red pen.
A fully loaded content cost includes every dollar required to produce, distribute, and maintain the program: in-house salaries with benefits and overhead allocations, contractor and agency fees, editorial tooling, SEO and analytics subscriptions, design and video production, paid distribution attached to organic assets, and the loaded cost of internal reviewers in legal, compliance, or subject-matter expert seats. Sales-enablement collateral built from the same editorial pipeline belongs in the denominator as well.
The AMA's calculator template treats activity cost as a single line and is designed for campaign-level reporting 6. That structure works for a paid placement with a defined flight, but it collapses for content programs where the same asset compounds across quarters. A defensible model amortizes evergreen production cost across its useful life, charges refresh cycles to maintenance, and separates one-time investments from recurring run-rate spend. Anything less hands the CFO an easy challenge: the numerator is generous, the denominator is thin.
Incremental profit instead of gross revenue
The marketing-specific ROI formulation is straightforward: ROI (%) = ((Incremental profit − Marketing cost) / Marketing cost) × 100 1. The hard work is in the word incremental. It forces a comparison between revenue the business earned with the content program in place and revenue it would have earned without it. Gross pipeline does not answer that question.
Two adjustments separate a credible numerator from a vanity one. The first is margin. Pipeline and closed-won revenue must be converted to gross profit using the actual cost of goods or service delivery for those accounts, because a CFO funds marketing out of profit, not top-line bookings. The second is the baseline subtraction. Some share of closed revenue would have arrived through referrals, repeat business, outbound sales, or brand demand that predates the content program. That baseline gets estimated and removed before the ratio is calculated.
Skipping either step produces the kind of hero number finance has learned to discount. A calculator that reports a 480% ROI on gross pipeline and a 95% ROI on incremental profit is not contradicting itself; it is showing the same program through two different lenses, and only one of them survives a budget review.
Influenced pipeline as the primary volume input
The volume input most calculators use is marketing-sourced pipeline, and it is the wrong choice. Forrester's benchmark found that 70% of B2B organizations report marketing-sourced pipeline as a performance metric, making it the default field in nearly every dashboard and ROI template on the market 2. Prevalence is not validity. The same body of research argues sourcing metrics distort behavior and overstate marketing's role by assigning full credit to whichever touchpoint happens to be first or last in the CRM 8.
Influenced pipeline is the more defensible primary input. It counts any opportunity where a content touchpoint appears in the buying committee's documented activity during the deal cycle, weighted by the depth and recency of that engagement. Sourced pipeline becomes a secondary input, useful for spotting which assets create net-new demand, but it stops being the headline number.
Two design choices keep influenced pipeline honest. Define the touchpoint set narrowly: not every pageview qualifies, only meaningful engagements such as gated downloads, multi-page sessions on bottom-funnel assets, webinar attendance, or sales-shared content opens by named buying-committee members. And cap the influence window to the documented sales cycle length, so a touchpoint from three years ago does not inflate this quarter's number. The output is smaller than gross sourced pipeline and considerably more durable under scrutiny.
Stage-weighted opportunity value
Raw pipeline dollars treat a stage-one discovery call and a stage-five contract review as equal claims on future revenue. They are not. A defensible calculator collapses raw pipeline into expected value by applying historical stage-to-close probabilities at each step of the demand waterfall, a framing Forrester has argued for since the model was extended from opportunity creation through revenue realization and expansion 9.
The math is mechanical. For each open opportunity tagged as content-influenced, multiply the deal value by the close rate observed at its current stage over the trailing twelve to twenty-four months. A $1M raw influenced pipeline with the typical distribution of B2B stages, where discovery converts at single digits and late-stage proposals convert above 50%, will commonly collapse to an expected value in the $250K to $400K range. That figure, not the $1M, belongs in the numerator alongside closed-won incremental profit.
Two extensions sharpen the input further. Apply velocity weights so opportunities sitting past their stage's median age get discounted, since aging deals close at lower rates than the headline stage probability suggests. And track marketing influence on stage progression itself, not only on opportunity creation, because content that accelerates a stalled deal contributes value the sourcing view misses entirely 9. The calculator's numerator becomes a probability-weighted forecast, which is the language finance already uses for every other forward-looking number on the books.
Time-lag adjustment for long cycles
Content investment and closed revenue do not share a calendar. An asset published in Q1 may influence a deal that enters pipeline in Q3 and closes in Q2 of the following year. Calculators that divide this quarter's spend by this quarter's revenue produce a ratio that is mechanically wrong and operationally misleading.
The adjustment is a lag function tied to the actual sales cycle length. Pull the trailing median time from first content touch to closed-won by segment or product line, then align the denominator's spend window to the cohort of revenue it could plausibly have influenced. For a nine-month median cycle, Q4 revenue is matched against spend from roughly Q1 through Q3, not Q4 itself.
Two reporting outputs come from this adjustment. The first is a trailing ROI that compares matched cohorts and is suitable for finance reviews. The second is a forward ROI built from stage-weighted expected value, which is suitable for budget planning. Reporting both, with the lag assumption stated explicitly, gives the CFO a number to challenge rather than a black box to dismiss.
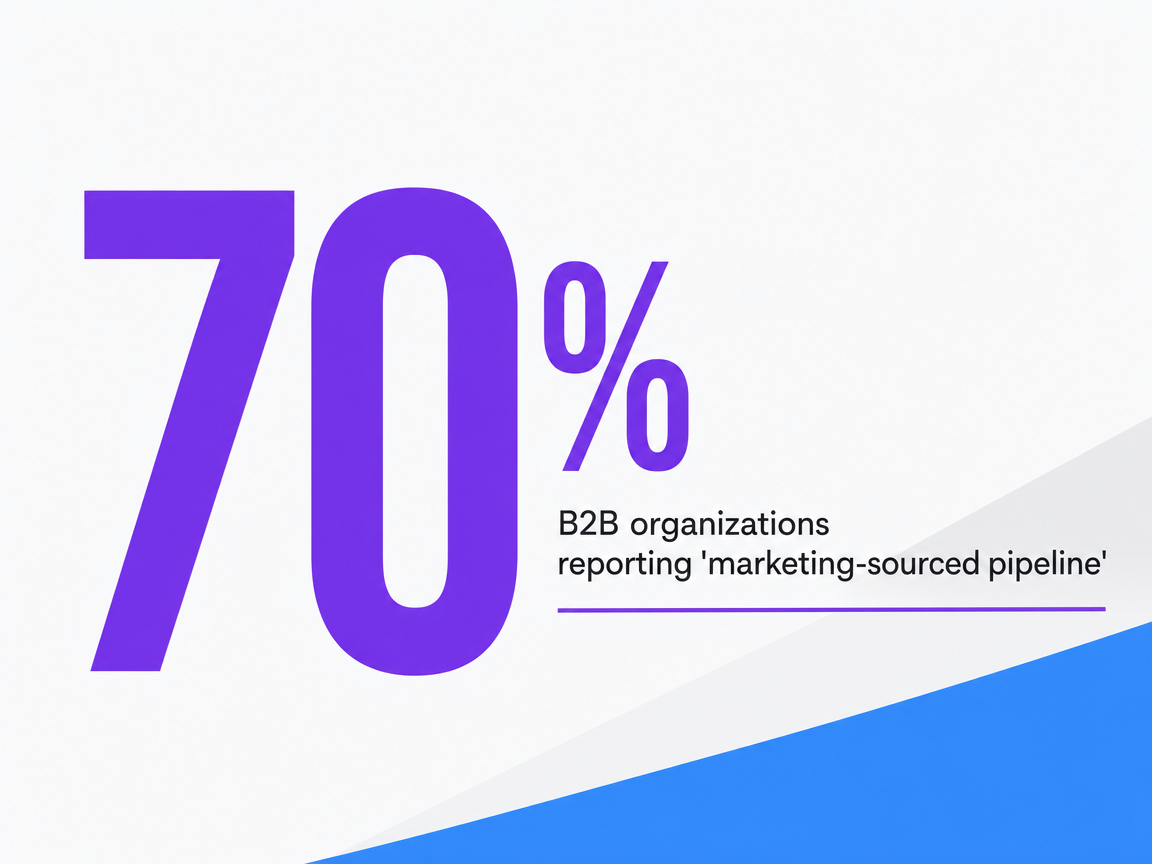 B2B organizations reporting 'marketing-sourced pipeline'
B2B organizations reporting 'marketing-sourced pipeline'
Worked example: $1.2M content spend through the waterfall
Consider a mid-market services company with a fully loaded annual content investment of $1.2M, a nine-month median sales cycle, and a CRM that tags content touchpoints at the opportunity level. The exercise below is illustrative, designed to show the math, not to assert benchmark conversion rates.
Start with the denominator. The $1.2M includes two in-house editors at loaded cost, a fractional SEO lead, freelance writer fees, video production, the analytics stack, and an allocation for the legal reviewer who clears regulated content. Media amplification attached to organic assets is included; paid search budget routed through a separate program is not.
Now the numerator, built from the waterfall rather than asserted. Over the trailing twelve months, the CRM shows $8M in influenced pipeline using the narrow definition from section 2.3: gated downloads, multi-page bottom-funnel sessions, or sales-shared opens by named buying-committee members. Marketing-sourced pipeline, by contrast, totals $3M. The influenced figure is the primary input; the sourced figure is reported as a secondary line.
Apply stage weights to the $8M. If discovery-stage opportunities convert at 8%, evaluation at 22%, proposal at 48%, and contract at 75%, and pipeline is distributed across those stages in a typical front-loaded shape, the expected value collapses to roughly $2.4M. Add $1.8M in closed-won revenue already attributed to content-influenced deals during the matched lag window, then convert both figures to incremental gross profit. Assume a 65% gross margin and a 20% counterfactual baseline subtraction for revenue that would have closed through referrals or repeat business 1. The numerator lands near ($1.8M × 0.65 × 0.80) + ($2.4M × 0.65 × 0.80), or approximately $2.18M in adjusted incremental profit.
The ROI calculation: (($2.18M − $1.2M) / $1.2M) × 100 = 82%. Reported alongside it: a gross-pipeline ratio that would have shown 567%, and the explicit assumptions behind the gap. Forrester's modeled-approach framing supports this dual reporting, since statistical models routinely produce contribution figures lower than naive attribution but more durable in budget conversations 7. The 82% figure is one a CFO can fund against. The 567% figure is one a CFO has learned to ignore.
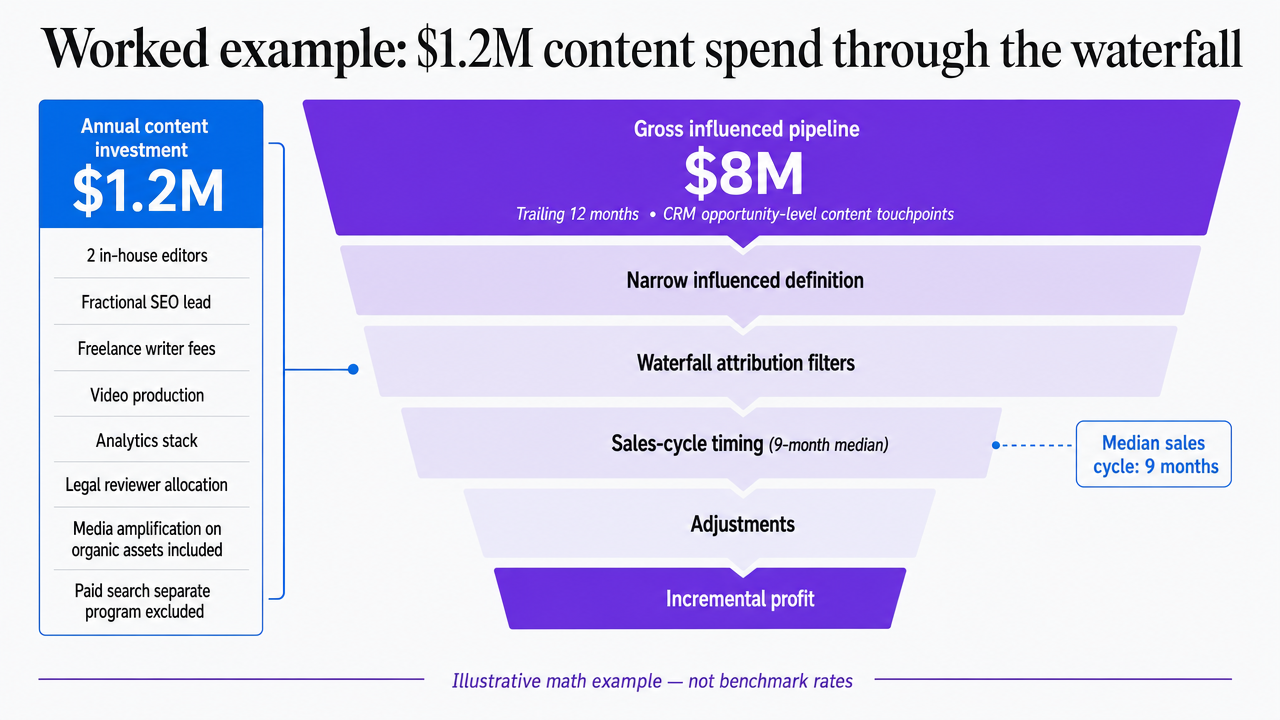 Show how the worked example's pipeline figures collapse from gross influenced pipeline down to adjusted incremental profit, mirroring the math walked through in the section prose
Test content ROI projections with live data
Measure the real pipeline impact of your published content before making a long-term commitment.
The attribution input most calculators miss
Every input discussed so far assumes the buying-committee activity feeding the calculator is actually captured in the CRM. In service verticals, a large share of it is not. Qualified inquiries arrive by phone, and most content ROI calculators have no field for them. The asset that drove the call is invisible to the model, the call itself is invisible to the model, and the closed-won revenue that follows gets attributed to whichever digital touchpoint happened to fire a tracking pixel.
The result is a calculator that systematically underreports content's contribution in any vertical where intake runs through human conversation: legal, behavioral health, dental, home services, senior living, healthcare. A bottom-funnel comparison page can drive a call that closes at six figures, and the calculator records zero influenced pipeline against it. Forrester's measurement work has flagged this category of gap repeatedly, noting that disconnected data sources and weak governance are central to why leaders distrust their own numbers 3. The phone channel is one of the largest disconnects.
Closing the gap requires a structured intake-data layer that captures three things per call: the marketing source or referring asset, a qualification tag applied to the conversation itself, and a deterministic match back to the opportunity if one is created in the CRM. Recorded-call analysis that tags qualified inquiries and flags missed opportunities turns phone intake into a structured input the calculator can read. Without that layer, the influenced-pipeline number in section 2.3 is built on a sample that excludes the highest-intent conversations in the funnel, and the ROI figure carries an error bar finance has every reason to widen.
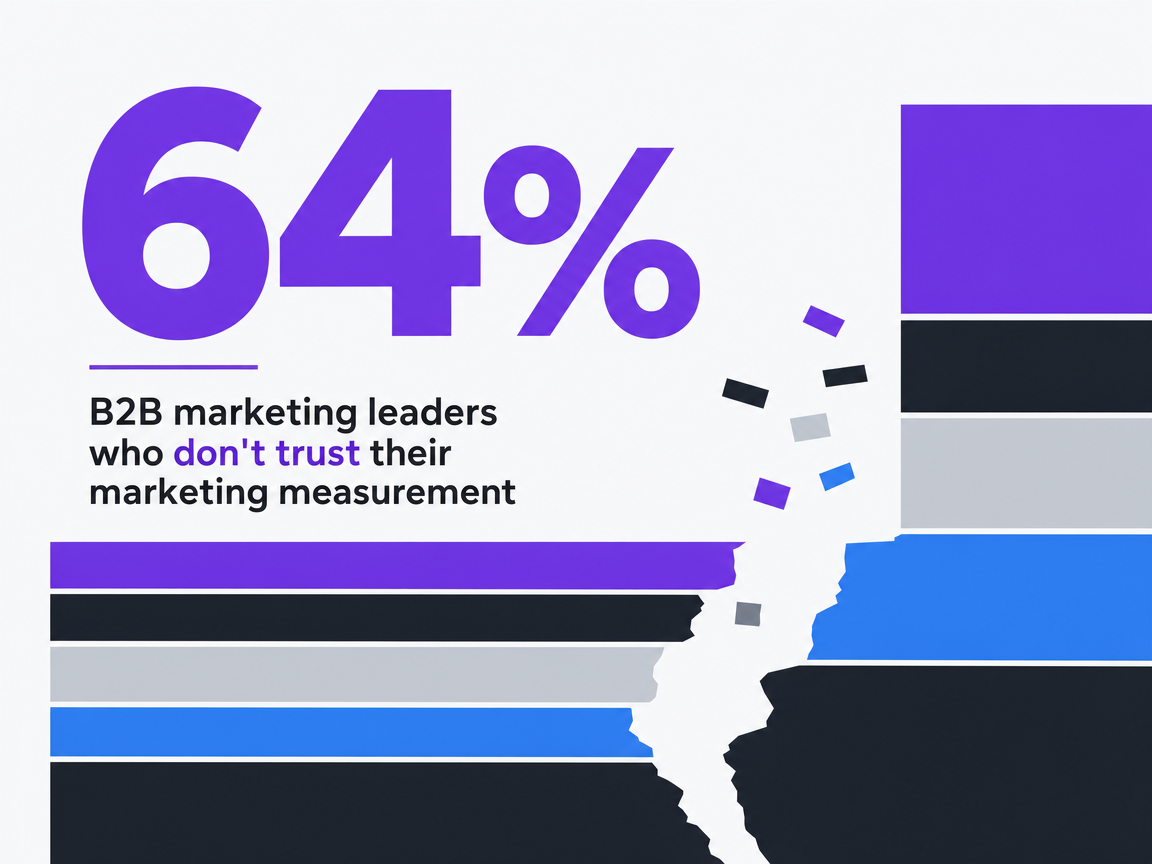 B2B marketing leaders who don't trust their marketing measurement
B2B marketing leaders who don't trust their marketing measurement
Three CFO objections to pre-empt in the model
The counterfactual baseline
The first challenge from finance is almost always the same: how much of this revenue would have closed without the content program at all? A calculator that cannot answer that question is reporting correlation as causation, and a CFO will say so out loud.
Three practical methods produce a defensible baseline:
- A holdout, either geographic or segment-based, where a comparable cohort receives no content investment for a defined window and the revenue delta is measured.
- A pre-program trend line, pulling two to three years of revenue history adjusted for market growth and pricing changes, then comparing actual revenue to the projected baseline.
- A modeled estimate that uses statistical contribution analysis to isolate content's incremental effect from other drivers 7.
State the chosen method in the calculator's assumptions panel, name the percentage being subtracted from the numerator, and let finance argue the figure up or down rather than discovering it was never there.
Double-counting with sales-sourced revenue
The second objection arrives when sales reports a pipeline number that overlaps with marketing's. If both functions claim the same $5M opportunity, the company's combined ROI math is fiction, and the CFO knows it. Forrester has compared per-function ROI claims to attributing a car's performance to its braking system: each component contributes, but ownership cannot be summed 11.
The fix is a shared-credit framework agreed with sales and finance before the calculator ships, not after. Influenced opportunities get tagged with a marketing contribution weight, often expressed as a percentage of deal value, with the remainder credited to sales activity, channel partners, or existing-customer expansion. The calculator reports marketing's weighted contribution, not the full opportunity dollar. The total across functions reconciles to 100% of company revenue, which is the only version of the math finance will accept.
Time-lag between content investment and closed revenue
The third objection targets the calendar mismatch directly. A CFO funding next year's content budget wants to know why this year's spend has not yet produced proportional revenue, and a calculator that divides current spend by current revenue invites the question.
Two outputs answer it. The trailing ROI matches closed revenue against the spend cohort that could have influenced it, using the median cycle length pulled from the CRM. The forward ROI uses stage-weighted expected value from open influenced pipeline as a leading indicator of the return the current spend cohort is on track to produce. Reporting both, with the lag window stated, reframes the conversation from a single-period audit into a cohort review that aligns with how finance already evaluates long-cycle investments. Forrester's measurement work supports this dual lens, noting that dashboards over-indexed on post-sale metrics systematically undervalue pre-sale pipeline contribution 10.
Quantify Content-Driven Pipeline with Advanced ROI Analysis
Connect with experts to see how granular ROI modeling can attribute revenue to content, forecast pipeline impact, and optimize spend—purpose-built for agencies and enterprise marketing teams.
Rolling the model up across multiple locations
For VPs running portfolio operations across a DSO, a multi-state law firm network, a home services franchise, or a senior living operator, the calculator described above has to function at two altitudes at once: defensible at the individual location level and consolidatable at the group level without losing the assumptions that make each location's number credible.
The rollup fails when the group office averages percentages instead of summing dollars. A location with $200K in spend and 120% ROI does not cancel a location with $800K in spend and 40% ROI; the weighted group ROI is closer to 56%. The calculator's group view should report dollar-weighted ROI, with per-location figures shown as a distribution rather than a mean. Forrester's modeled-approach work supports treating contribution as a function of mix rather than a single average across units 7.
Template structure for the consolidation view, with variables in place of invented figures:
| Location | Fully Loaded Content Spend | Influenced Pipeline ($) | Stage-Weighted Value ($) | Closed Incremental Profit ($) | Location ROI % |
|---|---|---|---|---|---|
| Location A | $A_cost | $A_influenced | $A_weighted | $A_profit | ((A_profit − A_cost) / A_cost) × 100 |
| Location B | $B_cost | $B_influenced | $B_weighted | $B_profit | ((B_profit − B_cost) / B_cost) × 100 |
| Location N | $N_cost | $N_influenced | $N_weighted | $N_profit | ((N_profit − N_cost) / N_cost) × 100 |
| Group | Σ cost | Σ influenced | Σ weighted | Σ profit | ((Σ profit − Σ cost) / Σ cost) × 100 |
Two governance rules keep the rollup honest. Shared content investments, such as a national editorial team or a corporate SEO program, get allocated to locations on a defensible basis (revenue share, qualified inquiry share, or buying-population share) and that allocation rule is stated in the assumptions panel, not buried in a tab. And the influenced-pipeline definition stays identical across locations, because allowing local variance turns the group ROI into an apples-to-oranges aggregation finance will discount immediately.
Reporting the output without producing a hero number
The temptation at the end of every quarterly review is to hand the CFO a single ROI percentage. Resist it. A calculator built on the inputs above produces a range of defensible figures, and reporting them as a range is what separates a governance instrument from a marketing claim.
A credible output panel carries four numbers, not one:
- Trailing ROI on incremental profit
- Forward ROI on stage-weighted expected value
- Gross-pipeline ratio shown for transparency
- Counterfactual baseline percentage being subtracted
Each is accompanied by the assumption that drives it, including the influence-window definition, the margin applied, the lag period, and the credit-share agreement with sales. Deloitte's CMO Survey work points to disciplined experimentation and analytics maturity as the wedge between functions that defend their budgets and those that absorb cuts 5. A multi-number output is how that discipline shows up in the room.
The reporting cadence matters as much as the format. Refresh the inputs quarterly, restate the assumptions in writing each time, and flag any change in methodology before the number moves. The calculator stops being a hero metric and starts functioning as a shared model finance can audit, challenge, and ultimately fund against.
Frequently Asked Questions
References
- 1.What is ROI and how do you calculate return on investment?.
- 2.Marketing Pipeline Metrics: Restoring Balance.
- 3.B2B Marketing Leaders Don't Trust Their Measurement - Forrester.
- 4.Content Writing For Real Estate.
- 5.2026 CMO Survey | Deloitte US.
- 6.AMA Marketing ROI Calculator.
- 7.A Modeled Approach to Marketing's Contribution.
- 8.B2B Marketers: It's Time To Ditch Sourcing Metrics.
- 9.The Revenue Stream: Turning the Sales Pipeline on Its Side.
- 10.The State of B2B Marketing Measurement In 2023: Five Key Observations.
- 11.A Truth About Marketing ROI.