
Key Takeaways
- The 2025 content ROI conversation has split between counting outputs and measuring pipeline impact, with credible benchmarks living almost entirely on the outcomes side.
- Forrester's 8 percent of revenue benchmark for B2B marketing spend sets the envelope, and content wins share through reallocation rather than incremental asks 13, 7.
- Personalization executed as an operating discipline delivers 10 to 30 percent marketing ROI lift and 5 to 15 percent revenue lift, contingent on data and workflow maturity 2.
- Leader-tier personalization programs generate roughly 1.4 times the revenue of average performers, a 40 percent gap driven by execution capability rather than budget size 3.
- Any personalization ROI claim needs three caveats: execution quality, incrementality-based measurement, and category context, or it will not survive CFO audit 2, 1, 14.
- Forrester's cross-region ABM data shows account-based programs most commonly deliver 21 to 50 percent higher ROI than non-ABM equivalents, contingent on real targeting discipline 6.
- Mature measurement stacks govern with consumption and incrementality data and demote output counts to operational hygiene, which is what preserves content budgets under review 4, 1.
- Forrester argues against per-function revenue attribution, comparing it to assigning revenue to a car's brakes, and favors goal-based measurement for top-of-funnel content 5.
- The 2025 mandate is to do better with less, meaning content programs are judged on cost per outcome rather than volume held flat against shrinking budgets 10.
- For multi-location operators, agency retainers and in-house headcount scale linearly with location count while AI-assisted execution largely does not, shifting the reallocation math 7, 11.
- High-ROI programs share four traits: consumption-based governance, account-concentrated production, personalization as discipline, and redesigned workflows rather than tooling layered on legacy handoffs 4, 6, 3, 11.
What the 2025 numbers actually say about content ROI
The 2025 content marketing ROI discussion has quietly split into two tracks. One track keeps counting assets produced, blog posts published, and impressions served. The other track measures what those assets actually move: pipeline, acquisition cost, and revenue lift per segment. The gap between those two tracks is where most of the current benchmark data lives.
Three signals define the year. Personalization, when executed with real data discipline, is delivering marketing ROI lifts in the 10 to 30 percent range and revenue lifts of 5 to 15 percent on average, based on McKinsey's cross-industry work 2. Account-based programs are reporting 21 to 50 percent higher ROI than non-ABM equivalents, with a meaningful minority pushing far beyond that band 6. And Forrester's content intelligence framing is pulling measurement away from output counts toward consumption and incrementality data 4.
The subtext across every credible 2025 source is a mandate to do better with less rather than simply produce more 10. That reframes the ROI question for in-house marketing leaders. The number that matters is not how much content shipped last quarter. It is what percentage of shipped content demonstrably moved a measured outcome, and at what fully loaded cost per unit of that outcome.
Budget context: where content sits in the 2025 B2B marketing wallet
Before any ROI benchmark carries weight in a board discussion, the total marketing spend it sits inside has to be established. Forrester's public budget benchmark puts the average B2B firm at 8 percent of annual revenue invested in marketing, though that headline number hides wide variation by company size, growth stage, and category 13. A $50M ARR software company running at 8 percent is spending in a different universe than a $500M professional services firm at the same ratio, and the composition of what that 8 percent buys is where the 2025 shift becomes visible.
Forrester's 2025 B2B Marketing Budget Benchmarks report documents a reallocation pattern that matters for anyone defending a content line item. Many B2B firms are pulling budget away from less measurable programs and pushing it into digital self-serve journeys, content, and account-based work, on the logic that more than half of large B2B purchases will move through digital self-serve channels 7. The reallocation is not primarily a cost-cutting story. It is a measurability story. Programs that produce trackable consumption and pipeline signals are winning share against programs that do not.
For a VP defending or expanding a content budget, three data points anchor the conversation. First, the 8 percent baseline sets the ceiling from which content competes for allocation against demand generation, brand, events, and martech 13. Second, the direction of 2025 movement favors digital and content-heavy programs, which strengthens the case for shifting dollars out of field or brand line items that cannot produce comparable measurement traces 7. Third, average budget numbers should never be quoted without the caveat that they compress a wide distribution; a growth-stage firm at 12 percent of revenue and a mature firm at 4 percent are both statistically ordinary.
The practical implication for a mid-market marketing organization is straightforward. Content ROI arguments land harder when they are framed as reallocation math against the 8 percent envelope, not as incremental spend requests on top of it.
Personalization: the highest-confidence ROI lever in the 2025 dataset
The 10-30% marketing ROI lift and what McKinsey actually measured
The most-cited personalization number in circulation right now comes from McKinsey's explainer on the subject: good personalization can lift marketing ROI by 10 to 30 percent, lift revenues by 5 to 15 percent, and reduce customer acquisition costs by up to 50 percent 2. Those three ranges do a lot of work in 2025 board decks, so the composition of the underlying claim matters more than the headline.
McKinsey's framing rests on cross-industry work with companies that have real data infrastructure, decisioning capability, and content distribution feeding tailored experiences at scale. The ROI lift is not a single-campaign result and it is not an average across all marketers who ship a personalized email. It is the observed performance range for organizations executing personalization as an operating discipline, with the analytics foundation and agile team structure required to support it 2.
Two implications follow for a VP citing these numbers. First, the ranges are cumulative program-level effects rather than lift on any single asset, which is why quoting the top end without the underlying operating model overstates what most teams can replicate in year one. Second, the ROI figure and the revenue figure are not additive; they describe different measurement lenses on the same underlying gain. A defensible board framing sounds like this: mature personalization programs typically deliver mid-single to low-double-digit revenue lift, meaningful acquisition cost reduction, and 10 to 30 percent higher marketing ROI on the spend directly tied to personalized experiences 2. The upper end of each range is achievable but assumes the data, workflow, and measurement discipline are already in place.
Leaders vs. average: the 40% revenue gap
The more useful benchmark for reallocation arguments is not the ROI range itself. It is the gap between companies that treat personalization as a core capability and those that treat it as a campaign tactic. McKinsey's report on the value of getting personalization right or wrong finds that companies excelling at personalization generate roughly 1.4 times the revenue from those activities compared to average performers, a 40 percent delta 3.
That gap is the number that changes budget conversations. When the CFO asks why the content and personalization line should hold or grow while other programs get cut, the defensible answer is that leader-tier execution produces 40 percent more revenue from the same category of spend than average execution 3. The variance is not driven by budget size. It is driven by measurement discipline, testing cadence, and the quality of the data feeding decisioning.
The same McKinsey work reports that personalization most commonly drives a 10 to 15 percent revenue lift, with company-specific results spanning 5 to 25 percent depending on sector and execution quality 3. Read together, the two numbers tell a coherent story: the median outcome is solid, the leader outcome is materially better, and the difference is capability rather than category. For a VP building a 2025 case, the leaders-versus-average frame is stronger than the point estimate because it puts the strategic question where it belongs, on execution model rather than spend level.
The scope caveats every VP should cite alongside these numbers
Three caveats belong next to any personalization statistic used in a board setting. McKinsey's own guidance is direct: the reported gains depend on execution quality, and poor personalization can erode trust and performance rather than improve it 2. The upside range assumes governance, not just tooling.
The second caveat is measurement rigor. McKinsey's work on advanced personalization stresses that validating ROI requires incrementality testing and standardized performance metrics, not before-and-after comparisons or last-touch attribution 1. A 10 to 30 percent ROI claim without an incrementality method behind it is a marketing narrative, not a defensible number.
The third caveat is category. One frequently recycled personalization statistic, the Epsilon finding that 80 percent of consumers are more likely to purchase from brands offering personalized experiences, comes from consumer retail context and should be flagged as such when used in a B2B setting 14. It is directionally useful but not a B2B benchmark.
Cited with those three qualifiers, personalization ROI numbers hold up under CFO scrutiny. Cited without them, they invite the exact skepticism that has hollowed out content budgets at firms where prior claims did not survive audit.
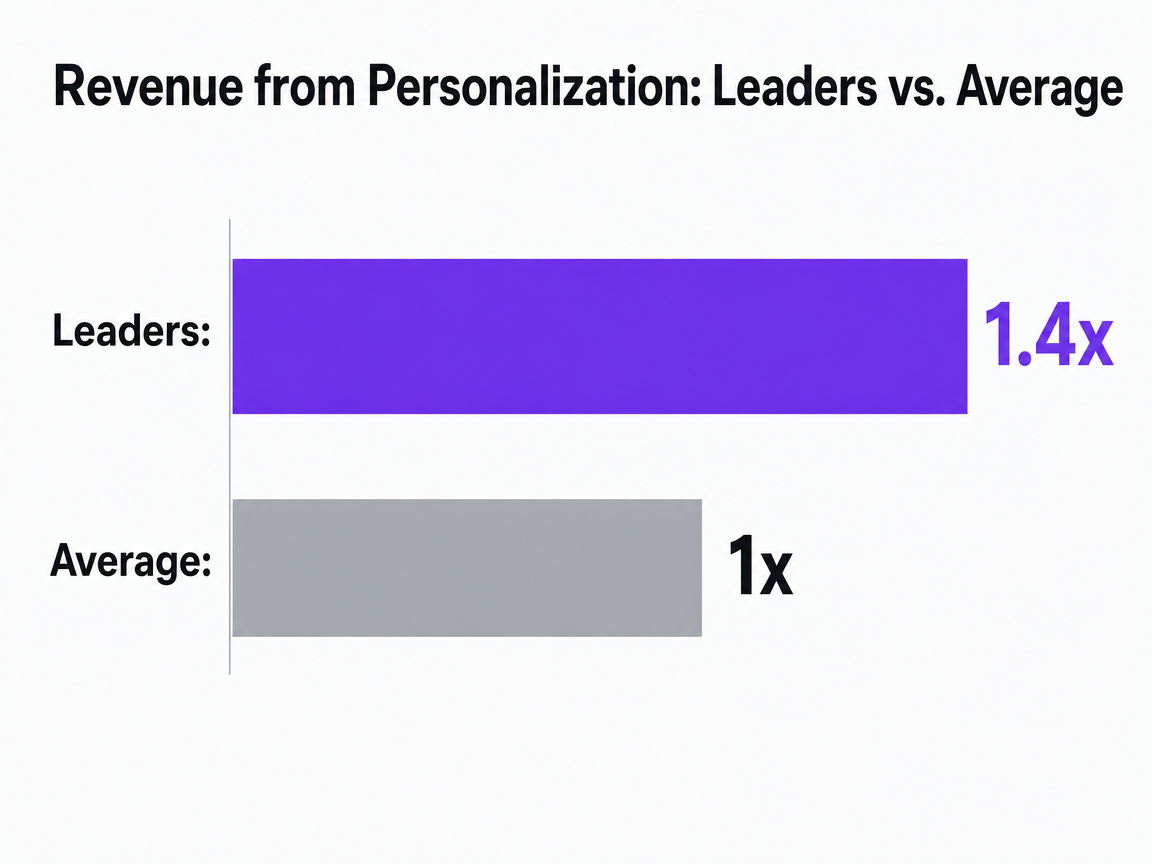 Revenue from Personalization: Leaders vs. Average
Companies that excel at personalization generate 40% more revenue from those activities compared to average players.
Test Real Content Marketing ROI Benchmarks Today
Benchmark your content performance using live publishing and see measurable impact within your seven-day trial.
Targeting discipline: ABM ROI benchmarks from Forrester
The strongest ROI signal in the 2025 dataset that is not about personalization comes from targeting discipline. Forrester's cross-region survey of ABM decision-makers found that account-based programs most commonly deliver 21 to 50 percent higher ROI than non-ABM marketing, and nearly a quarter of respondents reported ROI 51 to 200 percent higher than non-ABM equivalents 6. The distribution matters more than the midpoint, because a single average would flatten a result that is actually bimodal in the tail.
Two features of the Forrester data give it unusual weight in a board conversation. It is survey-based rather than modeled, drawn directly from marketers running ABM programs, and it holds up across North America, Europe, and Asia Pacific rather than reflecting a single-region artifact 6. For a VP arguing that concentrated content investment against a defined account list outperforms broad-based demand generation, that geographic consistency is the defense against the objection that ABM only works in specific markets.
The caveat sits inside the same source. Forrester's data reflects programs actually executing ABM as a discipline, not campaigns that repurpose broad content and call it account-based 6. The ROI premium is contingent on real target-account selection, content built for those accounts, and measurement tied to account engagement and pipeline rather than aggregate impressions. Programs labeled ABM but run without those inputs should not expect the same distribution.
The strategic read for content leaders is that the ABM ROI premium is really a targeting premium expressed through content. The same asset produced against a defined account list, with distribution and measurement built around that list, outperforms the same asset produced against a generic buyer persona. That reframes a content prioritization question most teams are already asking. Rather than debating whether to publish more or fewer assets, the higher-leverage question is what share of content production is aimed at named accounts with tracked engagement, and what share is aimed at aggregate audiences with no account-level signal returning to the pipeline model.
Measurement maturity: content intelligence over output counts
From assets-produced to consumption and incrementality
The measurement question that separates 2025 content leaders from 2020-era operators is not what got published but what got consumed and what that consumption changed. Forrester's content intelligence framing defines the discipline as the capture, correlation, and analysis of data about content and its consumption to inform buyer insights, activation, and measurement 4. The frame moves content from a creative deliverable into a measurable operating system, and it changes which numbers land on the quarterly review slide.
Three layers stack in a mature content measurement model:
- Output metrics count assets shipped, keywords ranked, and impressions served.
- Consumption metrics track which pieces are actually read, watched, or downloaded, by whom, at what depth, and against which account or segment.
- Incrementality metrics isolate the lift attributable to content exposure by comparing exposed and control populations, which McKinsey's advanced personalization work identifies as the essential test for validating any ROI claim tied to tailored experiences 1.
Most 2025 content programs still report at the output layer and treat consumption metrics as diagnostic rather than governing. That reporting habit is the single biggest reason content ROI claims get discounted in CFO reviews. A defensible 2025 measurement stack governs decisions with consumption and incrementality data and demotes output counts to operational hygiene. McKinsey's guidance is direct on this point: moving beyond vanity metrics to robust financial measures is what actually validates marketing ROI 1. The teams making that shift are the same teams whose content budgets are surviving the reallocation pressure documented in the Forrester budget data.
Forrester's argument against per-function revenue attribution
The measurement discussion runs into a wall the moment a CFO asks what revenue the content program produced last quarter. Forrester's counterargument to that question is worth citing verbatim in board settings:
assigning unique revenue returns to each marketing function is like assigning revenue to a car's brakes 5
Brakes do not generate motion, but a car without them does not reach the destination. Top-of-funnel content sits in a similar position relative to closed revenue.
The implication is not that content should be exempt from measurement. It is that the measurement should be goal-based rather than revenue-attributed. A content program that owns audience development, category education, and pipeline entry should be measured on those goals directly: reach against target segments, depth of engagement per account, movement from anonymous to known, and progression from known to sales-qualified. Each of those metrics can be tracked, benchmarked, and defended without asking a single blog post to claim a share of closed-won revenue.
For a VP navigating this conversation, the sequence matters:
- Establish the goal the content function actually owns.
- Set the metric that measures progress against that goal.
- Then use incrementality testing on the campaigns where revenue attribution is legitimately possible, such as retargeting or bottom-of-funnel nurtures 1.
That structure gives the CFO a real answer without overpromising, and it protects the content budget from the attribution trap that has hollowed out programs at firms where earlier ROI claims did not survive audit.
Execution efficiency: the 'do better with less' 2025 mandate
Forrester's 2025 planning guidance to demand and ABM teams is blunt: the year is not about doing the same with less, it is about doing better with less 10. That framing changes the ROI conversation from a spend question to a cost-per-outcome question. Content programs that deliver higher pipeline yield per dollar of production and distribution will keep budget. Those that hold flat on output while unit economics drift will lose it.
McKinsey's work on where AI-powered personalization is heading points to the same conclusion from a different angle. The gains do not come from tools alone. They come from redesigning the workflows and roles around content so that data, decisioning, and production run as one operating system rather than three handoffs 11. The teams still routing every brief through a serial chain of internal review, agency drafting, revision, and legal sign-off are absorbing cycle-time cost that no amount of headline ROI can offset.
Three efficiency levers show up consistently in the 2025 data:
- Consolidating fragmented execution reduces coordination overhead, which is the hidden tax on multi-vendor content operations.
- Tightening the measurement stack around consumption and incrementality strips out production that consistently underperforms, freeing capacity for what works 4, 1.
- Redesigning the workflow itself, rather than layering AI onto the existing process, is the move that turns capability investment into unit-economics improvement 11.
Efficiency without measurement discipline is just cheaper mediocrity.
See How Your Content ROI Compares to 2025 Industry Benchmarks
Request a tailored ROI assessment using the latest content marketing statistics—identify pipeline gaps, efficiency opportunities, and actionable next steps for enterprise-scale content execution.
If you manage multiple locations: content economics across execution models
The audience shifts here. For VPs running content for law firm groups, DSOs, home services franchises, senior living portfolios, or any operator with more than a handful of locations, the ROI math changes before a single asset is produced. The unit is not the campaign. It is the location, and the cost structure of producing location-relevant content across the portfolio determines whether the 8 percent of revenue benchmark Forrester documents for B2B marketing spend is buying leverage or buying overhead 13.
Three execution models compete for that budget. Each has a different cost curve as location count grows, and the ROI question is which curve holds up when the mandate is to do better with less rather than expand headcount 10. The comparison below uses variables rather than invented benchmarks, because the numbers move with market, vertical, and program scope.
| Execution model | Cost structure per location | Coordination overhead | Measurement traceability |
|---|---|---|---|
| Traditional agency retainer | N locations × monthly retainer, plus per-asset fees | High: briefing cycles, revision rounds, status meetings scale with location count | Variable: depends on agency reporting discipline and access to client analytics |
| In-house team expansion | Fully loaded FTE cost × headcount required to cover portfolio | Medium: internal but still serial handoffs across strategy, production, and publishing | Higher: direct access to first-party data, but constrained by team capacity |
| AI-assisted execution (e.g., Vectoron) | Platform cost, largely fixed as location count scales | Low: consolidated workflow, approval-gated rather than handoff-gated | Higher: built-in consumption and performance signals per location |
The economic tension is visible in the first column. Agency retainers and in-house headcount both scale roughly linearly with location count. AI-assisted execution largely does not, which is why the model shows up in Forrester's 2025 reallocation data as one of the digital and content-heavy programs pulling budget share from less measurable line items 7. McKinsey's framing sharpens the point: capturing the ROI upside from AI-enabled workflows requires redesigning the process itself, not layering tooling onto an existing agency or in-house chain 11.
The board-facing translation for portfolio operators is that content quality can be held roughly constant across the three models while unit economics diverge sharply. A 40-location operator paying agency retainers per market is buying the same category of output that a consolidated execution model delivers at a materially different cost per location. That is the reallocation argument, not a quality argument, and it is the one that survives CFO review under the do-better-with-less mandate 10.
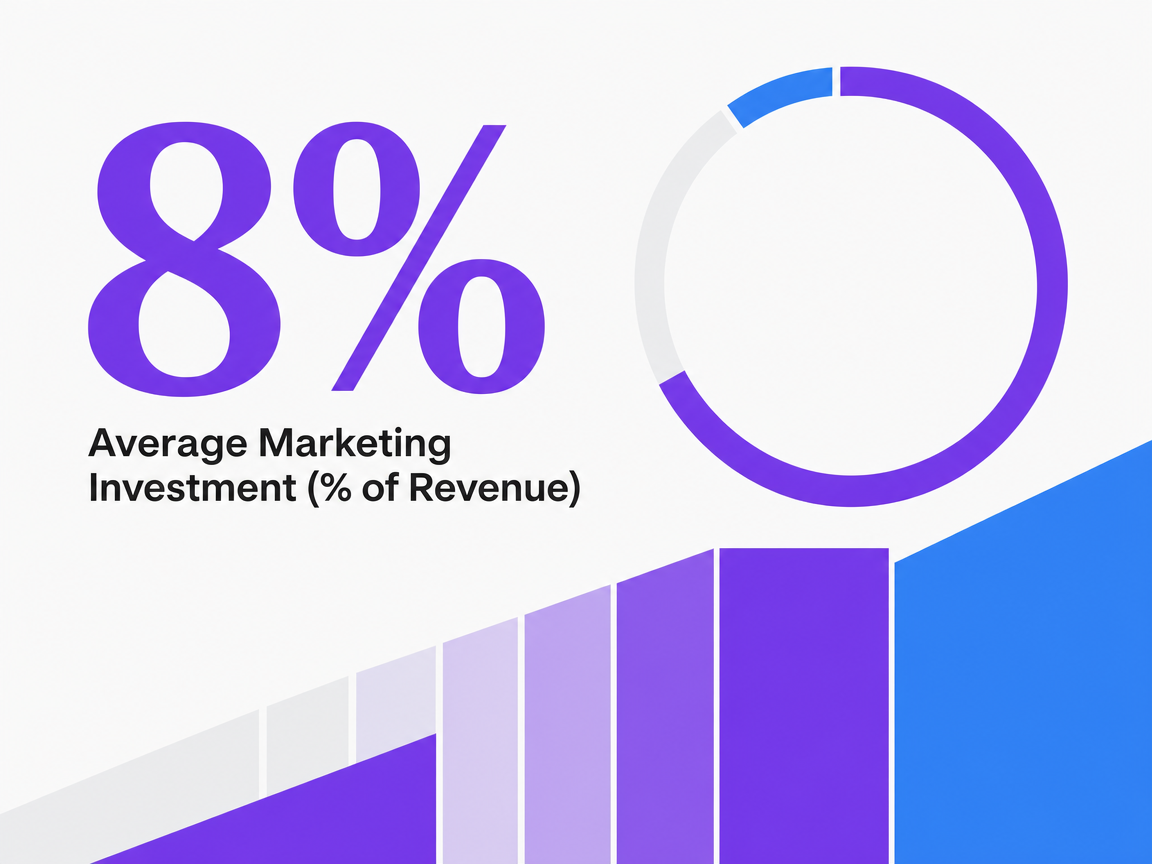 Average Marketing Investment (% of Revenue)
Average Marketing Investment (% of Revenue)
What separates high-ROI content programs from average ones in 2025
Four traits show up consistently in the programs pulling above-average returns this year:
- They govern with consumption and incrementality data rather than output counts 4, 1.
- They concentrate production against defined accounts or segments where engagement can be tracked to pipeline, which is where the ABM ROI premium actually lives 6.
- They treat personalization as an operating discipline with the data and workflow to support it, not a campaign tactic, which is what separates leader-tier revenue from average performance 3.
- They redesign the execution model itself rather than layering new tooling onto legacy handoffs 11.
Average programs invert those priorities. They report output, chase volume against generic personas, run personalization as a channel feature, and preserve serial workflows that absorb the efficiency gains any new capability should produce. The 2025 mandate to do better with less is unforgiving to that operating pattern 10. VPs who want to defend or expand content budget in the next planning cycle should audit their program against those four traits before the CFO does. Platforms like Vectoron exist to consolidate that execution model into one governed workflow, but the strategic decision precedes the tooling.
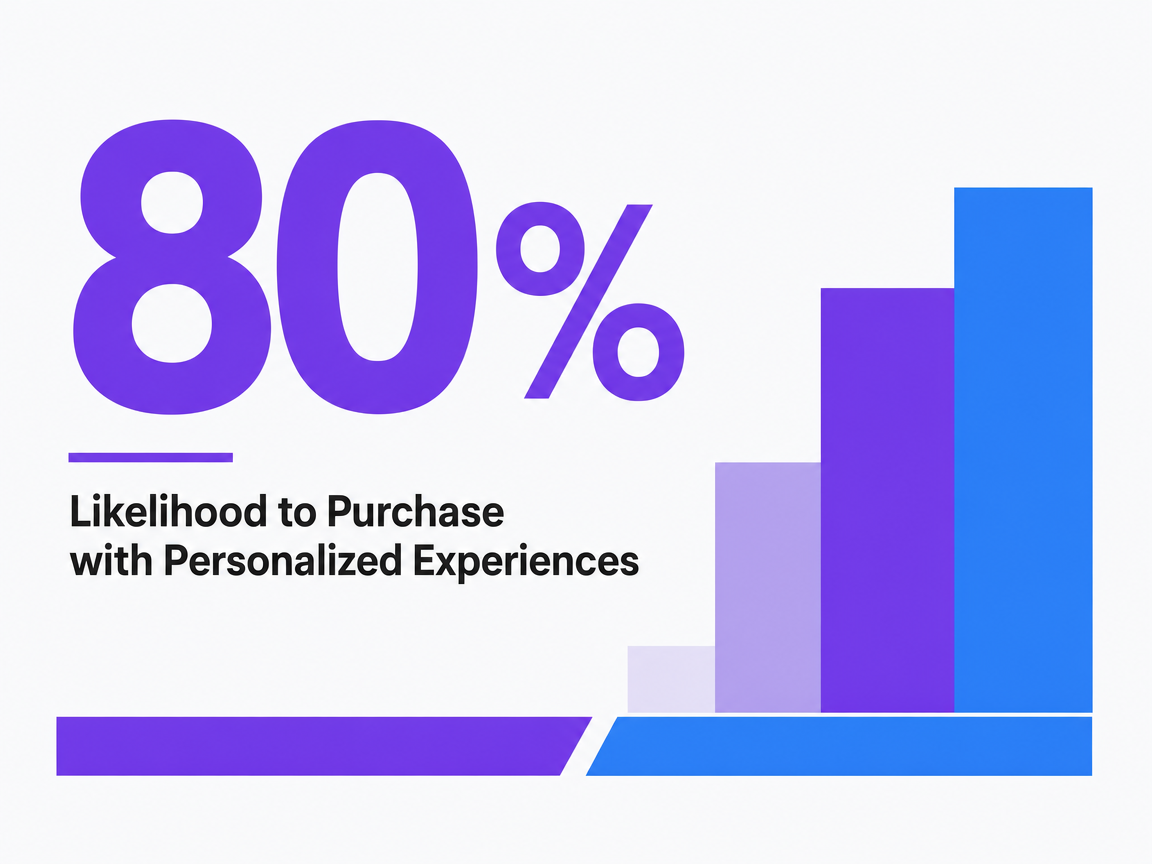 Likelihood to Purchase with Personalized Experiences
Likelihood to Purchase with Personalized Experiences
Frequently Asked Questions
References
- 1.The next frontier of personalized marketing.
- 2.What is personalization?.
- 3.The value of getting personalization right—or wrong—is multiplying.
- 4.Getting Smart On Content Intelligence.
- 5.A Truth About Marketing ROI.
- 6.Account-Based Marketing Delivers Higher ROI Across Regions.
- 7.2025 B2B Marketing Budget Benchmarks: Overview.
- 8.Forrester's Digital Success Benchmark — How Leaders Should Use It.
- 9.Forrester Predictions 2025: B2B Marketing and Sales.
- 10.2025 Demand and ABM Budget Planning Guide: Do Better With Less.
- 11.Discussing the future of AI-powered personalization.
- 12.Personalizing at scale.
- 13.The Average B2B Firm Invests 8% Of Revenue In Marketing - Forrester.
- 14.Personalizing the customer experience: Driving differentiation in retail.
- 15.Forrester's 2026 B2C Marketing, CX, And Digital Predictions.