
Key Takeaways
- A content performance report earns its keep only when each metric can shift budget, kill a topic, or greenlight a format—otherwise it's a compliance artifact, not a management tool.
- Metrics survive CFO scrutiny in three layers: instrumented GA4 events, CRM-linked pipeline outcomes priced under a stated attribution model, and incremental lift confirmed through controlled holdout tests.
- Pageviews, rankings, and undefined engagement scores fail finance review because they cannot be priced against ROI, conversion, or margin—the translation trade.gov names as the actual purpose of analytics 8.
- Structure the executive view as one page with a recommendation per row—continue, expand, hold, or retire—and pair it with a decision log that grades last period's calls before proposing new ones.
The actionability gap is the real content ROI problem
Most content performance reports fail long before the numbers are wrong. They fail because no one at the table can point to what changes on Monday morning. Traffic is up. Rankings held. Engagement ticked higher. The CFO nods, the meeting ends, and the content budget still gets questioned at the next quarterly review.
The diagnostic evidence for this pattern comes from an HBR Analytic Services survey of marketing leaders on marketing mix modeling, summarized by Google's Think with Google team. In that population, 87% of respondents said MMM is important to their business, yet only 28% said their organization is very effective at converting MMM insights into timely action 3. The finding is scoped to MMM specifically, but the mechanism generalizes to any measurement asset a marketing team produces: importance is stipulated, action is rare.
That gap is what a content performance report has to close. Not the gap between guesswork and data—most VPs cleared that hurdle years ago—but the gap between a chart and a decision. A report that documents last month's activity without prompting a next move is a compliance artifact, not a management tool.
Reframing the report as a decision instrument changes what belongs in it. Metrics earn a slot only when they can shift budget, kill a topic cluster, greenlight a format, or reprice a channel. Everything else is history. The sections that follow build that instrument in three evidentiary layers, starting with what survives finance-grade scrutiny and what does not.
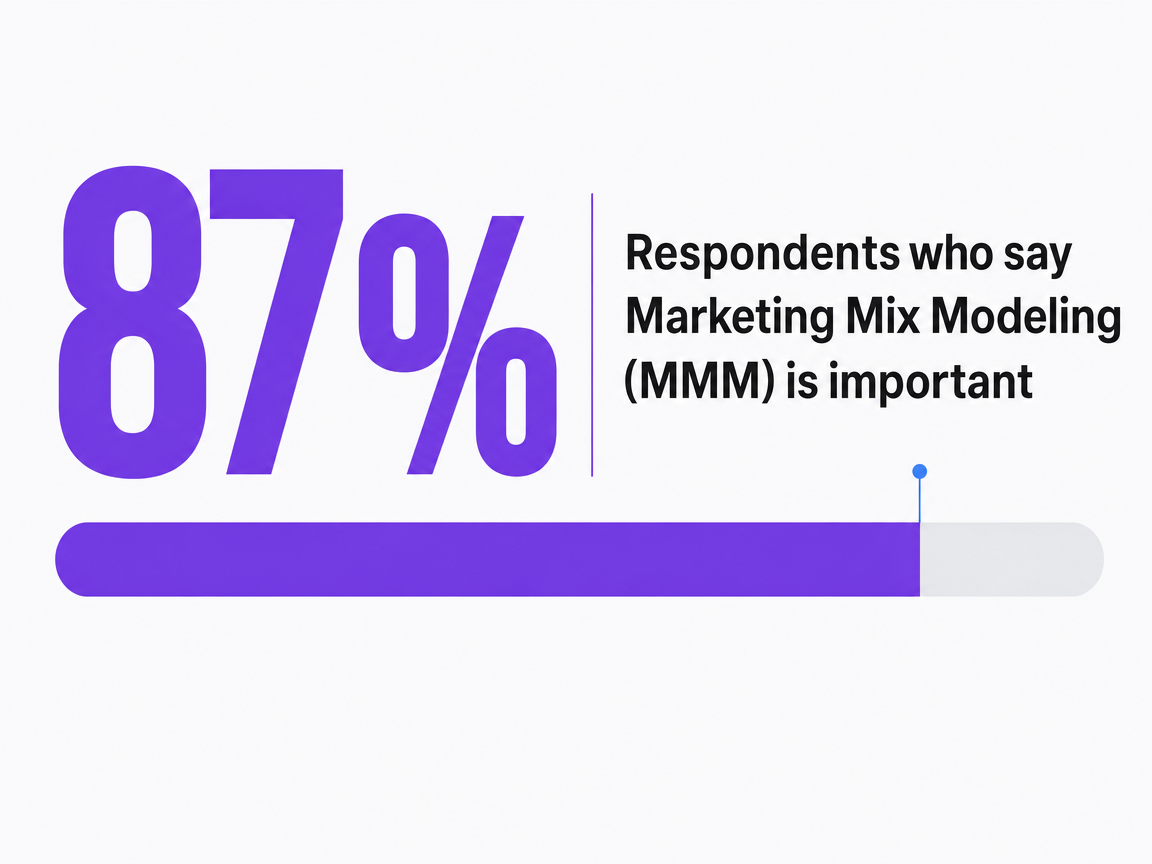 Respondents who say Marketing Mix Modeling (MMM) is important
Respondents who say Marketing Mix Modeling (MMM) is important
What survives CFO scrutiny and what does not
Metrics that fail the moment they leave marketing
A finance leader reading a content report is not hostile. They are looking for a variable that connects to a P&L line. When the numbers on the page cannot be traced to revenue, cost, or margin, the conversation stalls.
Pageviews are the first casualty. A pageview counts an impression, not intent, not qualification, not spend recovered. Rankings fare no better on their own. A first-position ranking for a keyword that does not produce sign-ups, calls, or purchases is a leading indicator with no confirmed lag.
Engagement metrics collapse under scrutiny for a different reason. A peer-reviewed review of how engagement is conceptualized and measured found that behavioral activity is the most common proxy used to represent engagement, and the authors flag the absence of a shared conceptual framework as a real problem for interpretation 9. Time on page, scroll depth, and social shares get lumped together as if they mean the same thing. They do not. A CFO will ask what a scroll depth of 74% cost and what it produced. Without a defined framework, the answer is a shrug.
Bounce rate, session duration, and follower growth belong in the same category. They describe surface behavior on marketing's own turf. None of them survive the translation into ROI, ecommerce conversion, or profit margin that trade.gov names as the actual purpose of website analytics reporting 8.
Metrics that hold up in a finance review
Metrics survive a finance review when they can be priced. That means each one is tied to a defined action, a defined cost, and a defined outcome the business already tracks.
Four categories consistently clear the bar. Instrumented behavioral events map to intent: GA4's recommended events include select_content, share, sign_up, and purchase, and Google's developer reference frames select_content as a way to identify popular content and categories of content, while positioning the broader event set as a means to measure more behaviors and generate more useful reports 1. The GA4 Analytics Help documentation reinforces that recommended events standardize measurement of important user actions across properties, which matters when a CFO compares content to paid channels on the same basis 2.
Pipeline metrics are the second category. Marketing-qualified leads, sales-qualified leads, and content-influenced opportunities pulled from the CRM link a specific asset to a specific revenue event. Trade.gov's guidance is direct on this point: analytics must be translated into what they mean for ROI, ecommerce sales conversion, or profit margin, not left as raw usage figures 8.
The third category is fully loaded cost per outcome. CPA, CLV, and ROAS anchor a content report to the same unit economics finance already uses for paid media, and a review of digital advertising ROI methodology names those three as the operative measures for assigning credit and comparing spend 10.
The fourth is incremental lift from controlled tests, which is where causation gets confirmed rather than assumed. That layer gets its own section.
What to remove from an inherited dashboard
Most VPs walk into a dashboard someone else built. It has thirty widgets. It gets emailed weekly. No one reads it. Deletion is the first productive act.
Three cuts move the report toward defensibility.
- Remove every metric that lacks a written definition. If "engagement" appears on the dashboard, either bind it to a specific instrumented event or drop it. Undefined composite scores are the reason engagement fails peer review as a construct 9, and they will fail a finance review for the same reason.
- Remove metrics that cannot be attributed to a content asset. Site-wide sessions, aggregate blog traffic, and global bounce rate obscure which piece of content is doing work. Digital.gov's KPI guidance recommends setting measurable indicators early, reviewing them regularly, and running a test-and-learn cadence, which is impossible when the underlying metrics do not resolve to a specific decision unit 7.
- Remove duplicated views of the same variable. Sessions, users, and pageviews for the same URL, plotted three ways, do not add insight. They add reading time.
What remains should fit on one page: a short list of instrumented events, the pipeline outcomes those events fed, and the fully loaded cost that produced them. Everything else moves to an appendix or gets retired.
The three evidentiary layers of a defensible report
Layer one: behavioral event instrumentation
The foundation of a defensible report is not a chart. It is the schema of events firing on the site. Without instrumented actions, everything above collapses into traffic counts and guesswork.
GA4's recommended event library is the practical starting point because it standardizes the actions that matter across properties. Google's developer reference defines select_content as a way to identify popular content and categories of content, and frames the broader recommended set as a means to measure more behaviors and generate more useful reports 1. Four events do the heaviest lifting for a content report:
select_contentwhen a reader chooses an article, resource, or CTAsharewhen they push it outwardsign_upwhen they exchange an email for a gated asset or newsletterpurchasewhen the session terminates in revenue
The GA4 Analytics Help documentation reinforces that these recommended events standardize measurement of important user actions, which keeps content comparable to paid channels on the same denominator 2.
Custom events fill the gaps the recommended set leaves open. A demo request, a pricing page view, a calculator submission, a phone-tap on mobile—each becomes a discrete row in the report. The Measurement Protocol reference documents the server-side collection path for events that cannot be captured client-side, which matters for form submissions and post-conversion callbacks that would otherwise leak out of the report 12.
This layer answers one question: did the content produce a behavior worth pricing? If the event does not exist in the schema, the outcome does not exist in the report.
Layer two: CRM-linked pipeline and revenue outcomes
Events describe behavior. They do not describe money. Layer two is where each instrumented action gets matched to a record in the CRM and priced against a pipeline stage.
The mechanics are straightforward but rarely executed cleanly. A sign_up event fires and passes a user identifier, campaign source, and the content asset that triggered it. The CRM ingests that identifier, opens or updates a contact record, and stamps the originating asset onto every subsequent stage transition: MQL, SQL, opportunity, closed-won. The report then rolls those transitions up by content asset, topic cluster, or funnel stage. Trade.gov's guidance is blunt about why this step is non-negotiable: website analytics must be translated into what they mean for ROI, ecommerce sales conversion, or profit margin, not left as raw usage figures 8.
Two design choices decide whether this layer holds up in a finance review. The first is which contribution model gets applied. First-touch overstates awareness content. Last-touch overstates bottom-funnel assets. Position-based or data-driven models spread credit across the sequence a buyer actually took. A review of digital advertising ROI methodology names CPA, CLV, and ROAS as the operative measures for assigning credit and comparing spend across channels, and stresses that the attribution model is what makes those measures comparable rather than arbitrary 10.
The second is fully loaded cost. Content production expense, distribution spend, tool licenses, and allocated headcount belong in the denominator. A ROAS figure that excludes the cost of the writer, the editor, and the SEO tool is not a ROAS figure the CFO will accept twice.
What this layer produces is a priced pipeline column next to each content asset. That column is what the executive view is built from.
Layer three: incrementality and experiment validation
Attribution shows contribution. It does not prove causation. A blog post credited with 40% of an opportunity's touchpoints may have influenced the deal, or the buyer may have closed anyway and read the post on the way in. Layer three separates the two.
Incrementality testing answers whether the content actually caused the outcome. The standard design is a controlled holdout: a matched audience receives the content, a comparable audience does not, and the difference in conversion rate between the two is the incremental lift.
- Geographic holdouts work for locally distributed content.
- Audience holdouts inside a marketing automation platform work for gated assets.
- Time-based tests work when a piece of content is added or removed from a nurture sequence.
Digital.gov's KPI guidance frames this posture directly: set measurable indicators early, review them regularly, and run a test-and-learn approach to improve effectiveness 7. That cadence is what turns the report from a monthly recap into a running experiment log.
Two disciplines keep the layer honest. First, test one variable at a time. A content redesign that ships alongside a new nurture email and a pricing change cannot be attributed cleanly to any of the three. Second, respect sample size. A holdout of 200 sessions will produce a lift number, but not one the CFO should act on.
What survives all three layers—an instrumented event, a priced pipeline outcome, and a validated incremental lift—is the line item a content performance report can defend against any paid channel on the plan.
Test content performance reporting with full access
Measure ROI on published content with actionable report data during your trial.
Platform-native versus independent measurement
GA4, HubSpot, Salesforce, LinkedIn Campaign Manager, and a retail media network will each report a different version of the same content asset's contribution. Each platform sees only what its own pixel, tag, or graph can observe, and each is optimizing its own numerator. A content performance report that inherits any single platform's view inherits that platform's blind spots.
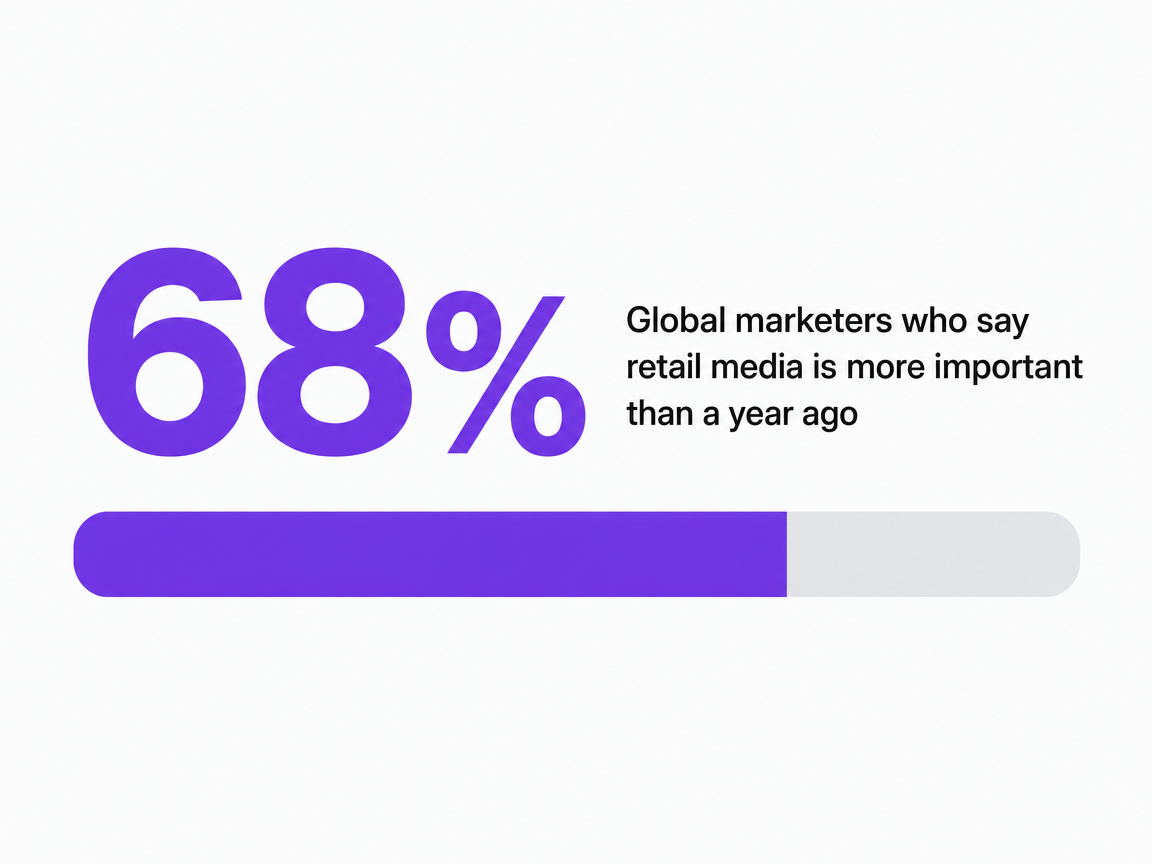
The case for going beyond platform-native measurement is not ideological. It is arithmetic. Closed ecosystems now sit between the content and a growing share of the buyer's decision path, and their share is rising. Nielsen's 2025 analysis of independent measurement found that 68% of global marketers say retail media is more important to their media strategies than a year ago, which the firm frames as evidence that cross-platform, independent measurement matters more when walled gardens influence the outcome 4. The same logic applies to any content report that spans organic search, paid social, and email nurture: no single vendor's dashboard sees the full sequence.
Two practical corrections keep the report defensible. First, treat GA4 as the behavioral spine, not the verdict. Events are the evidence layer, not the outcome layer. Second, reconcile platform-reported conversions against the CRM's system of record at least quarterly. When the two disagree by more than a small margin, the CRM number is the one that goes to the CFO.
A worked example: from pageviews to a CFO-ready line item
Consider a mid-funnel comparison guide that has run for six months. The inherited report shows one line: Blog post X: 12,400 pageviews, 3:14 average time on page, position 4 for the target query. None of those numbers price anything, and none of them tell the VP whether to commission three more posts in the same cluster or retire it.
Rebuilding the same asset through the three evidentiary layers changes the output. Layer one replaces pageviews with instrumented behavior. The GA4 recommended events firing on the page—select_content when readers click into linked resources, share when they push the post outward, and sign_up when they exchange an email for the comparison worksheet—produce priceable actions, since Google frames the recommended set as a way to measure behaviors that generate more useful reports 1. The line now reads: 41 sign_up events, 118 select_content clicks to pricing, 22 shares.
Layer two matches those events to CRM records. Of the 41 sign-ups, seven progressed to SQL and two to closed-won under a position-based attribution model, producing a priced pipeline column and a fully loaded CPA that includes production, distribution, and allocated headcount—the translation into ROI, conversion, or margin that trade.gov names as the actual job of website analytics 8.
Layer three closes the loop with a holdout test on the nurture sequence the post feeds, isolating incremental lift from baseline conversion. The finished line item reads as a decision: continue, expand the cluster, or reallocate.
See How a Content Performance Report Quantifies Marketing ROI
Request a walkthrough of actionable reporting frameworks that tie content initiatives directly to pipeline metrics, conversions, and cost efficiency—built for teams managing multi-channel campaigns at enterprise scale.
Structuring the report so it drives a next decision
The one-page executive view
The executive view is the top of the report, not a summary of it. It answers three questions in a fixed order: what did content produce last period, at what fully loaded cost, and what changes next period as a result. Anything that does not serve those three answers belongs in an appendix.
A defensible layout has four columns and no more than a dozen rows.
- Column one names the content asset or cluster.
- Column two shows the priced pipeline outcome pulled from the CRM: influenced opportunities, SQLs, or closed-won revenue under a stated attribution model.
- Column three shows fully loaded CPA, which anchors the row to the same unit economics finance uses for paid channels—CPA, CLV, and ROAS being the operative measures a review of digital advertising ROI methodology names for cross-channel comparison 10.
- Column four shows the incremental lift confirmed by the most recent holdout test, or a blank cell flagged for testing.
The page ends with a single recommendation per row: continue, expand, hold, or retire. That column is what turns a report into an instrument. Without it, the executive view is a scoreboard.
The decision log that closes the actionability gap
Below the executive view sits a running decision log. It records every recommendation the report has produced, the date it was made, the person who owns it, and the outcome once enough time has passed to measure it. Three months in, the log is where the report earns its authority.
The log is the operational answer to the pattern documented in the HBR Analytic Services survey summarized by Think with Google, where importance far outruns action 3. A decision that never gets logged does not get reviewed, and one that never gets reviewed does not close the loop. Digital.gov's guidance frames the same posture in KPI terms: set indicators early, review them regularly, and treat the work as test-and-learn rather than reporting 7.
Two disciplines keep the log useful. Each entry names one decision, not a bundle. And each entry gets a scheduled review date on the calendar the day it is written, so the next report opens with last period's decisions graded before new ones are proposed.
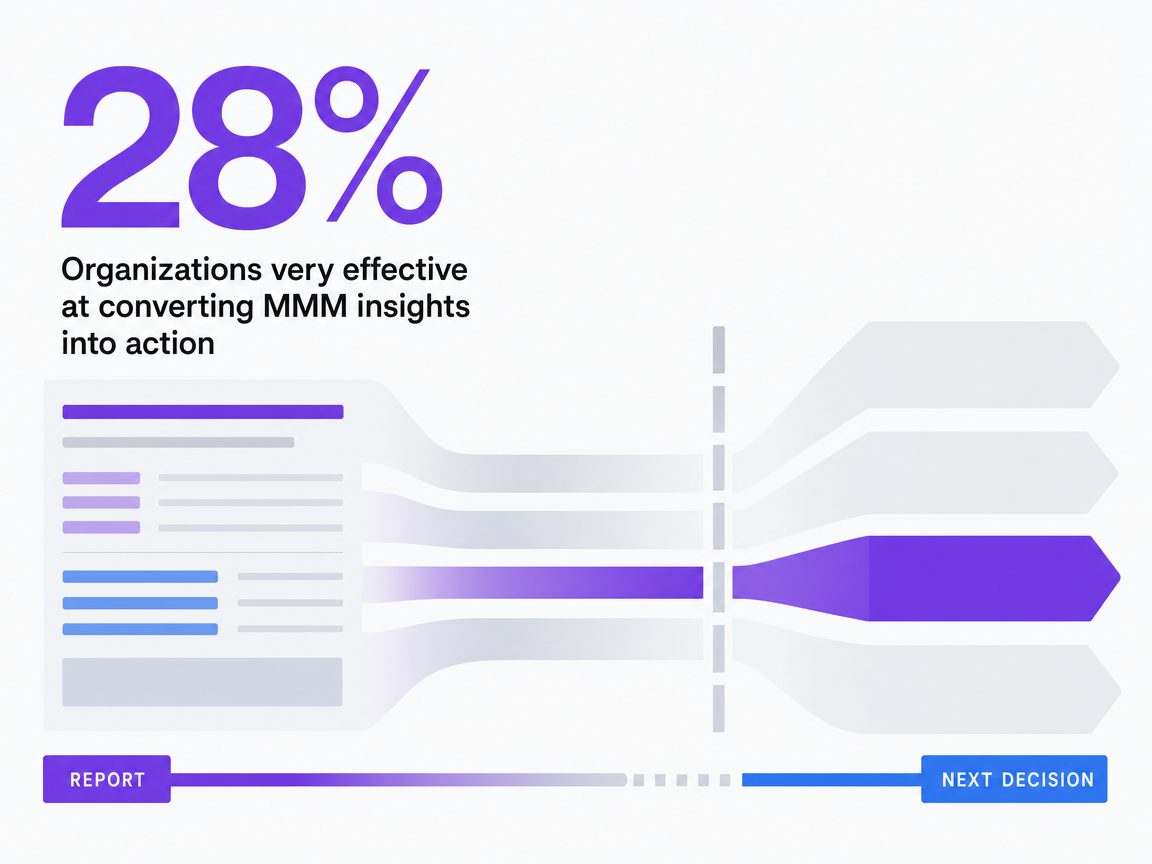 Organizations very effective at converting MMM insights into action
Organizations very effective at converting MMM insights into action
If you manage multiple locations: rolling reports up to a portfolio view
Audience switch: this section is for VPs whose org runs multiple locations—dental groups, home services franchises, senior living portfolios, law firm networks, or multi-site behavioral health operators. Single-site readers can skip ahead.
The moment a content program serves more than one location, the unit of decision shifts. A campaign-level report tells the VP whether a topic cluster worked in aggregate. A portfolio-level report tells the VP which locations the cluster worked at, and which ones need a different investment thesis. Those are different reports.
Rolling the three evidentiary layers up to a portfolio view means holding the columns constant and changing the row. Each row is a location cohort—by market, by tenure, by service line, or by revenue band. The columns stay fixed: instrumented events per location, priced pipeline outcomes from the CRM under a stated attribution model, fully loaded cost per qualified lead, and the most recent incremental lift test. Trade.gov's framing still applies at this altitude: the numbers only matter once they resolve to ROI, conversion, or margin per location 8.
Four operational variables drive the read:
- Locations in the cohort.
- Cost per qualified lead at each location.
- Content production cost allocated per location.
- Incremental bookings attributable to content over the test window.
When those four are held constant across rows, the report exposes cohorts that look identical at the campaign level but diverge sharply on unit economics.
| Variable | Cohort A | Cohort B |
|---|---|---|
| Locations in cohort | N₁ | N₂ |
| Content production cost per location | C₁ | C₂ |
| Cost per qualified lead | CPL₁ | CPL₂ |
| Incremental bookings (holdout-validated) | ΔB₁ | ΔB₂ |
The decision that comes out of a portfolio view is rarely "more content." It is usually reallocation: shift production budget from cohorts where incremental lift has flattened to cohorts where the CPL curve still has slope. Digital.gov's test-and-learn cadence 7belongs at the cohort level, not the brand level, because the location is where the money actually lands.
 Global marketers who say retail media is more important than a year ago
Global marketers who say retail media is more important than a year ago
Frequently Asked Questions
References
- 1.Analytics - Recommended events - Google for Developers.
- 2.[GA4] Recommended events - Analytics Help.
- 3.How marketing leaders close the MMM 'actionability gap'.
- 4.The value of independent measurement for retail media attribution.
- 5.B2B Content Marketing: 2025 Benchmarks & Trends.
- 6.Understanding Marketing Analytics & ROI.
- 7.Webinar Recap: How to Measure Effectiveness of Your Digital Outreach and Communications.
- 8.How to Use Website Analytics Strategically.
- 9.Conceptualising and measuring social media engagement.
- 10.MEASURING ROI IN DIGITAL ADVERTISING.
- 11.2023 Nielsen Annual Marketing Report.
- 12.Events | Google Analytics.