Key Takeaways
- SaaS conversion gains in 2025 come from disciplined experimentation against pricing, onboarding, homepage-to-trial, and checkout flows, not from picking a single best testing tool.
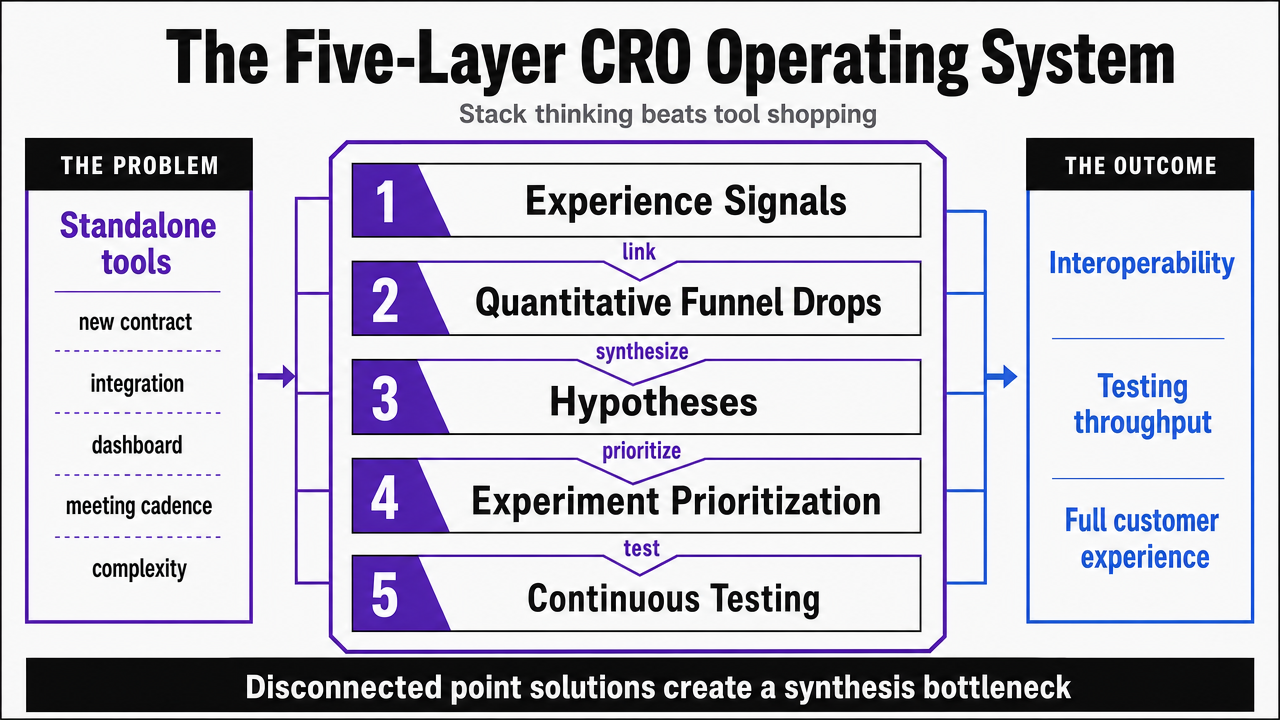
- Treating CRO as a five-layer operating system—analytics, behavior intelligence, experimentation, personalization, and AI orchestration—prevents tool overlap and keeps learning compounding across the stack.
- Quantitative analytics should function as a prioritization mechanism, capping primary metrics at five funnel-step conversion rates and segmenting by plan tier, company size, and acquisition channel.
- Behavior intelligence only pays off when every session replay or heatmap observation converts into a scored hypothesis using the "We believe… so if we… we will see…" structure 2.
- The experimentation engine should be licensed only after a ranked hypothesis queue exists, then validated with A/A tests before running revenue-sensitive experiments 1.
- Lean teams must guard against misleading test results from user interference, biased samples, and violated independence assumptions by pairing each experiment with a downstream guardrail metric 3.
- Personalization platforms should be deferred until at least one segment-targeted experiment has succeeded inside the existing experimentation engine, since lean teams lack the segment density to justify enterprise tools.
- AI orchestration is a distinct stack layer that ranks hypotheses across the lower four layers, shifting growth marketers from manual synthesis to approval decisions 11.
- Consolidated orchestration reduces the coordination tax of fragmented retainers and point tools, targeting the same conversion outputs—like a 2.1% to 3.0% homepage-to-trial gain—with fewer handoffs 7.
- Heads of Growth should avoid enterprise personalization, heatmap-heavy stacks, and experimentation platforms purchased before the supporting analytical layer is operational.
- A 90-day sequence—analytics discipline, then behavior intelligence and validated experimentation, then AI orchestration—gets a lean team to its first pricing or onboarding test with a ranked queue behind it.
Where SaaS Conversion Gains Actually Come From in 2025
Conversion gains for lean SaaS growth teams in 2025 stem from prioritizing the right experiments against critical funnel steps—pricing, onboarding, homepage-to-trial, and trial-to-paid. Success hinges on the operating discipline to ship these experiments efficiently, without external coordination delays.
The conversion rate optimization (CRO) software market is projected to grow from approximately $1.7 billion in 2025 to $5.0 billion by 2035, indicating a significant shift in budget allocation from traffic acquisition to maximizing revenue from existing visitors 5. This growth reflects CRO's evolution from an outsourced agency function to an internal operating function, typically owned by the Head of Growth.
Paddle's CRO guidance highlights key leverage points: value proposition, pricing, onboarding, and checkout. They note that mainstream analytics platforms now incorporate AI features capable of predicting behavior and identifying friction points, reducing the need for a dedicated data team 10. Bain reinforces this, stating that CRO is about continuous testing across the entire customer experience, not just isolated tools 8.
For a Head of Growth leading a 3–8 person team, the challenge is no longer selecting a testing tool, but assembling a stack that translates analytics signals into prioritized experiments and consistent, shipped changes.
The Five-Layer CRO Operating System
Why Stack Thinking Beats Tool Shopping
Many CRO discussions present tools as interchangeable. However, for a lean growth team, each standalone tool purchase adds complexity: a new contract, integration, dashboard, and meeting cadence, often without ensuring interoperability or consistent experiment prioritization.
Bain's perspective emphasizes CRO as continuous testing across the full customer experience, rather than a collection of disconnected point solutions 8. A heatmap tool that cannot link observations to quantitative funnel drops, or an experimentation platform unable to integrate hypotheses from session intelligence, creates a synthesis bottleneck for the growth marketer, hindering testing throughput.
Stack thinking reorients tool evaluation. Instead of focusing on interface aesthetics, growth leaders consider which layer of the conversion operating system a tool addresses and how it integrates with layers above and below. This shift from feature comparison to layer ownership is crucial for building a stack that fosters compounding learning, rather than just accumulating licensing costs.
The Layers a Lean Team Needs to Own
A modern CRO operating system comprises five distinct layers, each with a specific function. The quantitative analytics layer identifies revenue leaks across the funnel and provides baseline metrics for experiment evaluation. The behavior intelligence layer, using session replay, scroll/click data, and qualitative feedback, generates hypotheses about the causes of these leaks. The experimentation engine then tests these hypotheses against high-leverage areas like pricing, onboarding, and homepage-to-trial flows, which Paddle identifies as the SaaS revenue spine 10.
The personalization and feedback layer delivers variant experiences and collects structured voice-of-customer input, becoming relevant once a team has sufficient traffic and segmentation. The newest layer is AI orchestration, which acts as connective tissue, prioritizing experiments, generating hypotheses from cross-layer pattern detection, and coordinating execution across content, SEO, and conversion efforts. CXL highlights this AI-human collaboration: algorithms identify high-impact experiment candidates, while humans interpret results and align tests with business objectives 11.
While a lean team doesn't need to implement all five layers immediately, understanding each tool's layer before procurement is essential to avoid budget inefficiencies from gaps or overlaps.
 Visualize the five-layer CRO operating system framework introduced in this section, since the article explicitly defines five distinct stack layers and their functions
Layer One: Quantitative Analytics for Revenue Leak Identification
Quantitative analytics forms the foundational layer of the CRO stack, providing the numerical basis for all other layers. Without a clear funnel view—encompassing visits, signups, activation, paid conversion, and expansion—session replays yield anecdotes instead of actionable hypotheses, and experiments lack interpretable results.
This layer's primary role is to instrument the four high-leverage SaaS flows identified by Paddle—value proposition, pricing, onboarding, and checkout—to establish baseline conversion rates for each step. This includes sufficient segmentation to pinpoint exact revenue leakage points 10. Most lean teams already utilize core platforms like GA4, Mixpanel, Amplitude, or PostHog, which cover these basics. Paddle also notes that these mainstream analytics tools now offer AI features to predict behavior and identify friction without requiring a dedicated data scientist 10.
A common pitfall is treating analytics as merely a dashboard rather than a prioritization mechanism. A funnel report showing a 47% drop between a pricing-page view and trial start is not a conclusion, but the starting point for a hypothesis queue. Bain emphasizes that effective CRO requires defining clear conversion targets and understanding attribution before any testing investment can yield returns, as tools unable to link changes to revenue-relevant targets produce learning that doesn't compound 8.
Two practical guidelines help teams leverage this layer effectively. First, limit primary metrics to no more than five funnel-step conversion rates, adding a new one only after an existing one is retired. Penn State Extension highlights A/B testing as the mechanism for data-driven decisions, which is only effective when the metric list remains manageable 9. Second, instrument segments related to pricing power—such as plan tier, company size, and acquisition channel—because a flat funnel rate can obscure segments where homepage or pricing tests would generate the most revenue. Without this segmentation, the experimentation layer receives noise instead of clear signals.
Layer Two: Behavior Intelligence for Actionable Hypotheses
Behavior intelligence is an area where many lean teams overspend without commensurate learning. Tools like session replay, heatmaps, scroll tracking, and on-page surveys can generate extensive data that feels productive but often fails to produce testable hypotheses. This layer is valuable only when its outputs directly feed the experimentation queue.
FT Strategies advocates for a disciplined approach to avoid "heatmap theater": every observation should translate into a structured hypothesis, framed as "We believe that… so if we… we will see…," and then scored for impact and confidence before competing for a test slot 2. A 12-minute replay of users hesitating on a pricing tier is raw data, not a finding. The hypothesis is the unit of work that justifies engineering time.
The practical rule for this layer is to direct qualitative tools towards specific funnel drops identified by the analytics layer. Tools like Hotjar, FullStory, Microsoft Clarity, and PostHog session replay are all capable. The key differentiator is not the tool itself, but the discipline of watching sessions in batches linked to identified drop-offs, and then logging hypotheses into a shared queue. Without this constraint, behavior intelligence becomes an expensive observation platform that generates opinions rather than experiments.
Test Conversion Workflows With Real-Time Results
Run live optimization experiments and measure impact using your own campaigns during the free trial period.
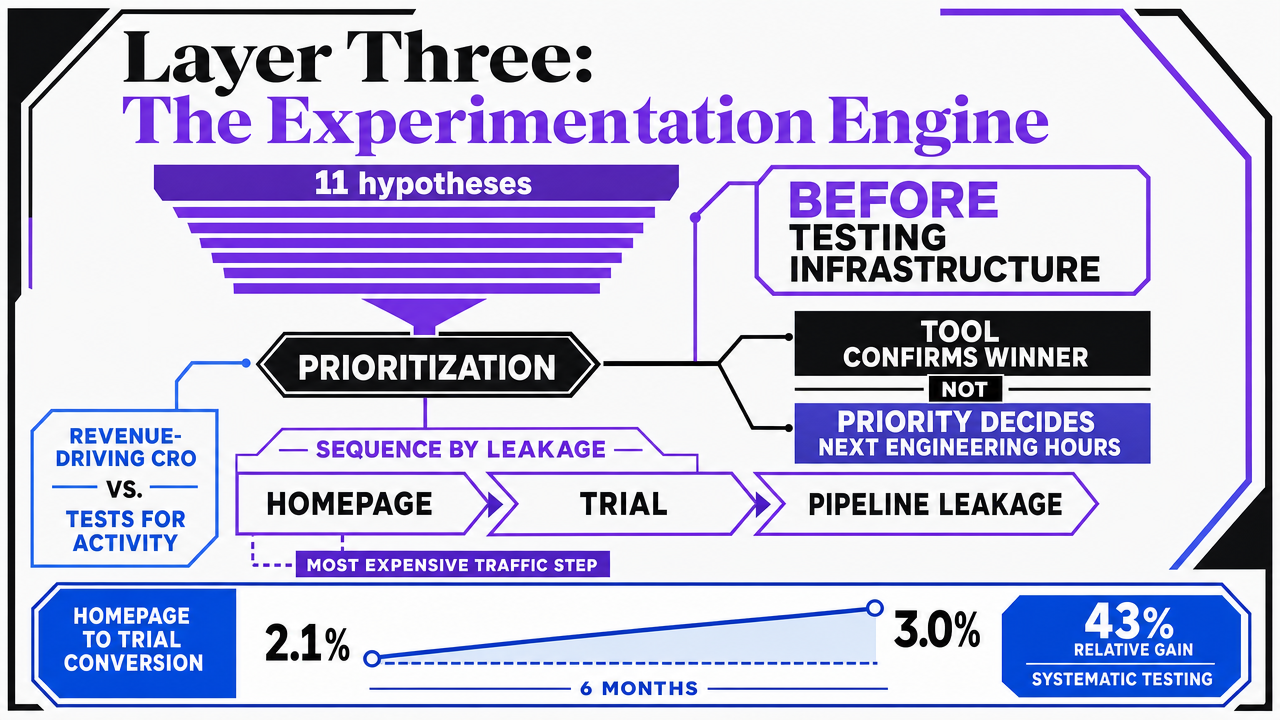
Layer Three: The Experimentation Engine
Prioritization Before Testing Infrastructure
A common error for lean teams at this layer is acquiring a testing tool before addressing the prioritization challenge. An experimentation engine confirms whether a variant outperforms a control, but it doesn't determine which of eleven hypotheses in the queue deserves the next engineering hours. Answering this second question is what distinguishes a CRO program that drives revenue from one that merely conducts tests for activity's sake.
A documented B2B SaaS case from rework.com illustrates this: a company increased homepage-to-trial conversion from 2.1% to 3.0% over six months through systematic testing—a 43% relative gain on the most expensive traffic step 7. This improvement resulted from sequencing tests against the funnel steps with the most significant pipeline leakage, not from a faster experimentation tool.
FT Strategies' prioritization rule—scoring hypotheses by impact and confidence, then testing the riskiest assumption first—is the operational discipline behind such results 2. For a Head of Growth, this means selecting the experimentation engine after a hypothesis queue is established, not before. Tooling without a ranked queue provides velocity without direction.
A Phased Maturity Path for Teams Without QA Engineers
Lean teams often lack dedicated experimentation engineers, necessitating a testing platform that aligns with the team's operational maturity rather than a vendor's feature set. The Research and Data Science Hub outlines a three-phase progression: Phase 1 involves infrastructure validation with A/A tests to confirm the system accurately detects no difference when none exists; Phase 2 covers simple experiments on low-risk surfaces; and Phase 3 progresses to strategic experiments linked to revenue-relevant decisions 1.
Many growth teams bypass Phase 1, moving directly to Phase 2 with tools like VWO, Optimizely, Statsig, or GrowthBook. This approach is only effective if the randomization is verified as clean and the metrics pipeline aligns with the analytics layer. Skipping the A/A check is a primary reason early CRO programs produce untrustworthy results within six months.
For a 3–8 person team, the practical sequence involves licensing a platform capable of both server-side and client-side tests on the same surface. Validate it with A/A runs on a known-stable page, then proceed to pricing and onboarding tests only after analyzing effect sizes and confidence intervals from two or three initial successes 1.
Where CRO Tools Mislead Lean Teams
Experimentation tools can mislead lean teams not just through bugs, but through subtle misinterpretations. MIS Quarterly research on large-scale digital experiments identifies three specific failure modes: interference between users on the same product surface, biased samples from who enters a test, and limitations of standard statistical tools when underlying behavior violates independence assumptions 3. Each of these can produce seemingly positive results that are, in fact, misleading.
These errors are particularly costly on pricing pages. A test showing a 12% lift in trial starts might mask a subsequent drop in trial-to-paid conversion if the variant attracted lower-intent visitors. Similarly, a homepage test that performs well with a Tuesday cohort might fail three weeks later due to shifts in traffic mix.
The defensive strategy is precise: pair every experiment with a downstream guardrail metric, run tests long enough to capture weekly variance, and avoid declaring a winner based solely on a statistical threshold without examining the effect size and the specific segment driving the result 1.
 Support the cited B2B SaaS case showing homepage-to-trial conversion rose from 2.1% to 3.0% over six months through systematic testing, which is referenced directly in this section
Layer Four: Personalization and Feedback Without Enterprise Bloat
For SaaS growth teams below Series C, personalization occupies a challenging position in the stack. Enterprise tools like Optimizely Personalization, Adobe Target, and Dynamic Yield are designed and priced for large-scale operations with thousands of segment-variant combinations and high traffic volumes. A lean team with 40,000 monthly visitors and three pricing tiers lacks the segment density to justify such machinery. Implementing these tools prematurely often leads to configuration projects that outlast the underlying growth strategy.
For a 3–8 person team, the valuable function of this layer is more focused: delivering variant experiences to the two or three segments where the analytics layer has already demonstrated a behavioral gap, and collecting structured voice-of-customer input on the same surfaces being tested by the experimentation engine. Bain's principle applies here: CRO improves when continuous testing covers the entire customer experience, not when personalization operates in isolation from the test queue 8. A targeted onboarding variant for self-serve versus sales-assisted signups, combined with a concise exit survey on the pricing page, will likely generate more revenue than a complex 50-segment personalization matrix that is difficult to maintain.
The practical rule is to defer dedicated personalization platforms until at least one segment-targeted experiment has succeeded within the existing experimentation engine. Until then, the current experimentation tool can manage segment-scoped variants without requiring an additional contract.
Layer Five: AI Orchestration as the Newest Stack Position
AI orchestration is often overlooked or miscategorized by lean growth teams as a feature of existing analytics tools. However, it is a distinct layer. Its purpose is to synthesize data from the four layers below—funnel metrics, behavior intelligence, experiment results, and personalization signals—to generate a ranked queue of what to test next, what content to deploy, and how results should inform the overall program.
CXL describes the effective division of labor for this layer: algorithms handle pattern detection, hypothesis generation, and large-scale testing coordination, while humans interpret results and align tests with business objectives 11. This division fundamentally alters the unit economics for a 3–8 person team. A growth marketer who previously spent hours synthesizing data into a prioritized hypothesis list can now dedicate that time to approving, rejecting, or modifying AI-generated hypotheses.
This emerging category extends beyond a single CRO point tool. AI marketing operating systems coordinate strategy, content production, SEO, and conversion experimentation against a unified account-level plan, routing execution through approval workflows instead of traditional agency handoffs. Vectoron is an example in this category, utilizing specialist strategists for content, SEO, conversion, PPC, and backlinks, all overseen by a lead strategist who prioritizes work across channels. The key test for any tool in this slot is whether it produces an actionable, ranked experiment queue for the team to implement immediately, or merely another dashboard.
See How Leading Growth Teams Automate Conversion Optimization at Scale
Request a walkthrough of unified AI-driven conversion workflows and approval systems designed for multi-location and high-volume digital marketing operations.
Stack Economics: Fragmented Retainer Model vs. Consolidated Orchestration
The true cost of a CRO stack extends beyond vendor pricing pages; it includes the coordination overhead between licenses, retainers, and internal hours required to synthesize signals from multiple layers into a ranked test queue and a shipped change. This "coordination tax" is significantly reduced when a Head of Growth transitions from a fragmented retainer model to a consolidated orchestration layer.
The rework.com B2B SaaS case provides a concrete output benchmark: a 43% relative gain in homepage-to-trial conversion (from 2.1% to 3.0%) over six months, achieved through systematic testing against the highest-leverage funnel step 7. This delta represents the desired output. The question then becomes which stack configuration achieves this with the fewest moving parts.
| CRO Layer | Fragmented Stack (Point Tools + Agency Retainer) | Consolidated Stack (Orchestrated) |
|---|---|---|
| Quantitative analytics | $Y license + agency dashboard access | $Y license, shared with orchestration |
| Behavior intelligence | $Y license + agency session reviews | $Y license, hypotheses logged to shared queue |
| Experimentation engine | $Y license + agency test build hours | $Y license, queue ranked by orchestration |
| Personalization/feedback | Deferred or $Y enterprise license | Handled inside experimentation tool |
| Prioritization & execution | $X monthly retainer + $Z internal coordination hours | Replaces $X retainer; $Z hours shift to approval |
| Output reference | 2.1% → 3.0% homepage-to-trial over six months 7 | Same output target, fewer handoffs |
While tool licenses remain relatively constant, the variables that change are the monthly retainer ($X) and internal coordination hours ($Z), along with the time between identifying a funnel drop and shipping a test. The consolidated model significantly reduces the synthesis layer, which is often a primary component of external agency billing.
What a Lean Team Should Not Buy Yet
Three categories of CRO tooling frequently deplete budgets for sub-Series-C growth teams without yielding proportional learning. First, enterprise personalization platforms like Adobe Target or Dynamic Yield are premature before product-market fit. They demand segment density and configuration effort that a 3–8 person team cannot sustain while also meeting pipeline targets. Second, heatmap-heavy session intelligence stacks are inefficient before traffic thresholds support statistical analysis. Watching 40 sessions weekly on a pricing page generates opinions, not hypotheses, and the discipline advocated by FT Strategies—where every observation leads to a scored, structured hypothesis—becomes unmanageable at low traffic volumes 2. Third, a dedicated experimentation platform purchased before a ranked hypothesis queue exists is problematic. MIS Quarterly research highlights how naive interpretation of test results can produce misleading "wins" when sample bias, interference, or assumption violations are unchecked. These errors compound when teams license testing capacity ahead of analytical maturity 3. The operational rule for a Head of Growth is to defer any tool whose value depends on a layer the team has not yet fully operationalized. The resulting savings can be redirected to engineering hours focused on addressing identified revenue leaks.
Assembling the Stack: A 90-Day Sequence for Heads of Growth
This 90-day sequence assumes a 3–8 person team already has GA4 or an equivalent analytics platform in place, but no functional experimentation program. The objective is not to implement five tools, but to establish a ranked hypothesis queue that drives shipped tests against the SaaS revenue spine identified by Paddle: value proposition, pricing, onboarding, and checkout 10.
Days 1–30: Analytics Discipline. Focus on instrumenting the four core flows to define five primary funnel-step conversion rates, segmented by plan tier, company size, and acquisition channel. Audit attribution against the conversion targets that Bain identifies as prerequisites for any testing investment to compound 8. The output for this month is a single document detailing the top three funnel drops by absolute revenue impact.
Days 31–60: Behavior Intelligence and Experimentation. Direct session replay and on-page surveys towards the three funnel drops identified in month one. Convert every observation into a structured hypothesis using FT Strategies' "We believe… so if we… we will see…" framework, scored by impact and confidence 2. Only after this queue is established, license an experimentation platform and validate it with A/A tests before running any experiments on revenue-sensitive surfaces 1.
Days 61–90: AI Orchestration and Strategic Tests. Integrate the AI orchestration layer. CXL's AI-human split guides the process: algorithms identify and rank hypotheses across the lower four layers, while the Head of Growth approves, rejects, or modifies the next experiments 11. By day 90, the team should be running its first pricing or onboarding test, complete with a downstream guardrail metric, and have a ranked queue of the next six experiments ready.
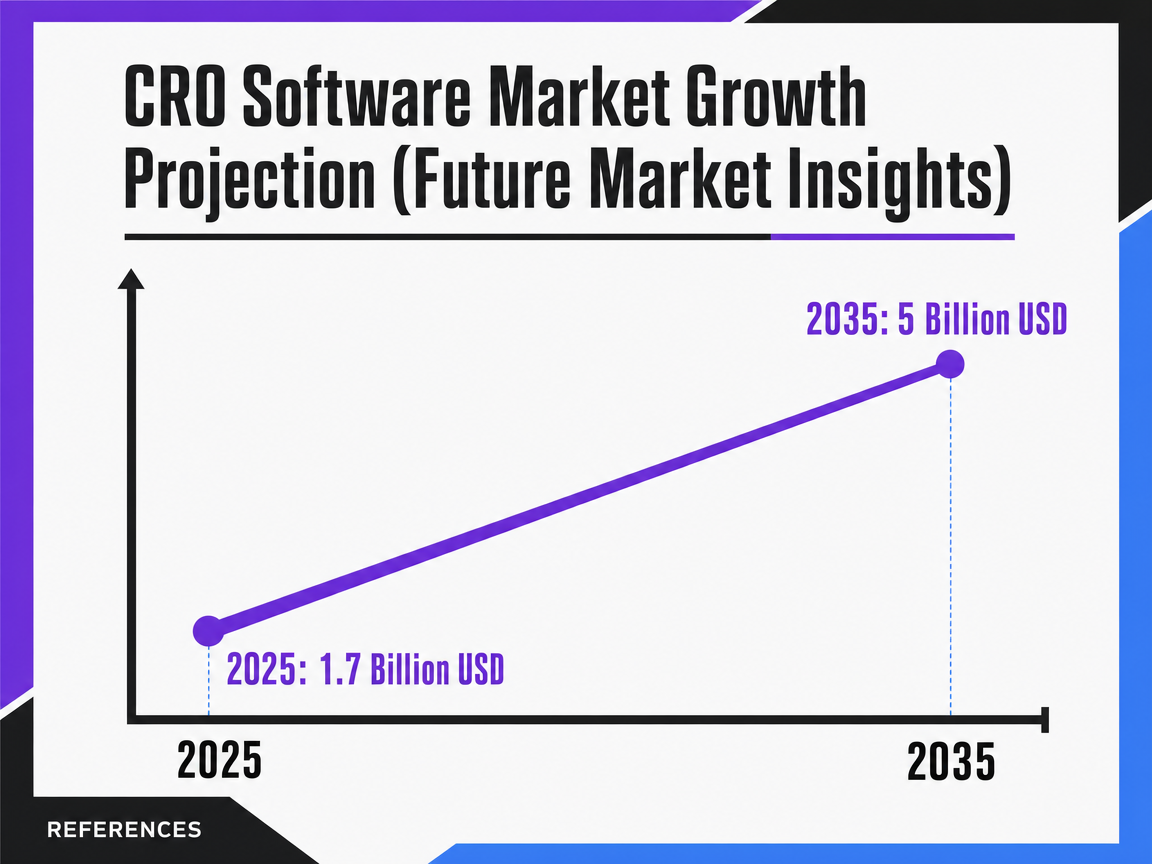 CRO Software Market Growth Projection (Future Market Insights)
Projected growth of the Conversion Rate Optimization software market from $1.7 billion in 2025 to $5.0 billion by 2035.
Frequently Asked Questions
References
- 1.Practical Guidance for A/B Testing - Research and Data Science Hub.
- 2.How experiment design can derisk your digital strategy.
- 3.The Critical Challenge of Using Large-scale Digital Experiments.
- 4.Maximizing promotion strategy with business experimentation.
- 5.Conversion Rate Optimization Software Market.
- 6.Conversion Rate Optimization Software Market Size, Growth and Trends.
- 7.Conversion Rate Optimization: The Systematic Approach to SaaS Growth.
- 8.Conversion Rate Optimization | CX Tools & Trends 2020.
- 9.A/B Testing to Improve Your Online Marketing.
- 10.SaaS Conversion Rate Optimization.
- 11.AI & CRO: Why Teams Should Focus on Strategy, Not Small Tweaks.