
Key Takeaways
- Executives now apply an evidentiary standard to marketing spend, so channel dashboards reporting activity fail where causal evidence linking spend to revenue contribution succeeds.
- A four-layer stack (financial outcomes, attribution, incrementality, marketing mix modeling) answers contribution, path, causation, and allocation questions that no single method can defend alone.
- Cadence determines credibility: monthly contribution metrics, quarterly incrementality tests, and semiannual MMM refreshes match finance's reporting clock, while annual-only measurement lets narratives harden before evidence arrives 7.
- Multi-location operators should focus next on intake signal fidelity, because qualified-call classification changes the ROI denominator and reorders which channels deserve the next incremental dollar.
Why CFOs Stopped Accepting Channel Dashboards
The quarterly business review used to end when the marketing slide showed click-through rates climbing and cost-per-lead dropping. That era is over. Deloitte's 2026 CMO Survey, drawing on responses from more than 300 senior marketing leaders, reports that marketing's strategic influence has grown alongside sharper scrutiny from CEOs and CFOs on measurable, revenue-linked outcomes, especially in digital channels 11. Finance leaders now want the same evidentiary rigor they apply to capital expenditures applied to marketing spend.
Channel dashboards lost their credibility for a specific reason. They report activity, not contribution. A CFO reviewing a $4 million digital budget cannot tell from a Google Ads dashboard whether the conversions reported there would have happened without the spend, whether the attribution model double-counts pipeline already credited to lifecycle email, or whether the cost-per-acquisition figure includes the unqualified leads that sales discarded in the first two minutes of a call. The dashboard answers a question marketing teams ask themselves. It does not answer the question finance asks.
The American Marketing Association's 2025 skills report identifies "proving ROI" as one of the largest current competency gaps among marketers, framing it as a discipline gap, not a tool gap 3. Marketing leaders who walk into budget reviews with channel telemetry instead of causal evidence are not losing arguments because their numbers are wrong. They are losing because their evidence does not match the standard the room now applies.
ROI as an Evidentiary Standard, Not a Reporting Exercise
The most useful reframe a marketing VP can adopt before the next budget review is borrowed from a discipline outside marketing. The Federal Trade Commission's substantiation standard for advertising claims requires that performance statements be truthful, not misleading, and backed by evidence the advertiser holds before the claim is made 1. Finance leaders apply a similar test to internal claims. When a VP asserts that paid search produced $6.2 million in pipeline last quarter, the CFO is not auditing the dashboard. The CFO is asking whether the evidence behind that number would hold up if challenged.
That distinction matters because it changes what a measurement system is for. A reporting exercise summarizes what happened. An evidentiary system documents how the team knows what happened, what alternative explanations were ruled out, and where the conclusion is weakest. The American Marketing Association's guidance on ROMI makes a parallel point: a single dashboard figure is not a substitute for the lift-and-cost analysis that produced it, and strategic decisions need long-term growth measurement and changes in brand or customer relationship assets to be credible 2. Executives trust ROI claims that show their work.
This is also why the research-backed approach to objective-setting matters more than tool selection. Academic work on digital marketing ROI frameworks emphasizes that the credibility of any ROI claim begins with how marketing objectives and KPI goals were chosen in the first place, before any analytics tool is opened 5. Teams that select metrics to match the executive question, then build the evidence to answer it, walk into the room with a defensible chain. Teams that present whatever the platform reports walk in with telemetry.
The Four-Layer Measurement Stack
Financial Outcome Metrics: The Question of Contribution
The first layer answers the question a CFO opens with: what did marketing contribute to revenue, margin, and customer value last quarter? Channel-level KPIs do not answer this. Pipeline-influenced numbers do not answer this. The metrics that survive scrutiny are the ones already on the finance team's own scorecard, applied to the marketing-sourced portion of the business.
Forrester's planning guidance for B2B marketing executives names the specific dashboard mix that high-growth CMOs use to defend budget: annualized customer value, profitability, wallet share, retention, and engagement, anchored in customer-obsessed strategies rather than lead volume 12. That mix matters because each item maps to a finance concept the CFO already trusts. Annualized customer value sits next to LTV models the finance team has likely built for cohort planning. Profitability adjusts for the unqualified pipeline that inflates surface-level CAC. Retention connects marketing to the revenue base, not only to acquisition.
Customer experience belongs in this layer, not in a separate brand bucket. AMA reporting on CX-driven firms finds that companies linking CX measures to KPIs and financial outcomes report higher marketing ROI than peers who treat experience metrics as standalone satisfaction scores 8. The operational consequence: marketing leaders who include retention lift, repeat-purchase rate, and CX-tied revenue alongside acquisition cost present a contribution picture finance can audit against the general ledger, not a marketing narrative finance has to take on faith.
Attribution: The Question of Path
Attribution sits in the second layer because it answers a different question than contribution. Finance wants to know which touchpoints, in what sequence, deserve credit for the outcomes the first layer reported. This is the layer where most marketing teams over-invest and over-claim.
Multi-touch attribution models, whether first-touch, last-touch, linear, time-decay, or data-driven, assign credit using rules. They do not prove causation. A CFO who has seen the same conversion credited to three different channels under three different models has learned to treat attribution output as a planning input, not a verdict. The honest framing for the boardroom is that attribution describes the observed path to conversion, conditional on the model's assumptions, across the touchpoints the team can actually track.
The BGSU framework on digital marketing ROI emphasizes that credibility starts upstream of the model, in how marketing objectives and KPI goals are mapped to web analytics before any attribution logic is applied 5. Teams that define what counts as a qualified outcome, what a touch is, and which sessions are excluded as junk traffic give attribution models a clean substrate to work on. Teams that skip this step end up defending model outputs they cannot fully explain.
The operational takeaway is to present attribution as path evidence supporting a contribution claim, not as the claim itself. The next layer is what makes the claim causal.
Incrementality Testing: The Question of Causation
Incrementality testing is the layer that converts correlation into causal evidence. It answers the CFO's hardest question directly: how much of the reported revenue would have happened without this spend? Attribution cannot answer that. Outcome metrics cannot answer that. A holdout test, geo experiment, or ghost-bid study can.
The mechanics are straightforward, even when the execution is not. Marketing teams suppress a channel, audience, or geography for a defined period, then compare outcomes between the exposed and held-out groups. The delta is the incremental contribution. Paid social, branded search, retargeting, and display are the channels where holdout tests most often reveal that reported conversions overstate true lift, because the audience would have converted through another path. Conversely, upper-funnel video and content often show stronger incremental lift than last-touch dashboards credit.
This layer is also where the FTC-style evidentiary framing pays off. A claim that a channel produced $2.4 million in incremental revenue, supported by a documented holdout design with pre-registered hypotheses and a defined measurement window, meets the substantiation standard the FTC applies to external claims: truthful, not misleading, backed by evidence held before the claim is made 1. Internal claims that meet that bar tend to clear CFO review on the first pass.
The operational discipline is to run two or three well-designed incrementality tests per quarter on the channels with the largest spend, not to test everything at once.
Marketing Mix Modeling: The Question of Allocation
The fourth layer answers the allocation question: given everything spent across channels, pricing changes, distribution shifts, and external factors, how should next year's budget be divided? Deloitte's overview of marketing mix modeling describes it as a methodology that quantifies how factors like advertising, pricing, and distribution affect KPIs such as sales and revenue, and once a reliable model is built, firms can calculate ROI for each medium or channel and inform more effective budget allocation 4. That capability is what makes MMM the layer finance teams ask for by name when budgets exceed eight figures.
MMM works on aggregated data over longer windows, which is precisely why it complements the first three layers rather than replacing them. Outcome metrics describe what happened on the P&L. Attribution describes the observed path. Incrementality proves causation for specific interventions. MMM weighs all paid and unpaid drivers together, including channels that resist user-level tracking, like out-of-home, podcast sponsorships, and organic search, and quantifies how each contributed to the modeled KPI.
The honest caveat belongs in the executive conversation. MMM credibility depends on data quality, model specification, and the validation discipline applied. AMA's guidance on ROMI reinforces that strategic decisions need long-term growth measurement and changes in brand or customer relationship assets, not a single dashboard figure, and MMM is one of the few methods that operationalizes that view 2.
Stacked together, the four layers form a defensible chain:
- Outcomes establish what marketing contributed.
- Attribution shows the observed path.
- Incrementality proves causation.
- MMM informs the next allocation decision.
Each layer answers a question the previous layer cannot, and each refreshes on a different cadence, which is where the next problem starts.
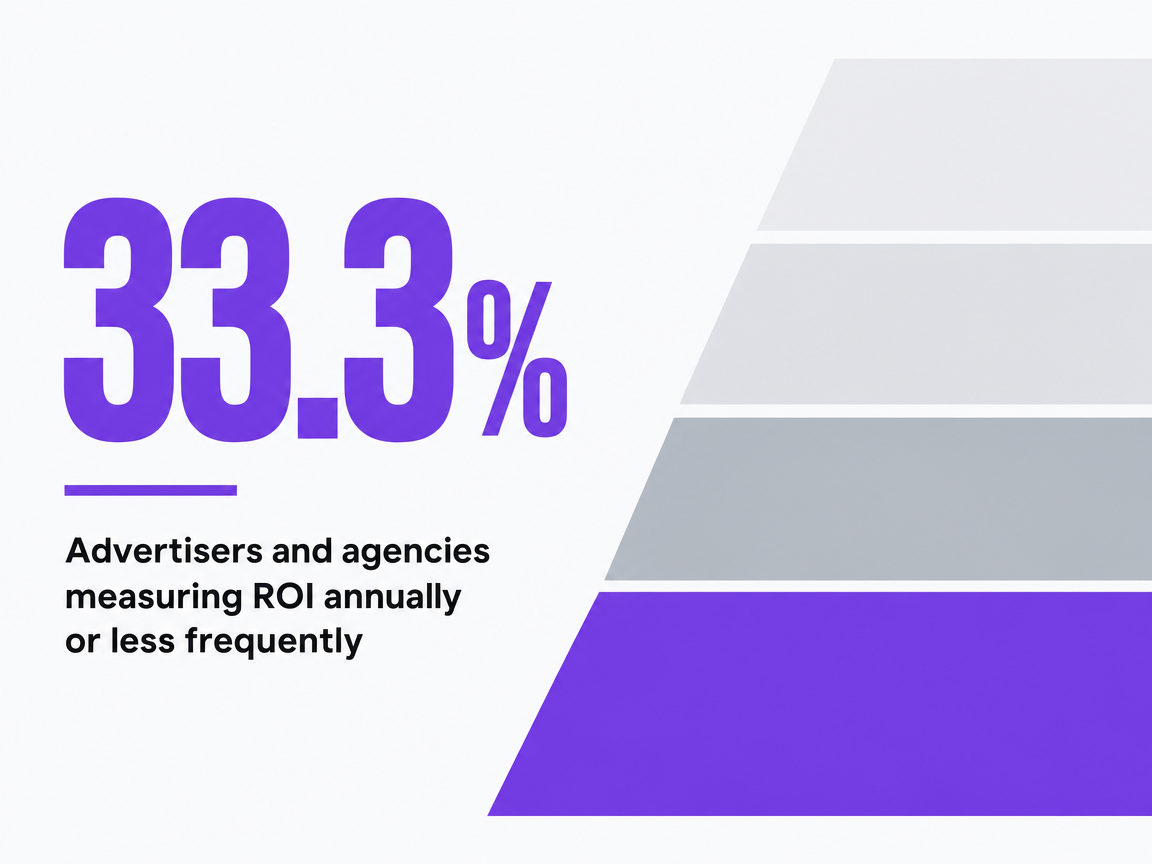 Advertisers and agencies measuring ROI annually or less frequently
Advertisers and agencies measuring ROI annually or less frequently
Validate measurable ROI from real campaign data now
Test-drive full campaign analytics and attribution using your own live marketing data, risk-free for seven days.
The Cadence Problem Behind Lost Budget Arguments
The four-layer stack only works if it runs on a rhythm executives can rely on. This is where most marketing organizations quietly fall apart. AMA reporting on measurement practices found that a third of advertisers and agencies measure ROI once a year or less, based on a survey of practitioners across both client-side advertisers and agency teams 7. Annual measurement is not a measurement system. It is a postmortem.
The cadence gap is the structural reason executive trust erodes, not weak metrics. A CFO who sees ROI evidence once a year has eleven months to form opinions from anecdotes, board chatter, and whatever spend variance shows up in monthly close. By the time the marketing team presents a defensible analysis, the narrative has already hardened. The numbers arrive too late to change minds.
A workable cadence assigns each evidence layer to its natural refresh window:
- Financial outcome metrics, the contribution layer, belong in the monthly finance package alongside revenue, margin, and retention figures the CFO already reviews.
- Attribution refreshes monthly as well, but with the explicit framing that it describes observed paths, not causation.
- Incrementality tests run on a rolling quarterly schedule, two or three at a time, sequenced so that one major channel test concludes each quarter.
- Marketing mix modeling refreshes semiannually or annually, because the model needs enough trailing data to remain stable and enough recency to remain relevant.
That rhythm produces a second benefit beyond evidence freshness. It changes the conversation in the room. When the CFO sees contribution metrics every month, an attribution view every quarter, and an MMM refresh against the annual planning cycle, the marketing function stops looking like a department that surfaces once a year to justify itself. It looks like a function that operates on the same reporting clock as finance, sales operations, and supply chain. Budget arguments are won between QBRs, not during them.
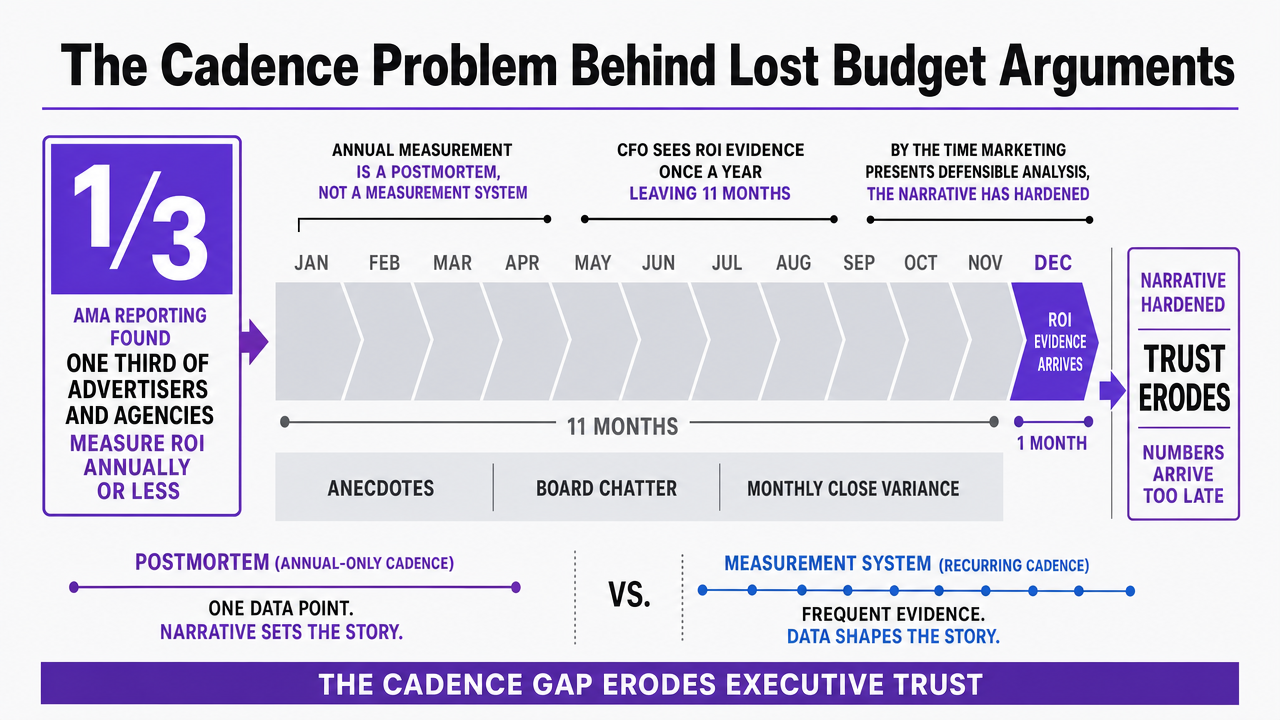 Visualize the AMA finding that one third of advertisers and agencies measure ROI annually or less, directly supporting the cadence argument with the cited statistic
Reconciling Short-Term Performance Proof With Long-Term Brand Value
The cadence discipline solves one problem and exposes another. A measurement rhythm tuned to monthly contribution reporting and quarterly incrementality tests rewards what is easiest to prove and quietly penalizes what is hardest. Brand investment, category creation, and the slow compounding of customer relationships rarely show up in a holdout test that ran for six weeks. Deloitte's 2026 CMO Survey captures this tension directly, noting internal debate between long-term brand building and short-term performance marketing as executives press for clearer ROI signals and budget allocation decisions follow 11.
The AMA's guidance on ROMI offers the cleanest reconciliation available. Tactical ROMI, derived from lift-and-cost analysis on specific campaigns, belongs in the monthly and quarterly evidence layers. Strategic measurement, which AMA argues should use long-term growth measurement and changes in brand or customer relationship assets, belongs in a separate annual review tied to planning, not performance 2. Mixing the two collapses the argument. A CFO who hears brand defended in the same breath as last quarter's paid search ROI hears hedging.
Marketing leaders who hold the line do two things. They report performance evidence on the finance team's clock without apology, and they reserve a distinct annual conversation for the assets that compound: brand consideration, customer relationship depth, and pricing power. Forrester's planning guidance for B2B executives reinforces this by including wallet share, retention, and annualized customer value in the dashboard mix, metrics that capture brand value through its financial expression rather than as a separate narrative 12. Brand stops competing with performance when its returns are denominated in the same currency.
Where AI-Assisted Measurement Actually Helps
AI-assisted measurement is the layer most often oversold and undersold in the same conversation. The honest framing starts with where the money is actually going. The CMO Survey reports that companies now spend 19.9% of marketing budgets on martech and project that share to reach 30.9% within five years, while only about 10% of companies report using large language models in marketing activities 10. The gap between martech spend and applied AI adoption is the operational story executives should hear: investment is committed, proven impact is still being built.
Inside the four-layer stack, AI earns its keep in narrow places:
- Machine-learning models improve incrementality test design by sizing holdout groups and detecting interference between concurrent experiments.
- Natural language processing reads recorded sales calls and intake conversations, turning unstructured signal into qualified-lead classification that finance can audit against booked revenue.
- Generative models compress the time between an MMM refresh and the executive narrative that explains it, which matters when the model output lands two weeks before a budget meeting.
Each use case maps to a measurement question already in the stack, not a new dashboard.
The places AI does not yet earn its keep deserve equal candor. The AMA's 2025 skills report frames proving ROI as a current competency gap among marketers, alongside data analytics and privacy 3. A tool cannot close a competency gap. Marketing leaders who present AI-assisted measurement as a force multiplier on a disciplined stack tend to keep budget. Those who present it as a replacement for the stack tend to lose it.
Benchmark and Attribute True Marketing ROI—No Manual Reporting Required
See how enterprise teams are using AI-powered call and channel analysis to quantify pipeline impact, link spend to qualified outcomes, and provide executive-ready ROI insights—without additional analyst overhead.
If You Manage Multiple Locations: How Intake Signal Fidelity Changes the ROI Denominator
For VPs running marketing across multiple locations in legal, dental, behavioral health, home services, or senior living, the ROI math changes in one specific way. The denominator is not channel spend, and the numerator is not raw lead volume. The denominator is spend divided by the share of leads that were actually qualified, and the numerator is booked revenue, not inquiries. Intake signal fidelity, meaning how accurately the team classifies what came through the phone, the form, or the chat, is what makes the calculation honest or misleading.
The reason this matters at the portfolio level is mechanical. When location-level intake teams misclassify leads, channel ROI rankings reorder. A paid search campaign that looks like the top performer on cost-per-lead can drop to third when call recordings reveal that a meaningful share of its inquiries were existing patients, wrong-number calls, or unqualified intent. A content channel that looked mediocre on volume can move to first when qualified-call classification corrects the denominator. The same spend, the same conversions in the dashboard, a different verdict.
A workable formula structure for multi-location operators looks like this:
| Variable | Definition | Illustrative Value |
|---|---|---|
| Channel Inquiries | All leads attributed to the channel | 1,000 |
| Qualified-Call Rate | Share verified as qualified intent | 62% |
| Lead-to-Booking Rate | Qualified leads that became bookings | 34% |
| Average Case or Job Value | Booked revenue per case | Variable by vertical |
| Channel Spend | Fully loaded cost for the period | Variable |
The output: Qualified Inquiries x Booking Rate x Average Case Value, divided by Channel Spend, equals true channel ROI. AMA reporting on CX-driven firms reinforces the upstream logic, finding that companies linking customer experience measures to financial KPIs report higher marketing ROI than peers treating those measures as standalone scores 8. Intake is where that linkage either holds or breaks.
The operational consequence for portfolio VPs is direct. Reclassifying even 15% of inquiries from qualified to non-qualified across locations changes which channels get next quarter's incremental dollar. Without intake signal fidelity, the four-layer stack runs on a corrupted denominator and the QBR slide defends the wrong winners.
The QBR Slide: A Budget-Defense Narrative Template
Most budget arguments are lost on a single slide. The slide that wins them is structured the way a finance memo is structured: claim, evidence, exception, ask. Marketing leaders who walk into the QBR with that order tend to leave with the budget. Those who walk in with channel performance tiles tend to leave with questions.
- The claim line states marketing's contribution in finance language: sourced revenue, sourced margin, retention lift, and annualized customer value, denominated in dollars. Forrester's planning guidance for B2B executives recommends that exact dashboard mix, including customer value, profitability, wallet share, retention, and engagement, because each item maps to a number the CFO already tracks 12. One line, four numbers, no channel names yet.
- The evidence row follows the four-layer stack in compressed form. Contribution metrics establish the result. Attribution shows the observed path that produced it. Incrementality cites the two or three causal tests completed that quarter, with holdout design and lift figures named explicitly. The MMM reference, refreshed semiannually, anchors the allocation logic for the coming period 4. Each row is one sentence. The detail lives in the appendix the CFO will read later.
- The exception row is what separates defensible slides from optimistic ones. It names the channel where evidence is weakest, the test that failed to reach significance, and the assumption most likely to be wrong. Borrowing from the FTC's substantiation logic, claims hold up better when the marketing team surfaces the limits before finance does 1. Executives who see the exception named in advance treat the rest of the slide as honest.
- The ask closes the narrative. It connects the next allocation decision to the evidence directly above it, names the specific reallocation in dollar terms, and identifies the test that will validate or refute the move by the next QBR. A platform that consolidates content, paid, and call intelligence in one approval workflow, such as Vectoron, shortens the distance between that decision and the evidence it produces.
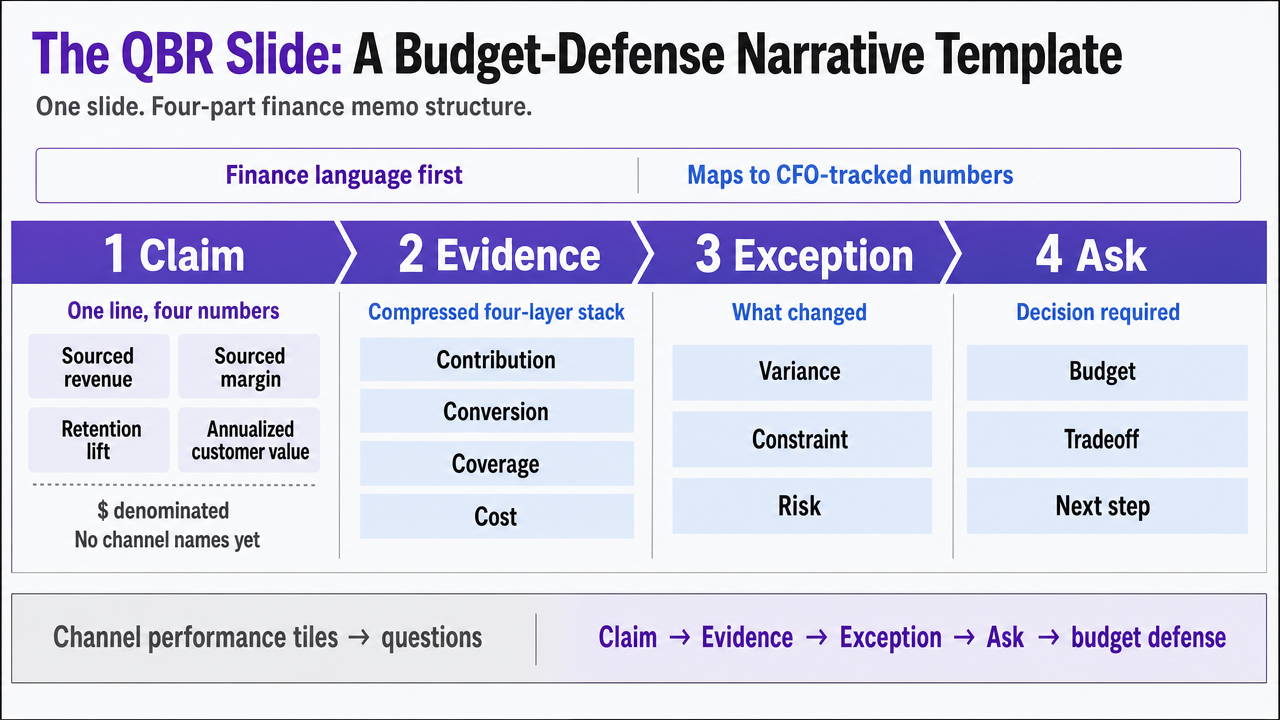 Visualize the four-part QBR slide structure (claim, evidence, exception, ask) as a process framework directly mirroring the section's prescribed narrative template
Frequently Asked Questions
References
- 1.Advertising and Marketing | Federal Trade Commission.
- 2.Using Return on Marketing Investment Effectively.
- 3.The Skills Marketers Need in 2025 and Beyond.
- 4.Maximize ROI with Marketing Mix Modeling for Advertising Success.
- 5.Proving Marketing ROI: A Digital Marketing Framework.
- 6.5 Things CMOs Should Understand About Market Research.
- 7.Marketers Missing Data They Need, Context to Find It.
- 8.CX Rx: Innovating and Competing on Customer Experience.
- 9.Higher Ed Institutions Learning to Socialize.
- 10.The CMO Survey: Marketers Spend on New Technologies as They Battle Usage and Impact.
- 11.2026 CMO Survey | Deloitte US.
- 12.Planning Guide 2023: B2B Marketing Executives.