
Key Takeaways
- Treat the Forrester 8% B2B average as a midpoint anchor, not a target, and set a band — 8% floor, 12–15% ceiling for 30%+ growth plans 7, 8.
- Build the budget across four layers: revenue anchor, capability readiness, channel marginal ROI, and payback horizon, with capability gaps funded before channel expansion 1.
- Reallocate before requesting more — granular portfolio reviews typically free 10–20% of existing spend by shifting dollars from low-ROI to higher-ROI activity 5.
- Refuse the single-number ROI ask; substitute cohort payback by channel, incremental pipeline contribution, and NPV or IRR for multi-period content investments 9, 11.
Why the 8% Anchor Fails Growth-Stage SaaS
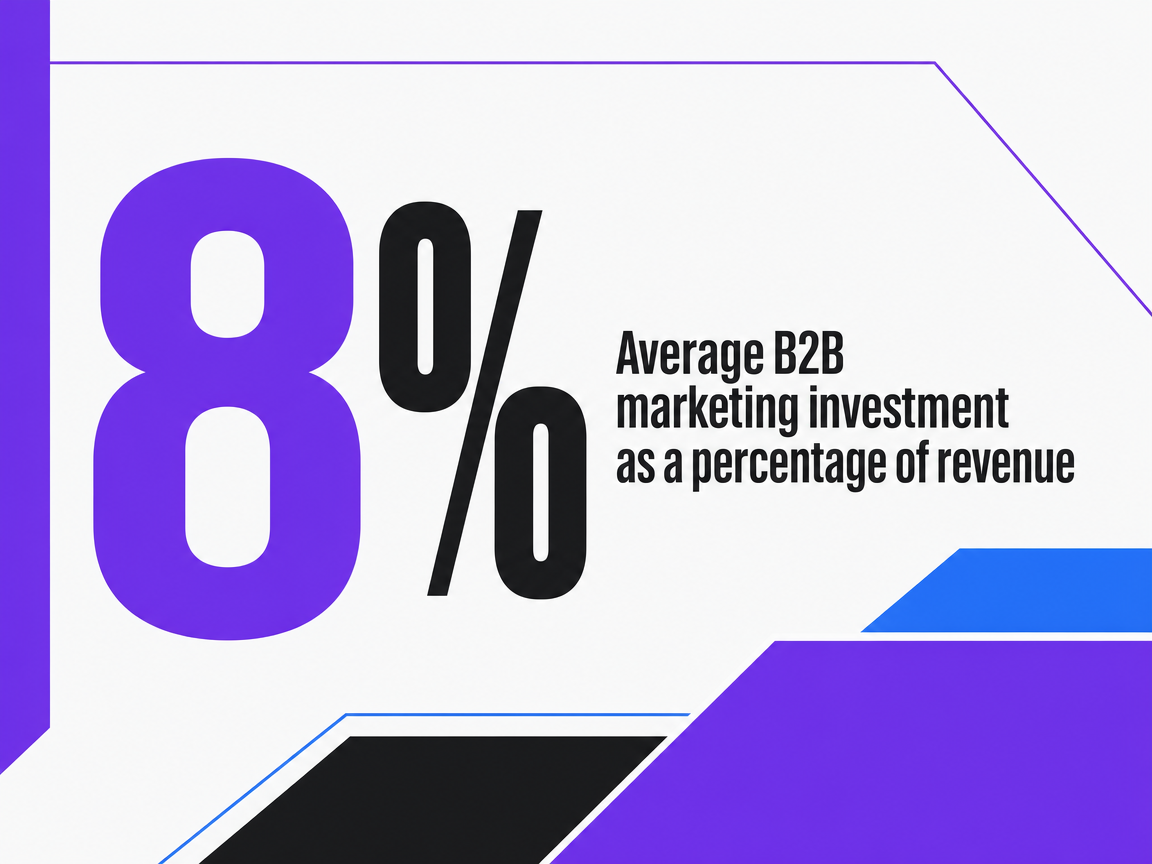
Forrester's 2024 B2B Marketing Budget Benchmarks survey found that the average B2B firm invests roughly 8% of annual revenue in marketing, with high-growth firms allocating above that average and lower-growth firms below it 7. The figure is the most widely cited budget anchor in B2B planning conversations, and it is also the most widely misused. Forrester's own commentary on the report cautions against treating 8% as a target rather than a midpoint, because the average pools firms across industries, revenue bands, and growth ambitions that bear little resemblance to one another 7, 8.
For a SaaS VP Marketing operating between $10M and $100M ARR, the gap between the average and the operating reality is wider than the headline suggests. The Forrester pool blends mature B2B firms with flat or single-digit growth alongside companies pursuing 40%+ year-over-year expansion. A growth-stage SaaS company that benchmarks to the mean is, by definition, benchmarking to a slower-growing peer set.
Three structural differences make the 8% figure a weak ceiling for SaaS:
- Gross margin profile. Software margins above 70% support reinvestment ratios that lower-margin B2B sectors cannot sustain.
- Payback economics. Subscription revenue compounds, so a dollar spent acquiring a customer in year one returns across multiple periods — a structure that single-period ROI math underprices 11.
- Capability concentration. Digital marketing capability itself drives measurable profitability gains beyond classic marketing capabilities, which means the productive ceiling on spend depends on what the team can execute, not on a peer average 1.
The useful move is to treat 8% as the opening anchor in a four-layer stack — revenue, capability, channel ROI, and payback — and to defend any deviation from it with the variables that actually drive the right number.
The Four-Layer Budget Stack
Layer One: The Revenue Anchor
The revenue anchor is where most planning conversations start, and for good reason — it gives finance a defensible starting point that ties spend to top-line size. Forrester's 2024 B2B Marketing Budget Benchmarks survey places the B2B average at roughly 8% of annual revenue, with growth ambition and industry mix driving meaningful dispersion around that mean 7, 8. For a SaaS VP Marketing, the right move is to set the anchor as a band rather than a point.
A practical band for $10M–$100M ARR SaaS sits above the B2B average, because Forrester's pool dilutes software-margin economics with lower-growth sectors 7. A reasonable working range is 8% as the floor (parity with the average) and 15% or higher as the ceiling when the company is pursuing 30%+ annual growth. The exact ceiling is a strategy choice, not a benchmark — it depends on how aggressively the company is buying future revenue versus harvesting current revenue.
Two anchor disciplines protect the number from drift. First, fix the denominator: forward-looking revenue, not trailing twelve months, since marketing spend produces revenue in a later period. Second, separate marketing spend from sales spend in the chart of accounts. Forrester's own caveat notes that respondent classification of marketing-versus-sales costs influences the 8% figure, which means internal comparability matters more than external precision 8.
Layer Two: The Capability Anchor
The revenue anchor sets a band. The capability anchor decides where inside that band the number lands. Peer-reviewed research on digital marketing capabilities finds that those capabilities contribute to firm profitability beyond classic marketing capabilities, and that the contribution depends on whether digital and classic capabilities act as complements or substitutes in a given organization 1. Translated for budget setting: the productive ceiling on spend is gated by what the team can actually execute, not by what the budget will purchase.
A VP Marketing asking for 12% of revenue should be able to answer four operational questions before that ask reaches the CFO:
- Attribution maturity. Can the team trace pipeline to channel within a defensible model, or is allocation driven by self-reported lead source?
- Production throughput. Does the content function ship at a cadence that keeps SEO compounding, or does spend on briefs outpace published output?
- Bid and creative iteration. Does the paid team run weekly hypothesis cycles, or are accounts on autopilot between quarterly reviews?
- Backlink discipline. Is link acquisition tied to ranking targets on revenue-relevant pages, or is it volume reporting?
Where one or more of these answers is weak, additional dollars buy diminishing returns. The academic evidence is direct on this point — capability is the carrier of profitability, not channel spend in isolation 1. The practical rule is to fund capability gaps (analytics infrastructure, production capacity, attribution tooling) before funding channel expansion. A budget that adds $400K of paid media on top of a team that cannot close the attribution loop will underperform a budget that spends the same dollars on closing the loop first.
Layer Three: The Channel ROI Anchor
With the revenue band set and capability honestly assessed, the channel ROI anchor allocates dollars across SEO content, paid search, and backlink acquisition based on the marginal return each channel is delivering inside the specific account. The discipline here is granular ROI estimation, not channel-average benchmarks pulled from third-party reports. McKinsey's analysis of marketing reallocation argues that leaders who treat marketing as an investment portfolio and make granular ROI decisions across segments, channels, and initiatives can find 10–20% in savings by shifting dollars away from low-ROI activity 5.
The anchor logic is straightforward. Rank in-flight initiatives by marginal ROI — the return on the next dollar, not the average dollar — and reallocate from the bottom of the list to the top until marginal returns equalize across channels. In SaaS budgets, the usual pattern is that mature paid search keywords have decaying marginal ROI while mid-funnel SEO content and authority-building backlinks have rising marginal ROI as the domain compounds.
Two caveats keep the anchor honest. Bounded uplift examples — such as McKinsey's finding that data-driven personalization can lift revenues by up to 15% and marketing ROI by up to 30% — are upper bounds that depend on data and analytics foundations being in place 6. Quoting the ceiling without the precondition is how budget cases lose credibility in the second CFO meeting. The second caveat is measurement scope: some channels, particularly social and brand, resist clean ROI attribution because conventional models miss customer-side effort and engagement effects 10. Allocate to those channels on contribution logic, not ROI parity.
Layer Four: The Payback Anchor
The fourth layer is the one most often skipped, and it is the one a CFO will press hardest. SaaS revenue compounds across subscription periods, which means a single-period ROI calculation systematically underprices SEO content, brand investment, and any program with a delayed payoff curve. Standard ROI math handles short-cycle decisions cleanly, but long-term projects are better complemented with NPV or IRR because the timing of returns matters 11. The academic literature on ROMI reinforces the point: one-number ROI metrics are often too simplistic for strategic decisions, and ROMI should be derived case by case with explicit treatment of long-term growth measurement 9.
The payback anchor forces three time-aware decisions into the budget:
- Cohort payback windows by channel. Paid search cohorts typically pay back faster than SEO cohorts; both should be modeled to their own window, not blended.
- Multi-period evaluation for content and SEO. Treat content programs as capital-like investments evaluated on cumulative cohort contribution over 18–36 months, not on first-quarter pipeline.
- Profit-based ROI, not revenue-based ROI. Where gross margin varies by customer segment, marginal contribution beats topline return 11.
This is the anchor that converts a budget request from a percentage argument into an investment case. It also gives the VP Marketing the language to refuse a CFO demand for a single ROI number on a multi-period content program — a refusal that holds up because the academic consensus supports it 9.
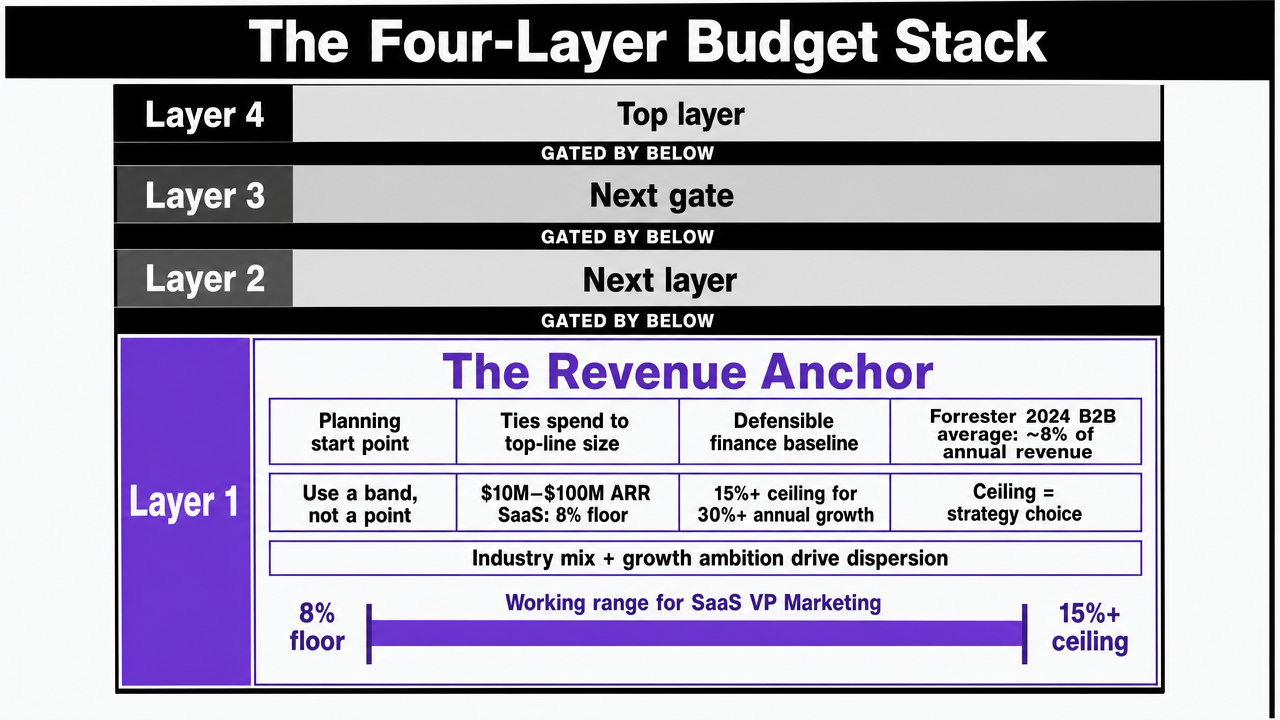 Visualize the four-layer budget framework that structures the entire section, giving readers a reference for how the layers stack and gate each other
Reallocation Beats Across-the-Board Cuts
When revenue softens or the CFO asks for a marketing trim, the default move is a flat percentage cut across every line. McKinsey's research on marketing resiliency argues the opposite discipline: treating marketing as an investment portfolio and making granular ROI decisions across segments, channels, and initiatives lets companies find 10–20% in savings by shifting dollars from low-ROI activity to higher-ROI activity, rather than reducing every line proportionally 5. The savings band matters because it represents headroom that already exists inside the current budget — before any incremental ask reaches finance.
The reallocation logic has three operational consequences for a SaaS budget.
- The first conversation is internal, not with finance. A 10–20% efficiency band on a $1.6M budget is $160K–$320K of releasable spend. That number reframes the planning meeting from "how much more do we need" to "what does the bottom of our portfolio look like, and what would the top do with the freed dollars."
- Reallocation requires marginal ROI visibility, not average ROI reporting. A paid search campaign with a 4x average return can have a marginal return below break-even on its last 20% of spend. Without tracking the next-dollar return by initiative, the freed budget cannot be identified with confidence.
- The reinvestment target should be capability-gated. Shifting $200K from decaying paid keywords into SEO content production only pays off if the content team can absorb the throughput. Reallocation that outruns execution capacity converts efficiency gains into work-in-progress backlog.
The McKinsey framing also gives the VP Marketing a defensive position in downturn conversations. Reflexive cuts erode long-term growth and brand equity, and the firms that hold or rebalance investment through volatility tend to compound advantage 5. A budget defense built on documented reallocation — here is what we cut, here is what we funded, here is the marginal ROI delta — is harder to override than a defense built on protecting the prior year's number. The work is unglamorous, but it usually produces the first six figures of growth-stage budget without a single new line item.
Test Real ROI Benchmarks on Live Campaigns
Validate your digital marketing budget decisions with measurable outcomes from actual published campaigns during your trial period.
A Worked Allocation: $20M ARR at the 8% Benchmark
Applying the revenue anchor to a $20M ARR B2B SaaS at the Forrester average produces a $1.6M annual marketing budget 7. The table below shows one way to distribute that budget across the channels a SaaS growth team typically owns — SEO content production, paid search, backlink acquisition, and the measurement and operations overhead that ties them together. The channel splits are illustrative working assumptions for a growth-stage account, not benchmarks. The reallocation delta column applies the McKinsey 10–20% efficiency band to each line, representing dollars a portfolio review would likely free for higher-marginal-ROI redeployment 5.
| Line item | Share of budget | Annual spend | Reallocation delta (10–20%) |
|---|---|---|---|
| SEO content production | 35% | $560,000 | $56,000 – $112,000 |
| Paid search | 40% | $640,000 | $64,000 – $128,000 |
| Backlink acquisition | 15% | $240,000 | $24,000 – $48,000 |
| Measurement and ops overhead | 10% | $160,000 | $16,000 – $32,000 |
| Total | 100% | $1,600,000 | $160,000 – $320,000 |
Two readings of the table matter for a budget defense. The first is the absolute spend by channel, which finance will compare to prior-year actuals and to whatever channel-level marginal ROI the team can document. The second, more useful reading is the right-most column: $160K to $320K of releasable spend sits inside the existing $1.6M before any incremental ask is filed 5. That headroom is the lever a VP Marketing should pull first, because it is funded by efficiency rather than by a fresh approval cycle.
Three assumptions in the table are worth flagging when the worksheet moves into a spreadsheet. The 8% revenue ratio is a B2B average that under-serves growth-stage SaaS, so the input cell should be a band — 8% as floor, 12–15% as ceiling for 30%+ growth plans — rather than a fixed point 7, 8. The 10% line for measurement and operations is not optional infrastructure; it funds the attribution, tagging, and reporting work that makes every other line's ROI claim defensible. And the reallocation delta is a one-time efficiency band, not a recurring annual gain — the second pass through the portfolio finds less, which is why marginal ROI visibility has to be built into the operating rhythm rather than reserved for downturn planning.
 Average B2B marketing investment as a percentage of revenue
Average B2B marketing investment as a percentage of revenue
Coordination Cost: The Budget Line Most VPs Forget
Most ROI models assume the SEO team, the paid team, and the backlink program operate as a single coordinated unit. They almost never do. Briefs get written twice, landing pages get optimized for keywords the paid team has already deprioritized, and link acquisition targets pages the SEO team plans to consolidate next quarter. The friction is real, and it sits inside the budget whether it has a line item or not.
The cost shows up in three places. Duplicated production work, where copy gets rewritten because the paid and SEO functions briefed it separately. Wasted media, where ads route traffic to pages the SEO team has not yet conversion-tested. And measurement drift, where each channel reports its own attribution model and the blended ROI number nobody believes ends up in the board deck. The academic evidence on digital marketing capability is direct here: capability is what carries channel spend into profitability, and capability lives in the connective tissue between functions, not inside any single channel 1.
A defensible budget treats coordination as funded infrastructure rather than as overhead the team absorbs informally. In the $20M ARR worked example, the 10% measurement and operations line carries part of this load — tagging, attribution, shared reporting — but coordination work proper sits across briefing standards, shared keyword and landing page maps, and a single source of truth for which pages each channel is investing behind.
A practical sizing rule for growth-stage SaaS: budget 8–12% of the channel spend total for coordination work, including the analytics, the operating cadence, and whatever tooling holds the shared map together. Underfunding it is what produces the blended ROI gap that benchmark articles attribute to channel underperformance and that the actual operator recognizes as friction. McKinsey's reallocation thesis applies here too — the dollars freed by trimming low-ROI activity often fund coordination capability before they fund new channel spend, because uncoordinated reinvestment loses the efficiency it just captured 5.
Why a Single ROI Number Will Lose the CFO Conversation
CFOs ask for one number because one number fits in a board deck. The problem is that the one-number version of marketing ROI is the version most likely to be wrong, and the academic literature on Return on Marketing Investment is direct about why: ROMI should be derived case by case, with explicit treatment of long-term growth measurement, because a single yardstick collapses fundamentally different investment horizons into a misleading average 9.
The collapse hurts SaaS budgets in three specific ways. A paid search campaign that converts inside thirty days and an SEO content program that compounds across eighteen months produce returns on different clocks. Averaging them produces a blended figure that under-credits the long-cycle program in any given quarter and over-credits it in any retrospective cut. A brand or social investment that influences pipeline through engagement and consideration resists the same revenue-attribution model that works for bottom-funnel paid search, because conventional ROI math misses customer-side effort and engagement effects 10. And revenue-based ROI hides margin variance — a customer segment with strong topline returns but compressed gross margin will look healthier than it is until profit-based contribution is substituted in 11.
The defensible alternative is a small set of metrics that travel together. Cohort payback by channel, so the paid number and the content number are not forced onto the same clock. Incremental contribution to pipeline rather than last-touch revenue, so attribution maturity gates the claim. Profit-based ROI on margin-sensitive segments, complemented with NPV or IRR for content and SEO investments whose returns accrue across multiple periods 11. This is what ROMI looks like when it is derived case by case rather than reported as a single firm-wide ratio 9.
The language that holds up in the CFO meeting is not "our marketing ROI is 4.2x." It is "paid search pays back inside one quarter at this CAC, content compounds against a twenty-four-month cohort window at this incremental contribution rate, and here is the profit-based return on the segments where margin varies." That answer is harder to write and harder to dismiss.
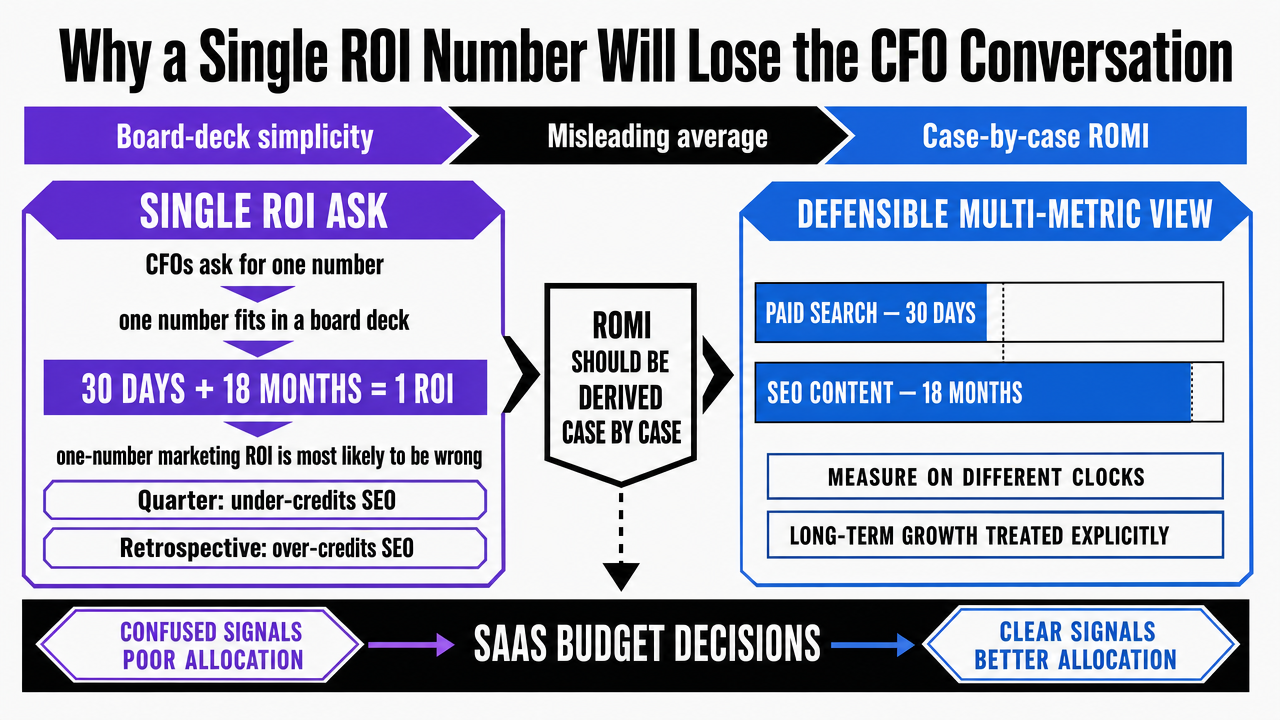 Visualize the comparison between the single-number ROI ask and the defensible multi-metric alternative the section prescribes
Access Industry Benchmarks to Inform Your Next Digital Marketing Budget
Request a tailored briefing on the latest digital marketing ROI benchmarks, including channel-specific performance data and budget allocation insights for agencies and enterprise SaaS teams.
Measurement Plumbing Before Budget Approval
The most common reason a budget ask fails in the CFO meeting is not the size of the number. It is that the prior year's number cannot be defended at the channel level. Without measurement infrastructure in place before the request, every ROI claim collapses into self-reported lead source and last-touch attribution — neither of which survive scrutiny.
Three pieces of plumbing have to be operational before a budget increase is filed. KPIs and tag management need to be defined up front rather than reverse-engineered from campaign output; the discipline of establishing measurement architecture before spend, not after, is what separates analytics from reporting 3. Website analytics need to be translated into ROI and sales conversion, not left as traffic and behavior volume — the activity data is the input, not the answer 4. And the basic comparison of marketing and sales costs against revenue generated has to be running as a standing report, not assembled for the planning cycle 2.
The operational rule is simple: if the team cannot produce marginal ROI by channel from existing data in under a week, the next budget conversation should fund measurement before it funds media.
Defending the Number: Language for the CFO Meeting
The budget meeting is not won on the slide that shows the ask. It is won on the three sentences the VP Marketing uses when the CFO pushes back. Each sentence has to do work that a percentage figure cannot.
The first sentence frames the anchor as a band and names the variable that moves it.
"Our spend sits above the B2B average because the forward growth plan requires it, and the band moves with the growth target, not with the prior year's actual"
7. The second sentence converts the request from a line-item defense into a portfolio defense.
"We have identified the bottom of our current portfolio and reallocated from it before filing this ask, which is consistent with how granular ROI reviews typically free 10–20% of existing spend"
5. The third sentence refuses the single-number trap without sounding evasive.
"Paid search pays back inside one quarter at this CAC; the content program is evaluated on cumulative cohort contribution across a twenty-four-month window, because timing matters for multi-period investments"
Three sentences. Anchor, reallocation, payback. That is the version of the number a finance audience can sign.
Frequently Asked Questions
References
- 1.The value relevance of digital marketing capabilities to firm performance - PMC.
- 2.Marketing and sales | U.S. Small Business Administration - SBA.
- 3.6 Important Factors To Consider for Digital Advertising in Government.
- 4.How to Use Website Analytics Strategically.
- 5.Beyond belt-tightening: How marketing can drive resiliency during uncertain times.
- 6.What is personalization?.
- 7.The Average B2B Firm Invests 8% Of Revenue In Marketing.
- 8.2024 B2B Marketing Budget Benchmarks: Overview.
- 9.Return on Marketing Investments (ROMI) Dominique M. Hanssens ....
- 10.Can You Measure the ROI of Your Social Media Marketing?.
- 11.What is ROI and how do you calculate return on investment?.
- 12.Measuring Success and ROI - EdTech Books.