
Key Takeaways
 Reduction in customer acquisition costs from personalization
Reduction in customer acquisition costs from personalization
- Most healthcare ROI calculators fail because the denominator omits allocated overhead, agency fees, and brand spend, while the numerator counts gross revenue instead of contribution margin 5.
- A defensible calculator runs on seven inputs—activity cost, allocated overhead, leads, booked appointments, show rate, contribution-based LTV, and attribution window—each traceable to a system of record 12.
- ROMI math is short, but the figure that runs the program is marginal return on the next dollar, not the blended average that defends it 5, 8.
- Attribution model selection decides which channel gets credit and which gets defunded; last-click systematically understates demand-creation channels that upstream conversions depend on 9, 10.
- Platform attribution rules reshape bidding and pacing behavior, so ROI comparisons across years or vendors require logging the model and lookback window alongside every input 11.
- Lifetime value must sit on contribution margin, segmented by service line, bounded by a stated retention window, and refreshed against actual cohort behavior on a fixed cadence 1, 5.
- Multi-location rollups require separating location-specific spend from account-level spend and documenting the allocation rule on the same row as the figure, not in a footnote 5, 6.
- AI-driven personalization can compress costs and lift revenue, but the gains only register against a pre-AI baseline holding attribution, LTV, and allocation rules constant 3, 4.
Why Most Healthcare Marketing ROI Calculators Report Fiction
A regional dermatology platform recently presented a 612% marketing ROI to its private equity sponsor. The spreadsheet was clean. The board deck was confident. The number was fiction. The denominator excluded allocated overhead, agency fees, and shared brand spend. The numerator counted gross revenue per booked appointment instead of contribution margin, and credited every conversion to the last paid click—ignoring the upper-funnel display and organic touches that economists have repeatedly shown carry causal weight 9, 10.
Most ROI calculators marketed to healthcare operators repeat this pattern. They borrow the AMA's baseline schema—activity cost, leads, sales, sales value—and stop there 12. That schema works for a single-product B2B campaign. It collapses inside a multi-location operator running paid search across 40 markets, organic content across service lines, and brand campaigns that lift demand everywhere at once.
The SBA frames ROI correctly: an ongoing comparison of marketing and sales costs against the revenue they generate, updated as plans evolve 1. The historical financial definition is equally direct—a ratio or percentage where 1:1 equals a 100% return 8. Neither definition is the problem. The problem is what gets fed into the formula. The sections that follow rebuild those inputs for an operator answering to a CFO, not a clicks dashboard.
The Input Integrity Problem
Where the Numerator and Denominator Break
Most marketing ROI calculators fail in the same two places. The denominator omits real cost. The numerator overstates revenue. Both errors compound when an operator runs dozens of campaigns across multiple locations.
On the cost side, the typical spreadsheet captures media spend and creative production. It leaves out allocated salary for the in-house team, the percentage of agency retainer attributable to the activity, martech subscriptions, analytics tooling, and the brand campaigns that lift demand for every paid keyword downstream. UCLA Anderson's ROMI guidance is explicit on this point: tactic-level ROI requires a full marketing cost analysis, not just direct media 5. A calculator that excludes overhead returns a number that looks defensible until a CFO opens the GL.
On the revenue side, the common error is counting top-line booking value as if it were contribution. A new patient visit at a dermatology clinic generates gross revenue, but the operator keeps a fraction after payor mix, no-shows, refunds, and variable cost of care. Trade.gov's analytics guidance treats the calculator's job as establishing cause-and-effect between digital activity and sales, which requires both sides of the ledger to reflect reality 6. Until allocated overhead enters the denominator and contribution replaces gross revenue in the numerator, the percentage on the dashboard is decorative.
Seven Inputs a Defensible Calculator Requires
The AMA's spreadsheet calculator runs on four inputs: activity cost, number of leads, number of sales, and sales value. It produces marketing ROI in dollars, ROI as a percentage, and cost per lead 12. That schema is the right starting point for an email campaign or a single event. It is insufficient for a healthcare operator running paid search, organic content, programmatic display, and reputation work across a service footprint.
A defensible healthcare marketing ROI calculator requires seven inputs, extending the AMA baseline:
Activity cost : The direct spend on the campaign or channel under measurement.
Allocated overhead : The share of in-house salary, agency fees, tooling, and brand spend assigned to that activity.
Leads : Form fills, calls, and chat conversations attributed to the activity within the measurement window.
Booked appointments : Separates intent from action and is the first input where most calculators lose accuracy.
Show rate : The percentage of booked appointments that convert to an in-clinic visit, since a 70% show rate and a 90% show rate produce materially different ROI on identical lead volume.
Average patient lifetime value : Calculated on contribution margin rather than gross revenue and segmented by service line where appropriate.
Attribution window : Fixes the time boundary for both cost and revenue and prevents the calculator from crediting a campaign for visits it did not influence.
Digital.gov's measurement guidance reinforces why this schema matters: goals, KPIs, tagging discipline, and auditable review keep the inputs honest as campaigns scale 7. The calculator that survives a CFO review is the one whose seven inputs can each be traced to a system of record, not estimated in a meeting.
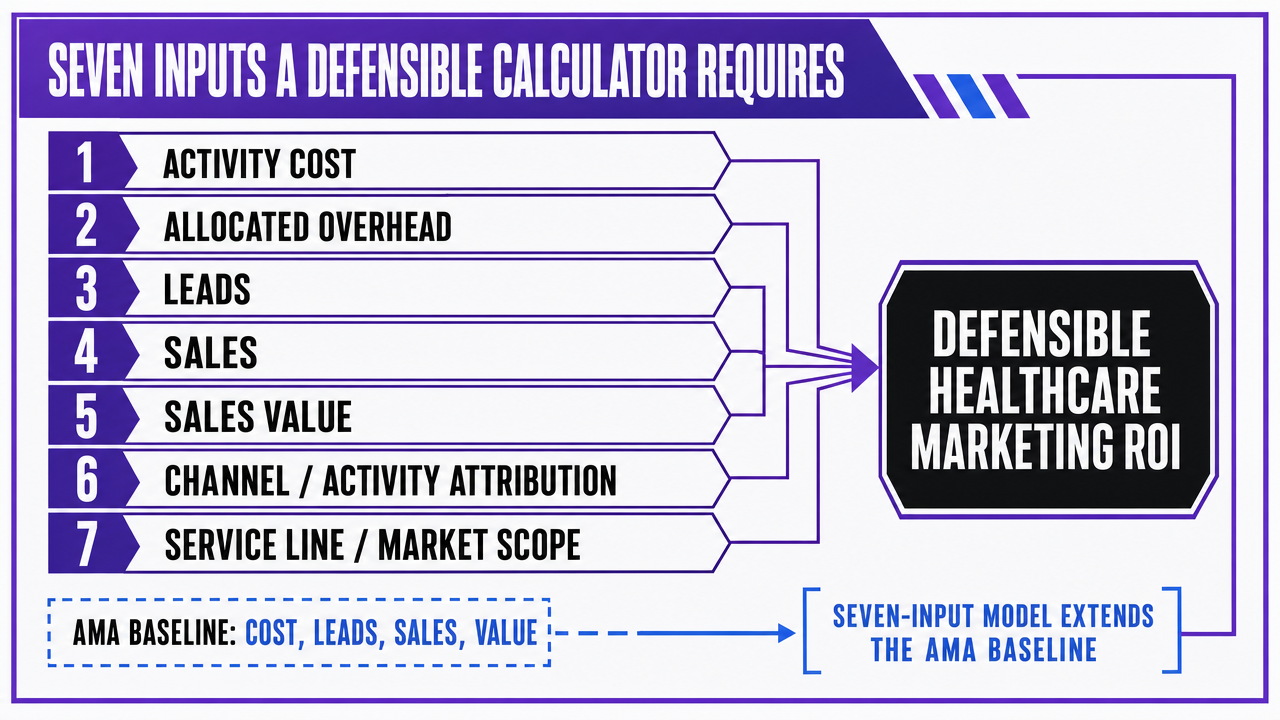 Visualize the seven required inputs of a defensible healthcare marketing ROI calculator as a structured input schema, directly supporting the section's enumerated list
The Formula, Without the Beginner Detour
With the seven inputs defined, the math is short. ROMI, expressed as a percentage, equals attributed contribution minus fully-loaded marketing cost, divided by fully-loaded marketing cost, multiplied by 100. A 1:1 return is 100%, which is the floor at which marketing breaks even on a fully-burdened basis 8. Anything below that line is a subsidy, not a return.
Attributed contribution is the product of leads, booked-appointment rate, show rate, and average patient LTV calculated on contribution margin. Fully-loaded marketing cost is activity cost plus allocated overhead, bounded by the attribution window. UCLA Anderson's guidance pushes operators one step further: for tactical decisions, the relevant figure is marginal ROMI—the return on the next dollar—not the blended average across the program 5. A channel posting 180% blended ROMI can still be unprofitable at the margin, which is the number that should drive budget reallocation. The blended figure defends the program. The marginal figure runs it.
Test True Campaign ROI Scenarios In Real Time
Measure actual returns from published content using your own data and workflow during a risk-free trial.
Attribution Choice Is an ROI Decision, Not a Reporting Preference
How Last-Click Distorts Channel Credit
Attribution is not a reporting setting. It is the rule that decides which channel gets credit for a booked appointment, and that decision changes the ROI percentage attached to every line of the budget. A calculator that defaults to last-click—still the most common configuration in healthcare ad accounts—systematically understates the channels that create demand and overstates the channels that harvest it.
The Stern attribution work frames the problem as causal inference, not bookkeeping: assigning credit across touchpoints requires a model of how each interaction shifted the probability of conversion, not a record of which one came last 9. Harvard Business School research on display and search advertising sharpens the consequence. Search and display ads do not operate independently; they exhibit significant interaction dynamics, and accounting for those dynamics raises measured effectiveness and ROI over time 10. A display impression that lifts branded search volume two weeks later receives zero credit under last-click, while the branded search campaign that captures the click receives full credit for revenue it did not originate.
For a multi-location dermatology or urgent care operator, the distortion is operationally expensive. The calculator reports paid search at 400% ROMI and programmatic display at 60%, and the budget meeting reallocates dollars out of the channel that was building the demand the search campaign converts. Six months later, branded search volume softens, cost per click rises, and the headline ROMI on search compresses—because the upstream layer was defunded based on a measurement artifact. A defensible calculator treats attribution model selection as a primary input, documents which model produced the figure, and runs the same revenue against at least one alternative model to surface the spread.
Platform Rules Change Incentives, Not Just Numbers
Attribution rules set by ad platforms do more than reshape reports. They reshape behavior. Wharton research on attribution and compensation design in online advertising shows that the algorithms used in ad auctions affect the strategic interactions between advertisers and publishers, not just the credit assigned after the fact 11. When a platform shifts from last-click to data-driven attribution, bidding logic, budget pacing, and creative testing inside that platform all adjust to the new credit rule. The ROI number moves because the system underneath it is now optimizing toward a different objective.
For healthcare marketing leaders, the operational consequence is that ROI comparisons across years, across platforms, or across agency transitions are not apples-to-apples unless the attribution configuration is held constant or explicitly reconciled. A calculator that pulls revenue from Google Ads, Meta, and a CRM in the same row without recording each platform's attribution window and model is averaging incompatible numbers. The fix is procedural: log the attribution model and lookback window alongside every spend and revenue input, and flag any period where a platform changed its default. Without that audit trail, the ROMI on the dashboard is a moving target the CFO cannot defend.
Patient Lifetime Value as the Revenue Anchor
Every percentage the calculator produces is a function of the LTV figure feeding the numerator. Anchor it to first-visit revenue and the program looks underwater. Anchor it to a fully-loaded lifetime contribution figure and a paid search campaign that loses money on visit one can clear 300% ROMI across the patient relationship. Neither extreme is automatically correct. The discipline is choosing a defensible LTV definition and applying it consistently across channels, locations, and reporting periods.
A workable LTV input has four properties:
- It is built on contribution margin, not gross revenue, so payor mix, refunds, and variable cost of care are already netted out.
- It is segmented by service line, because a cosmetic dermatology patient and a medical dermatology patient produce different revenue curves over different time horizons.
- It is bounded by a stated retention window—24 months, 36 months, or the average payor cycle—so the figure does not drift with optimistic assumptions.
- It is recalculated on a fixed cadence against actual cohort behavior, the kind of ongoing comparison the SBA describes as the management discipline behind ROI 1.
UCLA Anderson's ROMI work reinforces the point: tactical decisions require lift against top-line performance over a long enough horizon to capture the actual return, not a snapshot of the first transaction 5. The calculator that uses first-visit revenue defunds acquisition channels that build retention. The calculator that uses uncapped lifetime revenue inflates every ROMI figure on the page. The defensible version sits between those errors and documents its retention window on the same row as the spend.
Rolling Up Multi-Location Performance Into One Number
If you operate ten or more locations: the allocation problem
For operators running ten or more sites, the ROI calculator stops being a single equation and becomes an allocation problem. Two cost categories drive the distortion:
- Location-specific spend: paid search campaigns geo-targeted to a single market, local SEO work tied to a specific Google Business Profile, and reputation management for that site's review surface.
- Account-level spend that benefits every location at once: brand campaigns, the corporate website, account-wide content production, technical SEO infrastructure, and backlink work that lifts domain authority for all sites simultaneously.
Most calculators treat both categories the same way, either dividing all spend evenly across locations or tagging it to whichever site captured the conversion. Both methods produce ROMI figures that do not reconcile to the GL. Even division penalizes high-performing locations with the cost of underperforming markets. Last-touch tagging credits the account-level brand investment to one zip code.
The defensible approach separates the two categories at the input layer. Location-specific spend is allocated directly to the site it served. Account-level spend is amortized across locations using a stated rule—revenue share, patient volume share, or equal weighting—and the rule is documented on the same row as the figure. UCLA Anderson's ROMI guidance applies cleanly here: the tactic-level return requires a marketing cost analysis that captures both direct and shared costs, not just the line items easiest to pull 5.
A Location-Level Rollup Table
The rollup table that survives a CFO review has six columns and one row per location, with a totals row that produces the account-level ROMI figure. Each variable below is defined, not invented, because real values come from the operator's systems of record.
| Location | Direct Channel Spend (D) | Allocated Account-Level Spend (A) | Attributed Patient Volume (V) | Average Patient LTV, Contribution Basis (L) | Gross Contribution (V × L) | ROMI % ((V×L − (D+A)) / (D+A) × 100) |
|---|---|---|---|---|---|---|
| Site 1 | D₁ | A₁ | V₁ | L₁ | V₁×L₁ | Calculated |
| Site 2 | D₂ | A₂ | V₂ | L₂ | V₂×L₂ | Calculated |
| …Site N | Dₙ | Aₙ | Vₙ | Lₙ | Vₙ×Lₙ | Calculated |
| Account Total | ΣD | ΣA | ΣV | Weighted | Σ(V×L) | Account ROMI |
The allocation rule for column A is the variable that determines whether the figures defend the program or distort it. Three options work in practice:
- Revenue-share allocation assigns account-level spend in proportion to each location's contribution, which favors mature sites.
- Patient-volume allocation distributes by attributed visits, which spreads cost more evenly across the footprint.
- Equal-weight allocation divides account-level spend by location count, which is the simplest to audit and the easiest for a CFO to follow.
The choice matters less than the disclosure. Trade.gov's analytics guidance treats the calculator's value as establishing cause-and-effect between digital activity and revenue, which requires the allocation logic to be visible alongside the result 6. A table where every row's ROMI is reproducible from the inputs above it is a table the finance team can sign. A table where the allocation rule lives in a footnote or a separate deck is a table that gets challenged in every quarterly review.
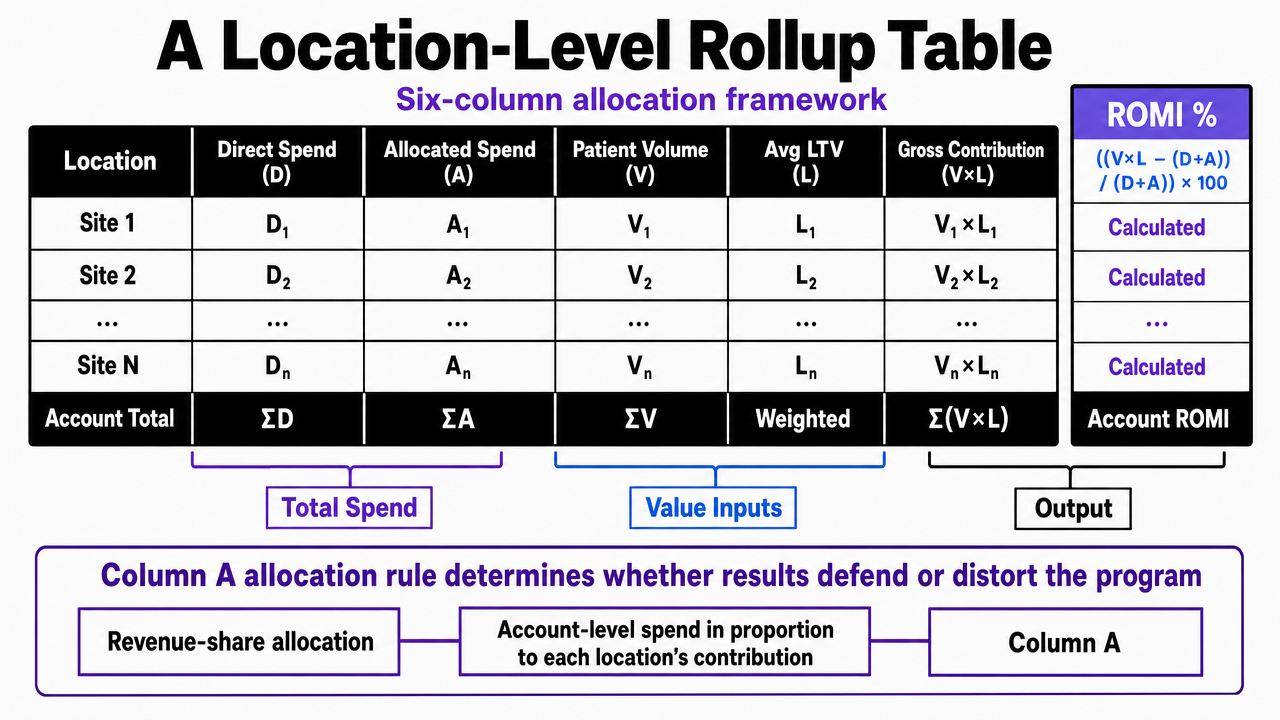 Render the multi-location ROMI rollup table as a clean visual artifact reinforcing the six-column allocation framework described in the section
Per-Location Retainers vs Account-Level Program Cost
The allocation problem has a structural cause: the cost stack itself is built per location. An operator with N sites running on per-location agency retainers pays N × R in annual marketing services, where R is the average retainer per site. That arrangement produces N separate scopes, N separate reporting cadences, and N separate attribution configurations, which is the condition under which account-level ROMI becomes unreconcilable.
| Model | Annual Marketing Services Cost | Reporting Surface | Attribution Consistency |
|---|---|---|---|
| Per-Location Retainers | N × R | N separate reports | Variable by vendor |
| Account-Level Program | P (single line item) | One rollup | Held constant across sites |
The arithmetic only favors consolidation when P < N × R and the rollup produces an attribution model held constant across every site. The SBA's framing of ROI as ongoing management discipline depends on that consistency: comparing marketing cost to revenue across periods requires the inputs to mean the same thing in every period 1. When each location's vendor sets its own attribution window, the account-level percentage on the CFO's slide is an average of incompatible measurements, not a number that defends the budget.
See the Real ROI Impact of Unified Digital Marketing Execution
Request a data-driven walkthrough of how multi-location marketing teams calculate, benchmark, and optimize ROI across content, PPC, and SEO channels—using automation to maximize outcomes from a single account-level strategy.
Where AI-Driven Optimization Changes the Calculator
AI-driven personalization changes both sides of the ROI equation, but only inside a defined scope. McKinsey's personalization benchmarks, drawn from cross-industry analysis of companies running advanced data, decisioning, and creative-optimization programs, report acquisition cost reductions of up to 50%, revenue lift between 5% and 15%, and marketing ROI gains between 10% and 30% 4. Those ranges describe outcomes for organizations that have already built the data foundations and journey orchestration the same research treats as prerequisites—not a default lift any operator captures by adding an AI tool to an existing stack 3.
For a healthcare marketing leader, the calculator implication is specific. AI optimization compresses the cost denominator by reducing wasted impressions and improving lead quality, and it expands the revenue numerator by lifting conversion rates and retention. Both effects need to be measured against a pre-AI baseline held in the same calculator, with the same attribution model, the same LTV definition, and the same allocation rule applied to account-level spend. Without that baseline, the lift attributed to AI is indistinguishable from seasonality, payor-mix shifts, or a competitor pulling back on local paid search.
The discipline is the same one the SBA describes for any marketing program: continuous comparison of cost against revenue, refreshed as the plan changes 1. AI moves the inputs faster. It does not change which inputs the CFO will audit.
Substantiating ROI Claims Before They Reach a Case Study
The moment a ROMI figure leaves the calculator and lands in a case study, a pitch deck, or a website testimonial, it crosses from internal measurement into advertising. FTC guidance is direct: claims in advertisements must be truthful, cannot be deceptive or unfair, and must be evidence-based 2. A 340% ROMI published next to a clinic logo is a performance claim, and the substantiation file behind it needs to exist before the asset goes live—not after a regulator or competitor asks.
The substantiation file is the same audit trail the calculator already produces if it was built correctly. Every input ties to a system of record, the attribution model and lookback window are logged on the same row as the spend, the LTV figure carries its retention assumption, and the allocation rule for account-level cost is documented rather than buried. Digital.gov's measurement guidance treats this discipline—goals, KPIs, tagging, and review—as the operational backbone of credible reporting 7. A claim a marketing leader cannot reproduce from inputs is a claim the legal team should strike before publication.
What the CFO Will Ask, and What the Calculator Should Answer
A CFO review of a marketing ROI figure rarely starts with the percentage. It starts with the inputs. The three questions that decide whether the number gets signed are predictable, and a calculator built on the schema described in earlier sections answers each of them on the same page as the result.
- What is in the cost base. The defensible answer names activity spend, allocated overhead, agency or platform fees, and the share of account-level brand investment amortized to the period—the full marketing cost analysis UCLA Anderson treats as the precondition for any tactical ROMI figure 5.
- How revenue was attributed. The answer names the attribution model, the lookback window, and whether the same revenue was tested against an alternative model to surface the spread.
- What assumption sits inside lifetime value. The answer names the contribution-margin basis, the retention window, and the cohort cadence used to refresh the figure.
The SBA frames this as the working definition of measurement: an ongoing comparison of marketing cost against the revenue it generates, refreshed as the plan evolves 1. A calculator that surfaces those three answers next to the ROMI percentage is a calculator the finance team funds.
Frequently Asked Questions
References
- 1.Marketing and sales | U.S. Small Business Administration - SBA.
- 2.Advertising and Marketing | Federal Trade Commission.
- 3.Unlocking the next frontier of personalized marketing.
- 4.What is personalization? - McKinsey.
- 5.Using ROMI Effectively - UCLA Anderson School of Management.
- 6.How to Use Website Analytics Strategically.
- 7.6 Important Factors To Consider for Digital Advertising in Government.
- 8.The development of the concept of return-on-investment from large ....
- 9.Toward a Digital Attribution Model: Measuring the Impact of Display Advertising.
- 10.Do Display Ads Influence Search?: Attribution and Dynamics in Online Advertising.
- 11.Attribution and Compensation Design in Online Advertising.
- 12.AMA Marketing ROI Calculator.