
Key Takeaways
- Defensible proof of content effectiveness ties interactions to named opportunities, buying-group activity, and booked revenue, not sessions, MQLs, or single-touch sourced pipeline 11.
- Most teams cannot produce that proof because only 41% can analyze content by audience and 34% by theme, leaving tagging and taxonomy as the upstream gap 3.
- Existing customers generate 77% of B2B revenue, so expansion-influenced bookings, retention correlation on matched cohorts, and advocacy yield belong in the measurement model 3, 4.
- Locate the team on the activity-to-revenue-influence maturity ladder, then close the specific capability gap—sales adoption, CRM integration, or unified data—before the next budget defense 5, 7.
What Counts as Proof in a CFO Review
Proof of content marketing effectiveness is not a traffic chart, a domain authority score, or a quarterly engagement report. In a CFO review, proof is evidence that content changed buyer behavior in ways tied to revenue: opportunities created, sales cycles compressed, expansion bookings closed, retention extended. Everything else is supporting context.
This standard has shifted in the past three years. Forrester now advises B2B marketing executives to move past lead-centric reporting toward opportunity and buying-group contribution, since the actual buyer in service-sector deals is almost always a group rather than an individual 10. The same analyst body has gone further, arguing that marketing-sourced pipeline metrics should be retired in favor of indicators describing how much demand marketing creates or influences across full buying journeys 11.
For an in-house VP of Marketing running a lean team across multi-location practices, DSOs, or regional service portfolios, the implication is direct. A defense of content investment that relies on session counts or MQL volume will not survive a finance review that asks how those numbers translated into booked revenue. A defense built on opportunity progression, customer expansion, and influenced pipeline can.
The rest of this article ranks the proof types by how well they hold up under that scrutiny, identifies why most teams cannot yet produce the strongest evidence, and outlines what a credible measurement model looks like in service verticals where buying decisions involve clinicians, operators, legal counsel, and finance simultaneously.
The Evidence Hierarchy: Ranking Proof by Defensibility
Why Traffic and Engagement Sit at the Bottom
Sessions, time on page, scroll depth, and social shares describe what happened on a screen. They do not describe what happened in a buying group. A behavioral health intake director or a DSO operations lead does not appear in those metrics until weeks or months after the first content interaction, which is why traffic-level data sits at the base of any defensible evidence stack.
The peer-reviewed determinants framework for content marketing effectiveness makes this point directly: outcomes depend on organizational context, strategic alignment, content quality, and cross-functional collaboration, not on publishing volume or surface engagement 6. Reach metrics describe inputs and the immediate reaction to those inputs. They do not validate that content changed a purchase decision.
Engagement metrics also degrade quickly under scrutiny. A 6-minute average time on a pricing comparison page reads differently when finance asks whether the visitors were prospects, current customers, competitors, or job candidates. Without audience-level segmentation, the number describes a mixed cohort that cannot be tied to revenue. That limit is why this layer of evidence holds up in marketing reviews but rarely in finance ones.
Opportunity Progression and Revenue Influence at the Top
The strongest evidence sits where content interactions intersect with named opportunities, buying-group activity, and booked revenue. Forrester's guidance to B2B marketing executives treats this layer as the actual standard: indicators should describe how much demand marketing creates or influences across buying groups and journeys, not how many leads it sourced 11. The Planning Guide for B2B Marketing Executives extends the point, instructing CMOs to tie programs to opportunity creation and acceleration rather than individual MQL counts 10.
Three indicators carry the most weight in a finance review:
- Opportunity influence: the percentage of open opportunities where two or more members of the buying group consumed specific content assets before a stage advance.
- Sales cycle compression: the median time-to-close for opportunities that touched designated enablement content compared with those that did not.
- Expansion contribution: the share of renewal and cross-sell revenue preceded by customer-facing content engagement.
Forrester's customer-centric content guidance argues that effective B2B content earns the right to guide buying groups through complex choices, which means the content has to show up inside the decision, not before it 4. For a legal marketing lead defending a content budget against a paid search line item, an analysis showing that opportunities touching a specific 12-asset library closed 18 days faster than untouched opportunities is the kind of evidence that survives the next budget cycle. A pageview chart is not.
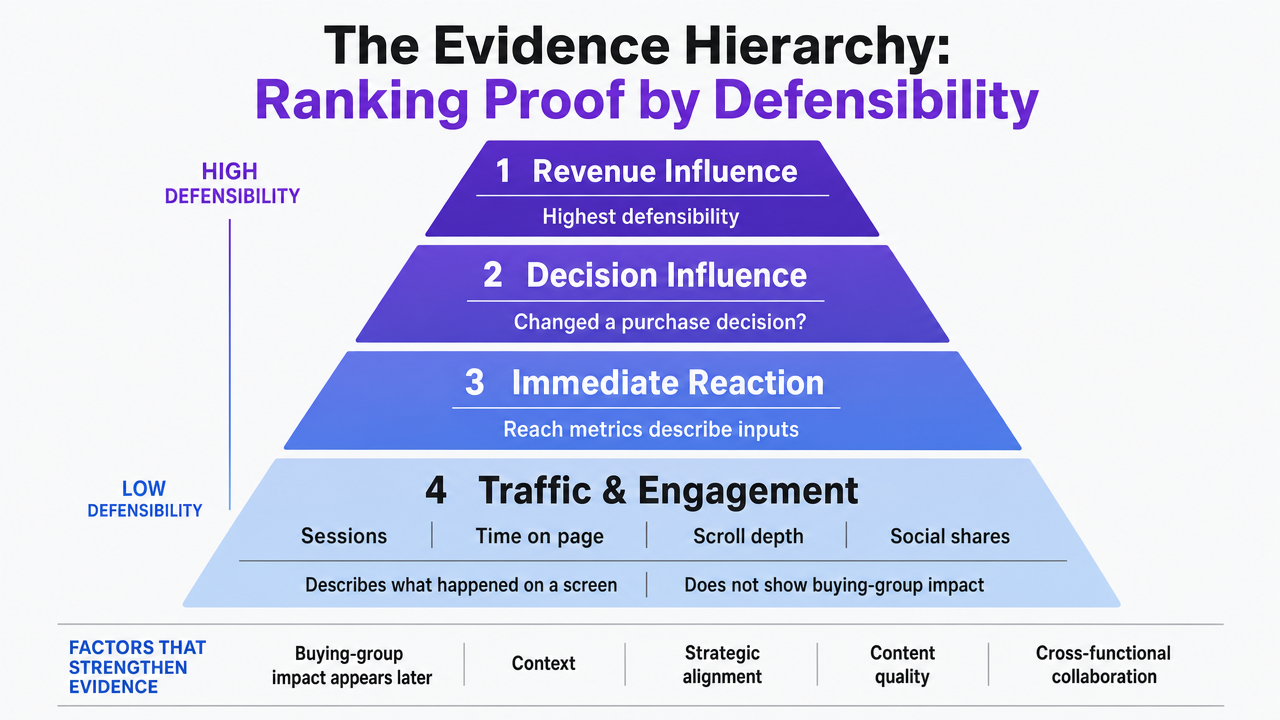 Visualize the four-tier evidence hierarchy from low-defensibility traffic metrics at the base to high-defensibility revenue influence at the top, directly supporting the section's ranking framework
Why Most Marketing Teams Cannot Currently Produce Proof
The gap between what counts as proof and what most marketing teams can actually produce is wide, and it is structural rather than analytical. Forrester's B2B content benchmarking found that only 41% of B2B marketing organizations can view and analyze content performance metrics by audience, and only 34% can analyze it by theme or topic 3. Both figures describe basic segmentation—the prerequisite for any claim that a specific asset moved a specific buying group toward a specific outcome. Without audience- and theme-level visibility, a content performance report is a description of aggregate traffic, not evidence of influence.
The downstream effect is predictable. A VP of Marketing at a behavioral health network can show that long-form clinical content drove 240,000 sessions last quarter, but cannot show which sessions came from referring providers, payer contacts, or families researching admissions. A DSO marketing director can report that a practice acquisition guide ranks first for its target query, but cannot isolate which downloads came from independent dentists evaluating sale options versus competitors monitoring positioning. The reporting layer exists. The analytical substrate underneath it does not.
The peer-reviewed determinants framework treats this as a question of organizational capability, not tooling. Effectiveness depends on cross-functional coordination, content quality, and how well content fits customer needs and internal processes 6. Tagging discipline, taxonomy governance, and shared definitions between marketing and sales sit upstream of every measurement question. When those are missing, no dashboard can recover them.
The practical consequence for a Marketing VP defending content investment is that the measurement problem is partly a content operations problem. Teams that cannot answer "which audience consumed which theme before which stage advance" are not in a position to argue for budget on the basis of revenue influence. They can only argue on the basis of activity. Closing that gap—through cleaner tagging, integrated CRM and content data, and a defined buying-group model—precedes any credible defense of effectiveness in front of finance.
 Show the Forrester benchmark that only 41% of B2B marketing organizations can analyze content by audience and 34% by theme, directly cited in this section's prose
Test Content Impact With Real-Time Metrics
Experience measurable content performance using your actual campaigns before making any commitment.
Replacing Lead-Sourcing Metrics with Buying-Group Evidence
The Case Against Marketing-Sourced Pipeline
Marketing-sourced pipeline is the metric most likely to misrepresent what content actually did. It assigns full credit to whichever touchpoint preceded a form fill, ignoring the four to seven other buying-group members who consumed content but never raised a hand. In a DSO acquisition deal, the office manager who downloaded the valuation guide and the CFO who read three case studies do not appear in the source field. The associate dentist who happened to fill the demo form does.
Forrester's position is that this attribution model misstates marketing's contribution and should be retired. The centerpiece of the contribution story, the analyst argues, should be performance indicators tied to demand and pipeline creation across buying groups and journeys, not which channel was tagged on a single record 11. The Planning Guide for B2B Marketing Executives reinforces the point by instructing CMOs to divest from net-new lead acquisition metrics and shift measurement toward opportunity types and buying-group activity 10.
The practical risk for a Marketing VP is that sourcing reports overstate cheap channels and understate the content library doing the work underneath. When finance compares paid search against content on a sourced-pipeline basis, content loses a contest it was never structured to win.
Indicators That Hold Up Under Audit
The replacement metrics are buying-group indicators tied to named opportunities. Four hold up well under finance review.
Buying-group coverage. : The percentage of open opportunities where at least three distinct contacts from the account have engaged with content in the last 90 days. This indicator describes whether content is reaching the actual decision unit. For a senior living operator selling into health system partnerships, coverage below 40% predicts stalled deals regardless of how strong the primary champion looks.
Content-influenced pipeline. : The dollar value of open opportunities where two or more buying-group members consumed designated enablement assets before a stage advance. This is the metric Forrester points to when it argues that credibility comes from showing impact on opportunity progression and revenue, not from single-touch attribution 11.
Stage-advance velocity. : The median time between buying-group content engagement and the next stage transition, compared with a baseline of opportunities with no content engagement. A 15- to 25-day compression on mid-funnel transitions is a finance-grade result that survives audit because it is measured on matched opportunity cohorts, not aggregate funnel math.
Sales adoption of content. : The percentage of active opportunities where the assigned rep has shared at least one marketing asset in the last 30 days. Forrester's guidance on the marketing-sales alliance treats this adoption layer as a leading indicator of downstream content impact, since assets that sales does not use cannot influence buying conversations 5. Tracking it forces the operational alignment that the determinants framework identifies as a precondition for effectiveness 6.
The Existing-Customer Proof Gap
The largest source of revenue in B2B service businesses is the customer base that already signed. Forrester's benchmarking puts the figure at 77% of B2B customer revenue coming from existing customers, yet most content effectiveness measurement still tracks net-new acquisition almost exclusively 3. The scope matters: the figure describes B2B organizations Forrester surveyed, not consumer categories, and it points to where the proof surface is widest rather than where most reporting actually looks.
For a behavioral health network with a multi-state footprint, this gap shows up in concrete form. The marketing dashboard tracks intake inquiries, cost per admission, and organic sessions from referring providers. It does not track which clinical education content the payer relations team forwarded to a contracting partner before a contract expansion, or which family-facing content drove a referring physician to send a second patient. Both of those interactions sit inside the 77%. Neither shows up in the report defending the content budget.
The same pattern repeats across the service verticals where content programs run hardest. A DSO marketing director can measure new patient acquisition by location but rarely measures the recall content that lifts existing-patient revisit rates. A senior living operator can show form fills from tour requests but typically cannot show which family-stage content reduced cancellation rates between deposit and move-in.
Three customer-side indicators close most of the gap:
- Expansion-influenced revenue: the share of cross-sell or service-line expansion bookings preceded by buying-group content engagement in the prior 90 days.
- Retention correlation: renewal rates among customer accounts that received structured content programs compared with those that did not, measured on matched cohorts.
- Advocacy yield: the percentage of referral conversations or review submissions traceable to customer-facing content prompts.
Forrester's customer-centric content guidance reinforces the point. Effective B2B content helps customers realize value and defend internal decisions after purchase, not only before it 4. A Marketing VP who measures content only against acquisition is reporting on roughly a quarter of where the program actually contributes. Adding expansion and retention indicators to the regular reporting cadence converts hidden revenue influence into evidence that finance can verify against the customer ledger.
Operational Determinants: Why Context Predicts Effectiveness
Cross-Functional Alignment with Sales
Content programs that produce defensible proof share one trait: the sales organization uses the assets in active deals. Forrester's guidance on the marketing-sales alliance is direct on this point. B2B marketers must connect their content and messaging with the way sales engages buyers, or the assets remain marketing artifacts rather than buying-group influence 5.
The peer-reviewed determinants framework treats this alignment as a causal variable rather than a soft factor. Effectiveness depends on strategic alignment, content quality, and cross-functional collaboration—not on publishing cadence or asset count 6. A behavioral health intake team that never shares the payer-readiness brief with contracted providers neutralizes whatever influence the asset could have had. The library exists. The deal does not see it.
Three operational signals indicate whether alignment is real:
- The percentage of active opportunities where a sales-owned contact has forwarded a marketing asset in the last 30 days.
- The share of new assets briefed jointly by marketing and a named sales lead before production.
- The rate at which sales-requested asset updates ship within a defined service window.
When all three sit below 50%, content performance reports describe potential influence, not actual influence.
Tagging Maturity and Content Intelligence
The analytical substrate underneath any effectiveness claim is taxonomy. Forrester's benchmarking identifies tagging discipline and content intelligence as one of five focus areas separating teams that can prove impact from those that cannot, noting that operational silos and immature tagging practices are the main barriers to audience- and theme-level analysis 3. Without consistent metadata, a content library cannot be queried for the questions finance asks.
Tagging maturity has four practical layers:
- Audience tags identify which buyer role or buying-group function an asset addresses—clinical director, payer contact, office manager, family decision-maker.
- Theme tags group assets by the decision question they answer, not by topic keyword.
- Journey-stage tags map each asset to a defined point in the buying motion.
- Outcome tags connect assets to the opportunity stages they are designed to influence.
A DSO marketing director who can filter the library by all four dimensions can answer the question that defines content intelligence: which audience consumed which theme at which stage, and what happened next. Without that filtering, every effectiveness claim collapses into aggregate traffic. The tagging investment precedes the measurement investment, not the other way around.
See Which Content Drives Measurable Pipeline—Not Just Pageviews
Request a walkthrough of how leading brands use live attribution and channel analytics to prove content ROI, prioritize high-impact assets, and scale results without expanding their teams.
The Economics of Integrated Content Operations
The peer-reviewed determinants framework and the digital marketing capabilities study converge on a single financial argument: integrated content operations outperform fragmented ones because the data substrate, analytics, and cross-functional coordination compound. The capabilities study finds that digital marketing capabilities significantly contribute to firm profitability beyond what conventional marketing capabilities deliver, with the integration of data and execution acting as the differentiator 7. Effectiveness, in other words, scales with how tightly content production, audience data, and measurement sit inside the same operating loop.
McKinsey's synthesis of personalization research quantifies the upper bound of what that integration produces. Across the cases reviewed, effective personalization reduces customer acquisition costs by as much as 50%, lifts revenues by 5 to 15%, and increases marketing ROI by 10 to 30% 8. The scope is specific: these are personalization outcomes synthesized across organizations that built the data foundations, analytics, and cross-functional teams required to execute it, not universal results for any content program. The PDF synthesis reiterates that the 10 to 30% ROI lift depends on sophisticated data and analytics capabilities that many firms still lack 9.
For a Marketing VP modeling content economics against paid channels, those ranges define the headroom worth pursuing. A behavioral health network with a current blended CAC of $480 per qualified admission inquiry has a credible ceiling of roughly half that figure if content operations reach the integration threshold McKinsey describes. A DSO marketing director defending a content budget that currently shows a 14% ROI lift over baseline can argue, with sourced benchmarks behind the number, that the program sits in the lower band of a documented range and has room to move.
The operational requirement is the constraint. Fragmented stacks—one vendor for production, another for distribution, a third for analytics—rarely produce the unified audience and outcome data that personalization economics require. The capabilities study points directly at this: firms that underinvest in measuring and communicating the value of integrated digital marketing capabilities to financial stakeholders capture less of the available upside 7. Consolidation is not a procurement preference; it is a precondition for the economics to show up in the financials.
If You Manage Multiple Locations: A Consolidation Economics Framework
For VPs running marketing across multi-location practices, DSOs, regional behavioral health networks, or home services portfolios, the effectiveness question carries a second variable: how much of the available impact is lost to operational fragmentation across sites. A regional dental group with 22 locations running separate vendor relationships for production, paid media, and reporting will not surface the same audience and outcome data as a portfolio running one integrated stack. The capabilities research is direct on this point: digital marketing capabilities contribute to firm profitability beyond what conventional capabilities deliver, with data integration acting as the differentiator 7.
The framework below uses sourced benchmark ranges and operator-supplied inputs. No dollar figures are assumed.
| Variable | Operator Input | Sourced Benchmark Range | Modeled Output |
|---|---|---|---|
| Current blended CAC per location | $[your figure] | Up to 50% reduction under integrated personalization 8 | Input × (1 − applied reduction %) |
| Current revenue per location | $[your figure] | 5–15% lift under integrated personalization 8 | Input × (1 + applied lift %) |
| Current marketing ROI ratio | [your figure] | 10–30% ROI increase 8 | Input × (1 + applied ROI %) |
| Content production cost across locations | $[your figure] | Fragmentation premium varies by stack count | Sum of vendor + internal cost |
The benchmark ranges describe personalization outcomes synthesized across organizations that built unified data, analytics, and cross-functional teams 8. A senior living operator running fifteen communities should apply the lower band until the audience and tagging substrate described in earlier sections is in place. The upper band is reachable, but only by portfolios that consolidated the operating loop rather than the asset count.
A Measurement Maturity Diagnostic for In-House Marketing Leaders
Before defending a content budget in front of finance, a Marketing VP needs to know which evidence tier the team can actually produce today. The diagnostic below maps four maturity levels against the capabilities each one requires. Self-location is the point; the gaps between levels are where the operational work sits.
| Level | What the Team Can Prove | Required Capability |
|---|---|---|
| 1. Activity | Publishing volume, sessions, rankings, engagement | Analytics tagging, basic SEO reporting |
| 2. Audience | Performance by buyer role and theme | Audience and theme taxonomy applied across the library 3 |
| 3. Opportunity | Content-influenced pipeline, stage-advance velocity, sales adoption rate | CRM integration, buying-group model, marketing-sales asset workflow 5 |
| 4. Revenue Influence | Opportunity progression, expansion contribution, retention correlation on matched cohorts | Unified data substrate across acquisition and customer-base programs 7 |
Most in-house teams running lean operations sit between Level 1 and Level 2. Forrester's benchmark that only 41% of B2B organizations can analyze content performance by audience and 34% by theme places the median squarely in that band 3. Moving to Level 3 requires the sales-alliance work described earlier, not a new dashboard. Moving to Level 4 requires the integrated data operations that the capabilities research links to firm-level profitability 7. A VP who can name the current level, the target level for the next planning cycle, and the specific capability gap between them has the structure of a defensible content investment case.
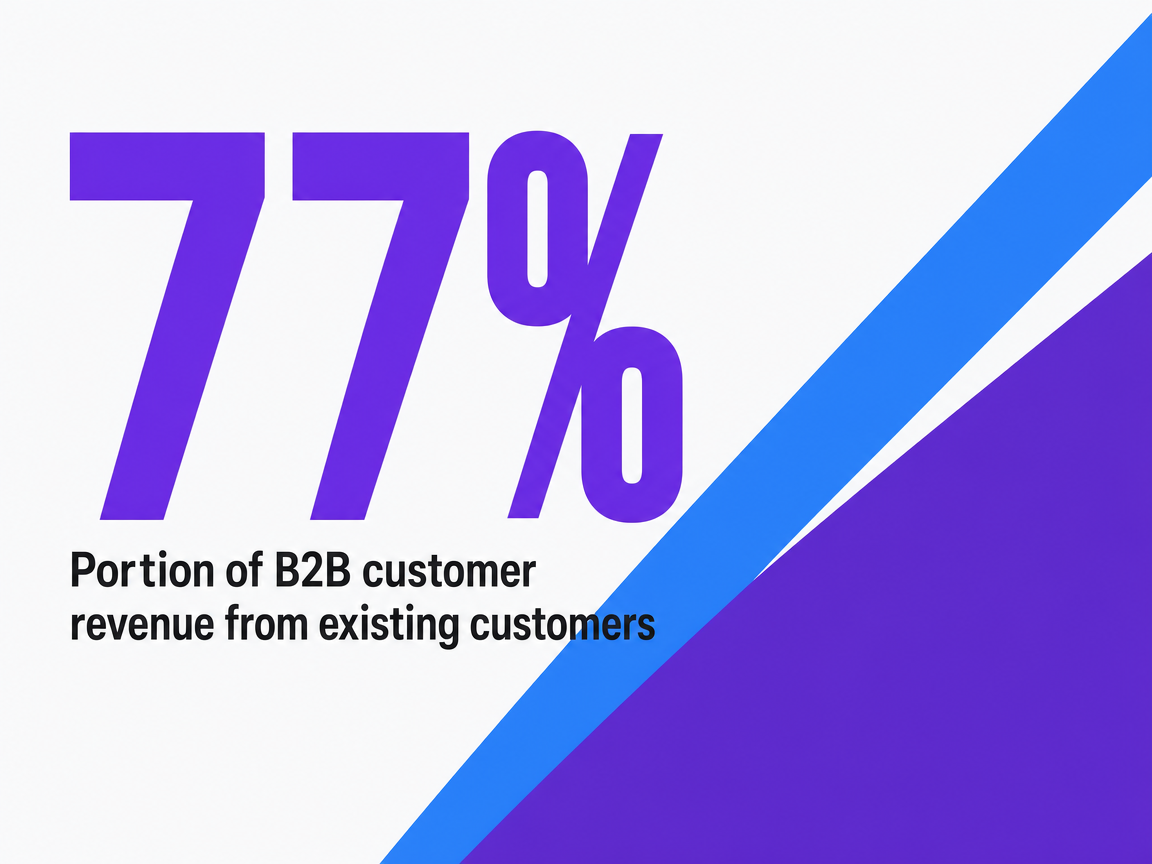 Portion of B2B customer revenue from existing customers
Portion of B2B customer revenue from existing customers
Frequently Asked Questions
References
- 1.Evaluating the Effectiveness of Digital Content Marketing Under Mixed Reality Training Platforms.
- 2.B2B content marketing for professional services: In-person versus digital contacts.
- 3.What's Next In B2B Content? Five Important Focus Areas For 2022.
- 4.A Guide To Creating Compelling Customer-Centric Content.
- 5.The B2B Content Guide: Make Sales Your Ally In Content Marketing.
- 6.Determinants of content marketing effectiveness: Conceptual framework and empirical validation.
- 7.The value relevance of digital marketing capabilities to firm performance.
- 8.What is personalization?.
- 9.What is personalization? (PDF).
- 10.Planning Guide 2023: B2B Marketing Executives.
- 11.B2B Marketers: It’s Time To Ditch Sourcing Metrics.