
Key Takeaways
- Healthcare EBITDA margins have compressed while clinical wages climbed 4.3 percent in 2025 2, making volume-first growth models structurally unprofitable for multi-location operators.
- Patient lifetime value, not cost per acquisition, should anchor channel decisions because it gives marketing and finance a shared currency that survives wage inflation and seasonal CPA swings.
- Concentrate investment on the 20 percent of referral sources driving 80 percent of pipeline 3 and select three to five high-margin segments before choosing channels.
- Replace fragmented vendor stacks with a unified plan and a lead strategist layer, using AI for cross-location coordination so senior leaders focus on segment strategy instead of briefing cycles.
The Margin Math Has Changed Faster Than the Growth Playbook
Healthcare EBITDA as a percentage of national health expenditures fell from 11.2 percent in 2019 to 8.9 percent in 2024, with projections holding near 8.7 percent through 2027 1. This shift has exposed the limits of conventional growth strategy. The volume-first playbook—focused on acquiring more clicks, opening more service lines, and chasing more impressions—was designed for a profitability environment that no longer exists.
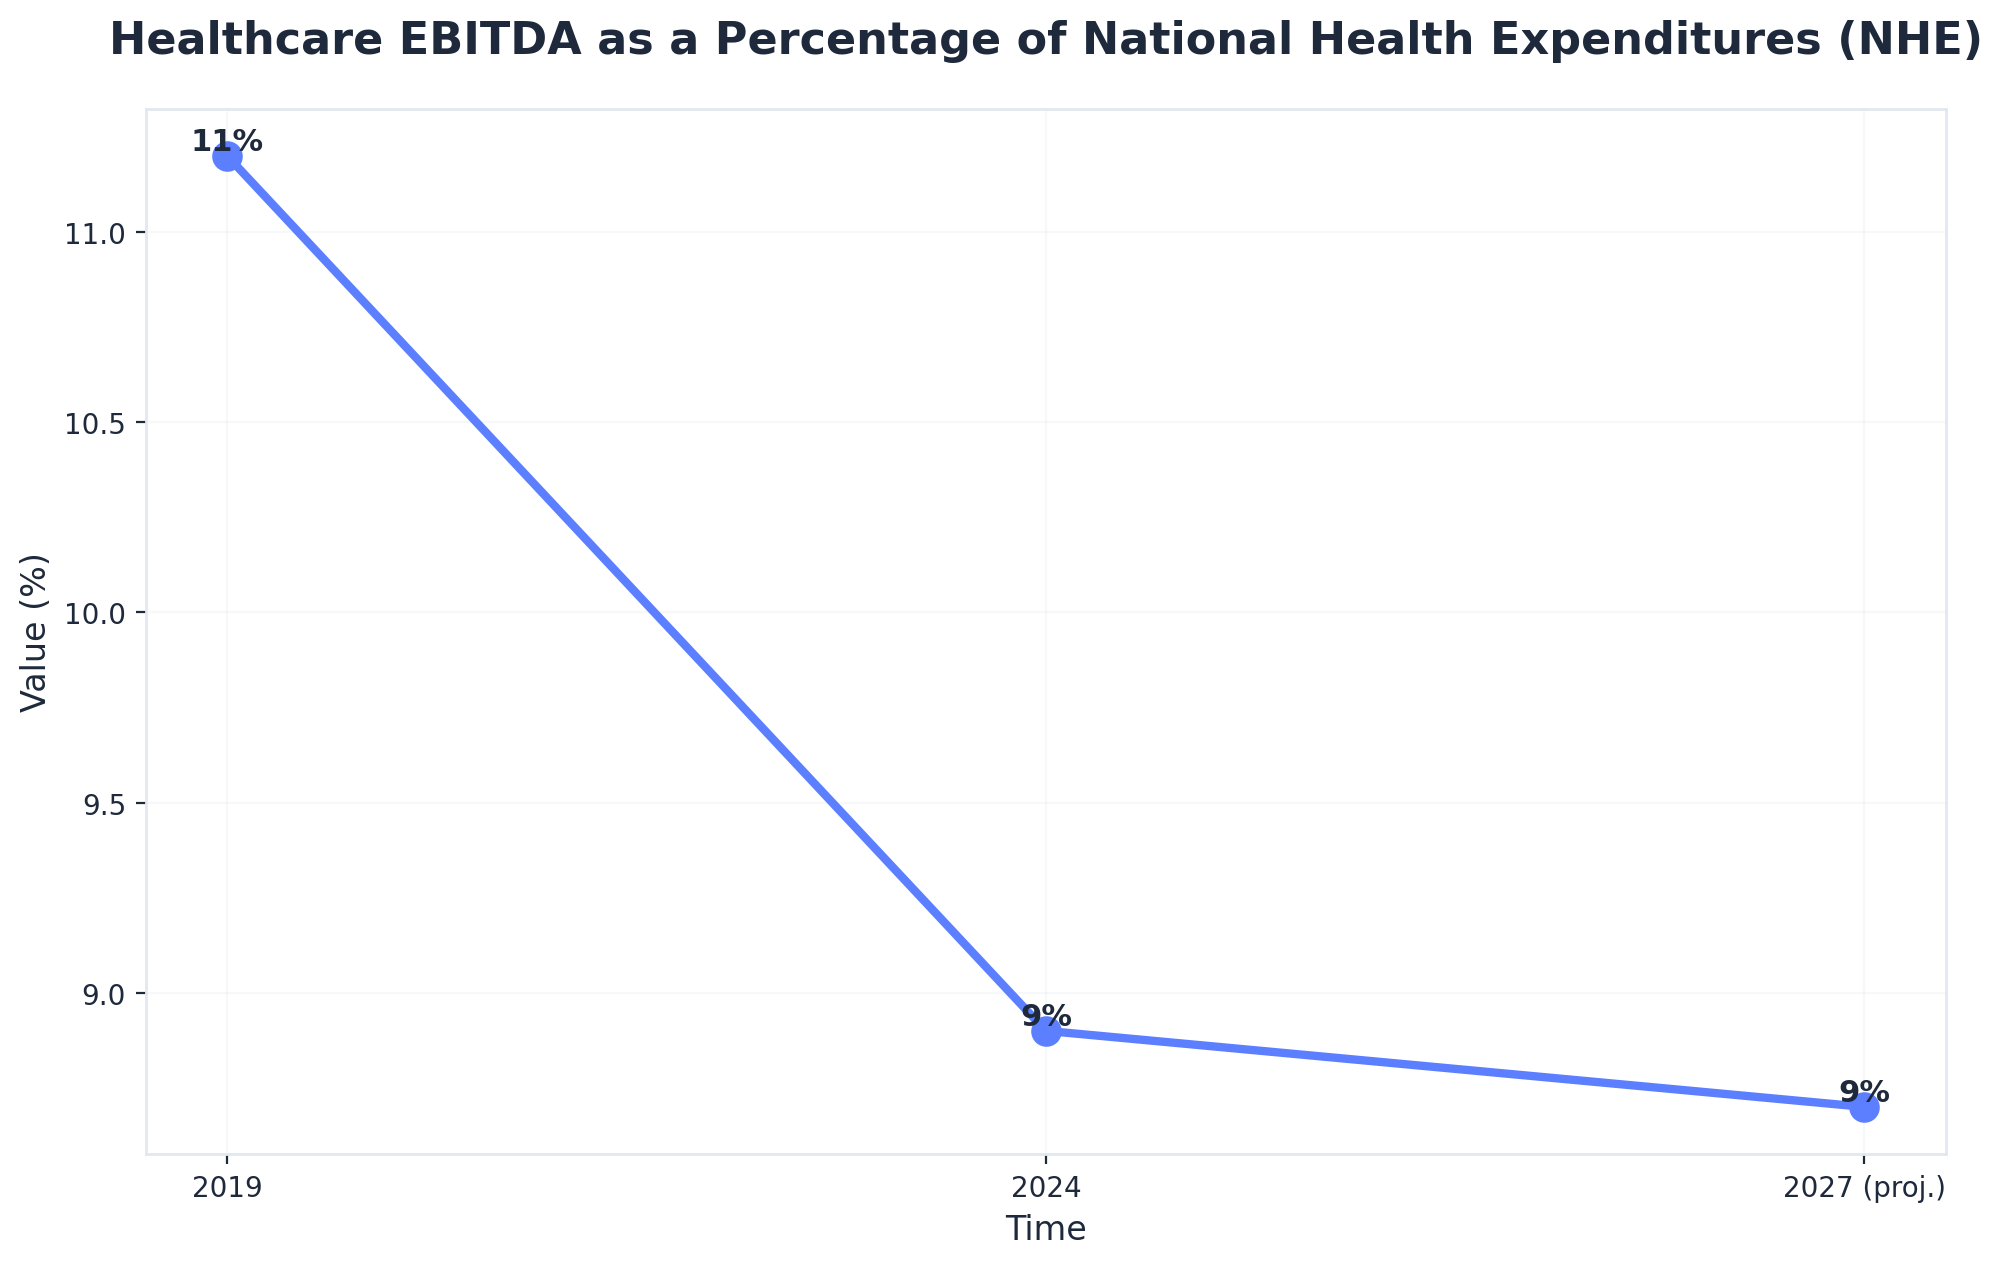 Healthcare EBITDA as a Percentage of National Health Expenditures (NHE)
Healthcare EBITDA as a Percentage of National Health Expenditures (NHE): 2019: 11.2%, 2024: 8.9%, 2027 (proj.): 8.7%. Shows the decline in overall healthcare profitability, a key driver for the strategic shift from volume-based to value-based growth models.
Most growth plans in multi-location operators still reflect strategies from 2018. Channel teams often report against last-click conversions, and quarterly reviews compare cost per acquisition (CPA) across SEO, paid search, and referral programs as if these metrics were directly comparable. Meanwhile, the financial reality includes median base pay for clinical staff rising 4.3 percent in 2025, up from 2.7 percent the year prior 2. This means every patient acquired now costs more to serve, even before marketing expenses are considered.
This creates a structural disconnect: growth directors are measured on volume and pipeline, while finance focuses on margin. The two perspectives often lack a shared vocabulary, leading to friction in every budget cycle.
What is needed is a fundamental rethinking of the growth model. The new approach emphasizes selecting patient segments based on lifetime value, coordinating channel efforts against shared margin targets, and replacing attribution debates with contribution math that resonates with a CFO. Healthcare operators who successfully navigate the next three years will be those who treat growth as a margin function, not merely a traffic function.
Why Volume-First Growth Stopped Paying Its Own Bills
Wage Inflation and the Hidden Tax on Marketing Efficiency
Clinical wage growth accelerated from 2.7 percent in 2024 to 4.3 percent in 2025, nearly doubling year over year 2. This increase significantly impacts the cost-to-serve for every patient encounter, pushing the breakeven point for newly acquired patients higher each quarter. Traditional volume-first growth models assume stable unit economics, but this is no longer the case.
For example, an orthopedic referral acquired in 2023 at a specific cost now incurs higher labor costs for the initial visit, imaging, post-operative follow-up, and subsequent touchpoints. If marketing teams maintain a flat CPA, the gross margin per acquisition still declines. Even a 10 percent improvement in marketing CPA through better targeting can be negated by wage inflation before the quarter ends.
This implies that marketing efficiency gains must outpace cost-to-serve inflation, not just meet outdated CPA targets. CPA targets from previous years are functionally obsolete. The relevant metric is margin per acquired patient, adjusted for the current wage curve, and recalculated at least quarterly against actual financial data.
Channel Silos as a Margin Leak, Not a Coverage Strategy
Approximately 44 percent of healthcare marketing spend is now in mobile and digital channels, with television at around 33 percent, and the rest distributed across other media 5. While this allocation may appear logical, within the operating model, it often translates to multiple independent teams—such as paid search, organic, content, and referral relations—each optimizing for their own metrics and defending their own budgets.
This siloed approach leads to inefficiencies. For instance, a paid team might increase bids on branded terms due to strong last-click ROAS, even as the organic team captures the same intent for free. A content team might create service-line pages based on search volume, neglecting segments that the referral team is actively cultivating. Referral coordinators might build physician relationships for specialties that the PPC budget is underserving. These are not individual failures but rather predictable outcomes of measuring channels against channel-specific KPIs instead of shared margin targets.
The real margin leak occurs at the interfaces between these channels. Teams may inadvertently bid on the same patient or overlook high-LTV segments that fall between their defined areas of ownership. This forces growth directors to spend valuable time arbitrating overlaps and gaps, which is an inefficient use of senior leadership's time in any multi-location operation. The issue is not a lack of coverage, but a lack of coordination.
From Attribution to Contribution: A Different Unit of Measurement
Patient Lifetime Value as the Operating Currency
Healthcare growth plans that successfully pass CFO scrutiny share a common characteristic: they value patients based on lifetime value (LTV), not just first-visit revenue. Patient LTV—the projected gross margin a patient generates across all encounters, referrals, and service lines over their entire relationship with the provider—is the only metric that allows marketing to communicate effectively with finance 9.
The calculation is straightforward: average annual margin per patient, multiplied by expected retention years, adjusted for service-line mix and referral propensity. This metric fundamentally alters channel investment decisions. A primary care patient with a low four-figure LTV might appear unprofitable against a paid search CPA that an orthopedic conversion could easily absorb. Treating these as equivalent units of pipeline leads to misallocated budgets quarter after quarter.
LTV also mitigates seasonal CPA fluctuations. When a paid search line item spikes, the question shifts from "why did acquisition cost rise?" to "did the segment mix shift toward higher-LTV patients, and is the higher cost still within the margin envelope?" This reframing facilitates productive conversations with finance partners, unlike discussions centered on last-click ROAS.
For multi-location operators, LTV must be calculated specifically for each site and service line, rather than as a system-wide average. A bariatrics LTV in one market may not apply to another with a different payer mix or referral density. LTV serves as the operating currency, but its value is locally determined.
What Gross Margin Contribution Looks Like by Channel
When LTV becomes the primary metric, channel reporting transforms. Each workstream—organic search, paid media, content, referral relations—is evaluated based on the gross margin it contributes to the patient cohort it influenced, rather than on conversions claimed by a last-click model.
Contribution math acknowledges that patients engage through multiple touchpoints. For example, a prospective knee replacement patient might discover a service-line page via organic search, see a retargeting ad on a mobile feed, and ultimately book an appointment through a referring primary care physician. Traditional attribution asks which channel gets credit. The contribution model, however, asks: what share of the gross margin generated by that patient cohort over the next thirty-six months would have been lost if a specific workstream were removed?
This reframing directly impacts budget allocation. Channels that appear weak under last-click models—such as organic content, physician relationship building, and the gradual impact of brand search—often carry significant contribution weight because they reduce friction throughout the patient journey 5. Conversely, channels that seem strong under last-click, particularly branded paid search, frequently show contribution scores that are more akin to a tax than a true investment.
Growth directors should present a single table in quarterly reviews, detailing cohort size, blended LTV, total margin generated, and each workstream's contribution share. This is the type of document a CFO will endorse.
Test Unified Healthcare Growth Execution in Days
Experience measurable growth impact with real campaigns and full analytics during your no-risk trial.
Fewer, Deeper Bets: The Case for Concentration Over Coverage
The 80/20 Reality of Referral Sources
Approximately 80 percent of patient referrals originate from just 20 percent of referring sources 3. This consistent distribution across specialties, geographies, and operator sizes should be a foundational principle for any growth plan, not an afterthought in a referral coordinator's report.
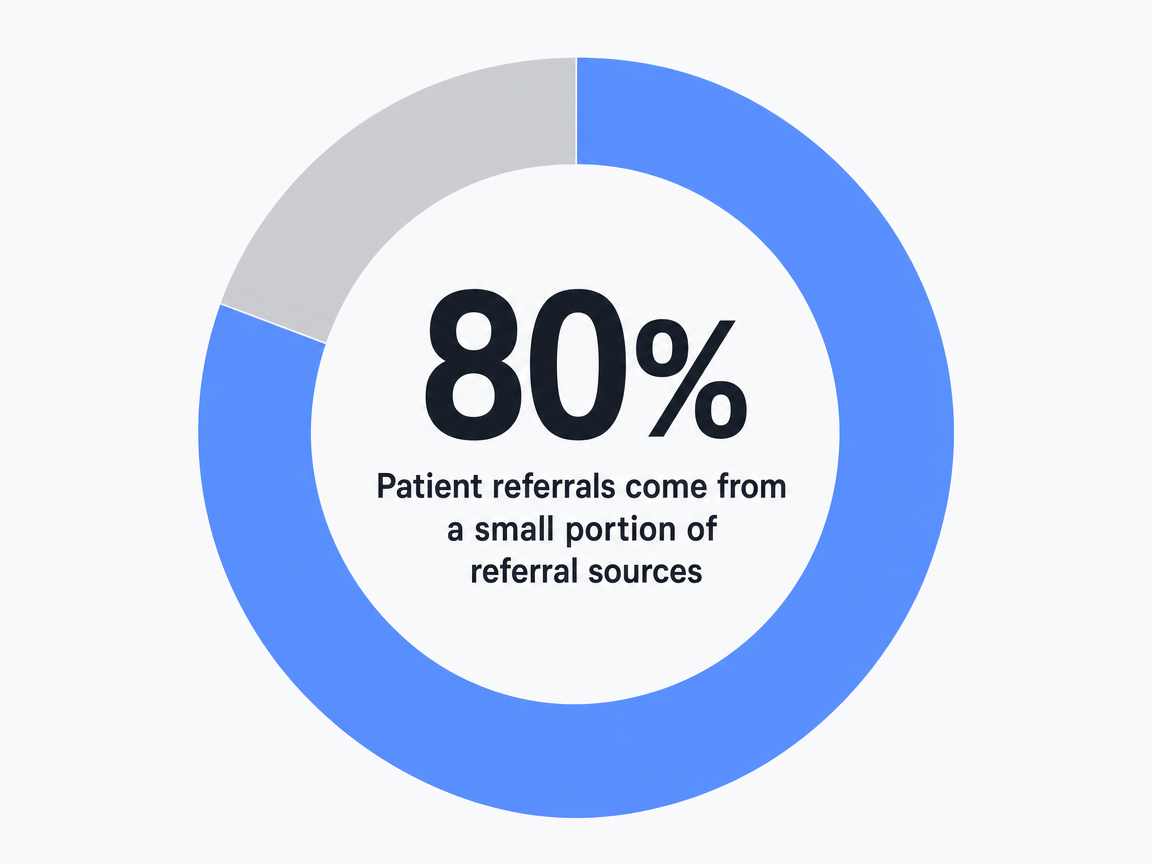 Patient referrals come from a small portion of referral sources: 80%
The operational implications are often challenging to accept. Many multi-location growth programs distribute referral efforts evenly across a broad directory of physicians, believing that wider coverage mitigates concentration risk. However, data suggests the opposite: this approach dilutes finite resources across sources that will never generate significant volume, while the top 20 percent, who already drive the majority of the pipeline, receive the same generic attention as everyone else.
Concentration is not a risk to be avoided; it is the inherent structure of the market. A growth director who maps referral volume by source, ranks the top quintile by service-line margin contribution, and reallocates relationship time accordingly will outperform peers pursuing broader, shallower outreach within two quarters. The bottom 80 percent of sources do not need to be eliminated; they simply need to be managed with a lower-touch program that requires a fraction of a physician liaison's time.
Segment Selection Before Channel Selection
Most multi-location growth plans prioritize channels over segments. The PPC budget is set, the content calendar is drafted, and patient segments are retroactively fitted into a slide. This inverted order is costly and evident in every quarterly review.
Segment selection must come first because different patient cohorts have distinct operational requirements—varying acquisition pathways, clinical workflows, and margin profiles per encounter 7. A bariatrics candidate, a Medicare Advantage primary care patient, and a self-pay aesthetics inquiry are not merely points on a single funnel; they represent distinct business lines operating within the same facility. The channel mix must be tailored to each segment's actual decision journey, not averaged across all of them.
The selection criteria are deliberately narrow: projected lifetime value, contribution margin per encounter, and addressability through existing channels 9. Segments that fail any of these criteria are excluded. This typically results in three to five core cohorts per location, rather than the dozen often seen on a typical service-line matrix. The channel plan is then built specifically for these selected cohorts, leading to fewer targets, deeper instrumentation, and clearer attribution at the cohort level. This allows the growth director to defend segments by name and margin in budget cycles, rather than justifying channel spend.
The Coordination Problem No Vendor Stack Solves
Briefing Cycles as the Real Cost Center
Every strategic decision within a multi-location growth program incurs a cost related to the number of vendors requiring briefings. A pricing change for a service line, for example, necessitates informing the SEO agency, PPC agency, content vendor, and backlink team. Each interaction consumes time, leads to revisions, and causes calendar delays before any work is implemented.
The arithmetic is stark: one strategic decision, multiplied by four channel vendors, multiplied by fifteen locations, results in sixty briefing touchpoints per quarter for a single change. Ten such changes per quarter—a conservative estimate for active service-line work—generate six hundred touchpoints. This significant calendar burden falls almost entirely on the growth director, who occupies the most expensive seat in the program.
Care coordination research in clinical settings reveals a similar pattern: when handoffs multiply across teams, errors and delays compound faster than any single team's quality controls can manage 4. The solution in clinical operations was not to improve handoffs, but to reduce their number by implementing a coordinating function with shared accountability across workstreams.
Marketing has yet to adopt this approach. Most growth programs still view coordination drag as a soft cost, despite it often being the largest unacknowledged line item in the budget.
Consolidation Economics: Fragmented Stack vs. Unified Execution
The financial argument for consolidation is not based on variable per-vendor retainer fees, but on the quantifiable impact of coordination load, time-to-publish, and the proportion of senior leadership's time consumed by handoff tasks. These variables can be assessed without arbitrary dollar figures.
The table below compares a fragmented vendor stack against a unified execution model based on inputs that directly influence margin. Wage growth of 4.3 percent 2 is applied to internal coordination time. The 44 percent allocation of marketing spend to digital channels 5 determines the budget share exposed to channel-vendor overhead. Referral concentration, following the 80/20 rule 3, indicates how much revenue depends on relationship work that cannot be easily outsourced.
| Variable | Fragmented Stack (4 vendors) | Unified Execution |
|---|---|---|
| Briefing cycles per strategy change | 4 vendors × N locations | 1 plan, propagated |
| Time-to-publish, new service-line page | 3–6 weeks | Days, not weeks |
| Coordination load on growth director | 40–60% of calendar | 10–20% of calendar |
| Channel overlap (paid vs. organic on same intent) | Frequent, undetected | Resolved at plan level |
| Margin contribution measurement | Per-channel, last-click | Per-cohort, contribution share |
| Exposure to wage inflation (4.3%) 2 | Compounds across vendors | Absorbed in single program |
| Platform cost (declared) | Variable retainers per vendor | $599/mo account-level |
The most critical metric in this comparison is the coordination load on the growth director. A senior operator spending half their time on briefings is not dedicating that time to building referral relationships with the top 20 percent of sources driving the pipeline 3. The fragmented stack fails not because vendors are ineffective, but because the operating model forces the most expensive individual in the program to act as a project manager for multiple parallel agencies.
Consolidation in healthcare delivery has evolved from merely achieving scale to fostering strategic collaborations focused on shared outcomes 10. The growth function is due for a similar transformation.
Unlock Consistent, Scalable Healthcare Growth—Without Agency Bottlenecks
Discover how unified AI-powered marketing can streamline multi-location growth, cut coordination time by 60%, and improve campaign ROI across all channels. See how leading healthcare brands are transforming their model for measurable impact.
The Operating Model: One Account-Level Plan, Four Workstreams
The Lead Strategist Layer and Why It Cannot Be Outsourced Piecemeal
A unified growth program requires a coordinating function that oversees all channel work, rather than being embedded within any single one. This role, whether termed a lead strategist, head of growth operations, or chief of staff for the marketing P&L, must possess the authority to manage segment selection, margin targets, and the simultaneous propagation of strategic decisions across all workstreams. Without this overarching layer, the program will revert to channel silos within a quarter, regardless of any nominal vendor consolidation.
Piecemeal outsourcing specifically undermines this critical layer. An SEO agency cannot determine which segments warrant organic investment because it lacks visibility into the contribution math across paid, referral, and content channels. Similarly, a PPC vendor cannot deprioritize a branded campaign that cannibalizes organic traffic, as this would eliminate its own line item. The coordination decisions must reside with the operator or a partner whose accountability spans all workstreams at the account level.
Failed agency relationships in healthcare often exhibit this pattern: handoff delays, fragmented accountability, and outcomes that no single party fully owns 8. The solution is not merely better vendor management, but the elimination of the structural divisions that vendor management attempts to bridge.
AI as the Coordination Layer, Not a Content Faucet
Many healthcare marketing teams have encountered AI primarily as a content generation tool—creating service-line pages, drafting meta descriptions, or spinning paid headlines. While valuable, this application is limited. It saves hours within a single workstream but leaves the fundamental coordination problem unaddressed.
The higher-value application of AI operates at a more strategic level. AI can manage tasks that overwhelm human calendars: analyzing GA4, Search Console, and ad-platform data across multiple locations concurrently; identifying paid-organic overlap for specific queries before the next bid cycle; pinpointing top-quintile referral sources that have become inactive; and updating all service-line pages when pricing changes occur. Predictive analytics, when applied to clinical and engagement data, has demonstrated measurable improvements in patient outcomes when signals are acted upon swiftly 6. The same principle applies to marketing operations: signal value diminishes over time, and coordination is where this decay is most rapid.
Treating AI as a coordination function, rather than solely a content generator, transforms the growth director's role. Their time shifts from managing briefing cycles to focusing on segment strategy, cultivating referral relationships, and engaging in high-level CFO discussions. This reallocation is the only way to achieve significant returns across a multi-location footprint.
What a Margin-Weighted Growth Plan Looks Like in a CFO Review
A margin-weighted growth director presents a more concise document in a quarterly CFO review than is typically seen. It consists of three pages. The first lists the patient segments selected for the quarter, ranked by projected lifetime value and contribution margin per encounter 9. The second maps workstreams—organic, paid, content, referral relations—against these segments, showing contribution share instead of last-click conversions. The third tracks coordination load: the number of briefing cycles, time-to-publish for new service-line pages, and the proportion of senior leadership's time spent on handoff tasks versus segment strategy.
What is omitted from this document is as important as what is included. There are no channel-by-channel ROAS comparisons, as the units are not comparable. There is no attribution debate, because the contribution model has already clarified which workstreams influenced which cohorts. There is no slide justifying the cost of branded paid search, as it has been priced as a tax against organic capture and budgeted accordingly.
The subsequent CFO conversation is also different. Margin per acquired patient is benchmarked against the current wage curve 2, not against a CPA target from the previous fiscal year. Service-line investment decisions are framed as segment bets with explicit LTV assumptions 9, which finance can stress-test just like any other capital allocation. The growth program thus transforms from an opaque line item into one of the clearer P&L discussions on the agenda.
This operating model is precisely what healthcare consolidation has been implicitly demanding for the past two years 10. Growth directors who implement this approach before the next budget cycle will spend less time defending channel expenditures and more time strategically selecting segments that drive future expansion.
Frequently Asked Questions
References
- 1.What to expect in US healthcare in 2026 and beyond..
- 2.Rising healthcare costs strain health system margins..
- 3.A Guide to Maximizing Physician Referral Strategies..
- 4.Care Coordination..
- 5.The impact of marketing strategies in healthcare systems..
- 6.Unveiling the Influence of AI Predictive Analytics on Patient Outcomes..
- 7.Patient Segmentation: Adjust the Production Logic to the Medical..
- 8.When Agency Fails: An Analysis of the Association Between..
- 9.How to calculate patient lifetime value..
- 10.The New Era of Healthcare Consolidation: From Scale to Strategic Collaboration..