
Key Takeaways
- Patient acquisition stops scaling because per-location retainers create linear costs and fragmented execution, while the inputs that actually move volume can be produced once and distributed across every market.
- Four coordinated inputs drive multi-market volume: publicly reported quality data 1, narrative review reputation 6, a low-friction digital front door 13, and telehealth-enabled geographic reach 7.
- Centralized, account-level production bends the cost curve sublinearly, compressing time-to-launch and replacing duplicated briefs with one strategy, one approval cycle, and one reporting model across sites.
- Multi-site operators should measure booked appointments and downstream service-line attachment, segment production between attributed lives and fee-for-service procedural care, and route capacity by market structure rather than ranking locations against each other 12, 15.
Why acquisition stops scaling at the system level
Hospital patient acquisition breaks down at the system level for a reason most growth teams underestimate: the work that produces patient volume in a single market does not compound when replicated across many. Each new location adds its own retainer, its own content backlog, its own review profile, and its own intake conversion problem. The cost curve goes linear. The execution calendar goes ragged. Volume targets get hit in three markets and missed in seven, and the post-mortem blames local conditions when the real issue is coordination.
The clinical side of the house is moving in the opposite direction. An American Hospital Association analysis using Vizient data found that risk-adjusted hospital mortality in Q1 2024 was roughly 22% below the Q4 2019 baseline, even as case mix grew sicker 2. That figure matters for growth operations because it changes what quality data can do. Performance that once read as a compliance obligation now reads as a differentiator publicly visible on CMS Care Compare 1, and visible quality shapes consumer choice and payer network design.
The implication for a multi-site operator is direct. The inputs that actually move patient volume across markets, quality signal, reputation, digital access, and virtual reach, are produced once and distributed everywhere. The agency model built around per-location retainers cannot exploit that economics. The rest of this piece lays out the four inputs, the coordination tax that erodes them, and the operating model that holds them together as a system grows.
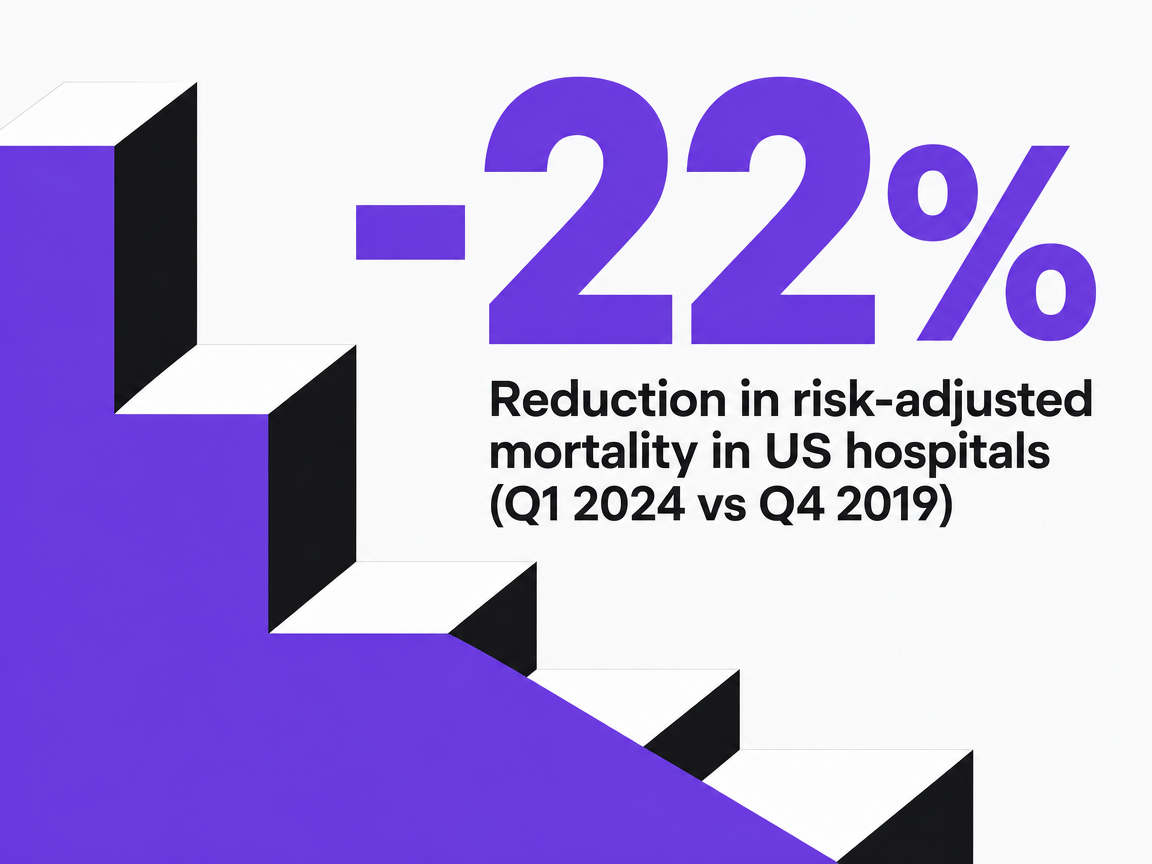 Reduction in risk-adjusted mortality in US hospitals (Q1 2024 vs Q4 2019)
Reduction in risk-adjusted mortality in US hospitals (Q1 2024 vs Q4 2019)
The four inputs that move patient volume across markets
Quality signal: public reporting as a demand-side variable
Publicly reported quality data has changed function. CMS Care Compare publishes hospital-level measures across mortality, readmission, safety, and patient experience domains, and the agency states the program exists to help patients make informed choices and to push hospitals toward improvement 1. For a growth operation, that page is no longer just a regulatory artifact. It is a demand-side input that payers, employer benefits consultants, and a non-trivial share of consumers consult before a referral or a network design decision lands.
A systematic review of hospital reputation and choice found that reputation operates as a key determinant of selection, especially in conditions where patients cannot easily interpret raw clinical data 17. Care Compare scores feed that reputation indirectly through news coverage, employer scorecards, and physician referral patterns. The implication is that quality reporting performance and growth performance share an upstream variable, and a marketing function that treats them as separate workstreams forfeits the cheapest source of differentiation it has.
The competitive context sharpens this point. A difference-in-differences analysis found that hospitals in more competitive markets showed improvements on certain quality measures, though effects were uneven across regions and indicators 8. In concentrated markets, the gap between leaders and laggards on publicly reported measures is what shifts referral flow when payers redesign tiered networks or narrow specialty panels.
For multi-site operators, the operational consequence is specific. Quality data should be pulled into the same content production calendar that runs service-line pages, physician bios, and market-entry assets. A new orthopedic location launching in a competitive market does not need a brochure; it needs its risk-adjusted outcomes, complication rates, and patient experience scores translated into pages that rank, into payer-facing briefs, and into referring-physician materials, produced once at the system level and deployed everywhere.
Reputation engine: narrative reviews and the demand they generate
Star ratings are the visible layer. The economic action sits in the narrative underneath them. A study of online review content and provider selection found that narrative reviews shift choice independently of numerical ratings, conveying nuance about communication, wait experience, and trust that a five-point scale cannot carry 5. Patients read the paragraphs, not just the stars, and the paragraphs change what they do next.
The hospital-level evidence is harder than the marketing literature usually admits. A Department of Justice working paper analyzing online reviews and hospital choices concluded that consumer-generated ratings meaningfully affect hospital demand and that this novel quality information can move both patient flow and commercial payment levels 6. An empirical study of online reviews and patient selection of physicians and hospitals reported that higher ratings are associated with greater selection even when objective clinical quality data is not directly accessible to the consumer 18. Reputation is not a soft variable. It is priced into volume and, downstream, into payer contracts.
The mechanism that builds those reviews is internal. A systematic review of patient satisfaction identified communication, responsiveness, and waiting times as the consistent drivers across studies 9. Those operational details produce the narrative content that later moves choice. A reputation program disconnected from intake operations, discharge process, and call-center responsiveness is a logo on a dashboard, not a growth lever.
For a system running fifteen or thirty locations, the operational read is that review acquisition, response, and analysis cannot live as a per-site task assigned to a local marketing coordinator. The volume of narrative content across a multi-site footprint is the raw material for service-line differentiation, market-level positioning, and intake script refinement. It needs to be aggregated, tagged by service line and location, and routed back into both the operational improvement cycle and the content production system. The reputation systematic review caveat is worth holding in view: reputation can lag actual current quality, and rating platforms carry selection bias and gaming risk 17, 18. Treating reviews as ground truth is a mistake. Treating them as the most current signal of how the market perceives a location is not.
Digital front door: portals, scheduling, and the friction tax
Patient portals were funded as engagement tools. They function as acquisition infrastructure. A state-of-the-science review of patient portals reported that portal use is associated with higher preventive service utilization and more consistent chronic disease monitoring visits, indicating real downstream volume effects when adoption is high 13. The portal is where new-patient registration, intake forms, scheduling, and message-based triage either compound a marketing investment or quietly erode it.
Patient preferences point the same direction. A review of patients' perspectives on digital health tools identified empowerment, self-management, and personalization as the main drivers of uptake, with digital literacy and privacy concerns as the binding barriers 3. A complementary paper on delivering digital health solutions found that tools co-designed with patients see higher adoption and more relevant impact than tools designed in isolation from the people who use them 4. Hospitals that procure a portal and treat configuration as an IT task lose the acquisition leverage the technology was supposed to provide.
The friction tax is concrete. When a search ad routes a prospective patient to a location page, the conversion event is rarely the click. It is the completed first appointment, which depends on whether scheduling works on mobile, whether new-patient intake can complete without a phone callback, and whether the portal account creation step survives contact with a 60-year-old on a cellular connection. The portal review notes meaningful disparities in adoption by age, race, education, and broadband access 13, which means a single national configuration optimized for an urban academic medical center will underperform when deployed across a rural Midwestern footprint.
The operational consequence for multi-location systems is that the digital front door is a system-level product, not a per-site landing page. Intake flows, scheduling logic, and portal onboarding should be designed once, instrumented end-to-end in GA4 and the CRM, and tuned against conversion data drawn from every location simultaneously.
Virtual access: telehealth as a geographic reach lever
Telehealth changed the geographic boundary of the addressable market. Medicare telehealth visits grew from roughly 5 million in 2019 to over 53 million in 2020, an order-of-magnitude shift in a single year that established virtual care as a mainstream modality rather than a pilot 7. For a multi-site operator, that figure is not a pandemic artifact. It is the year the catchment radius for several specialties stopped being defined by drive time.
Medicare telehealth visits: 2019 vs. 2020
- 2019: ~5 million visits
- 2020: ~53 million visits
Source: Yale Medicine summary of multi-site telehealth trial and Medicare utilization data 7
The clinical evidence has caught up enough to support acquisition messaging. The Yale-referenced multi-site trial in early palliative care for advanced lung cancer reported quality-of-life outcomes equivalent between telehealth and in-person delivery 7. A 2025 systematic review of telehealth adoption and patient outcomes concluded that telehealth generally improves outcomes and reduces hospital utilization across multiple conditions, while flagging heterogeneity in study quality 10. An earlier access-focused review found that telehealth interventions increase completed visits and reduce travel burden, with effects on overall utilization and cost varying by context 14.
The operational read for a system with locations spread across a region is that telehealth-enabled service lines, behavioral health, endocrinology, follow-up oncology, post-surgical check-ins, function as a virtual hub that extends every physical location's effective reach. A patient in a rural ZIP code who would never drive ninety minutes for an in-person second opinion will book a virtual one, and that visit becomes the on-ramp to procedural care that does require travel.
The constraints are real. The access review notes risks of fragmentation when virtual visits are not integrated with primary care, and the digital divide reappears here as it does with portals 14. Reimbursement policy remains in motion. None of that changes the acquisition math. Virtual access is now the most efficient way to introduce a new geographic market to a system's specialty depth before, or instead of, opening a physical location there.
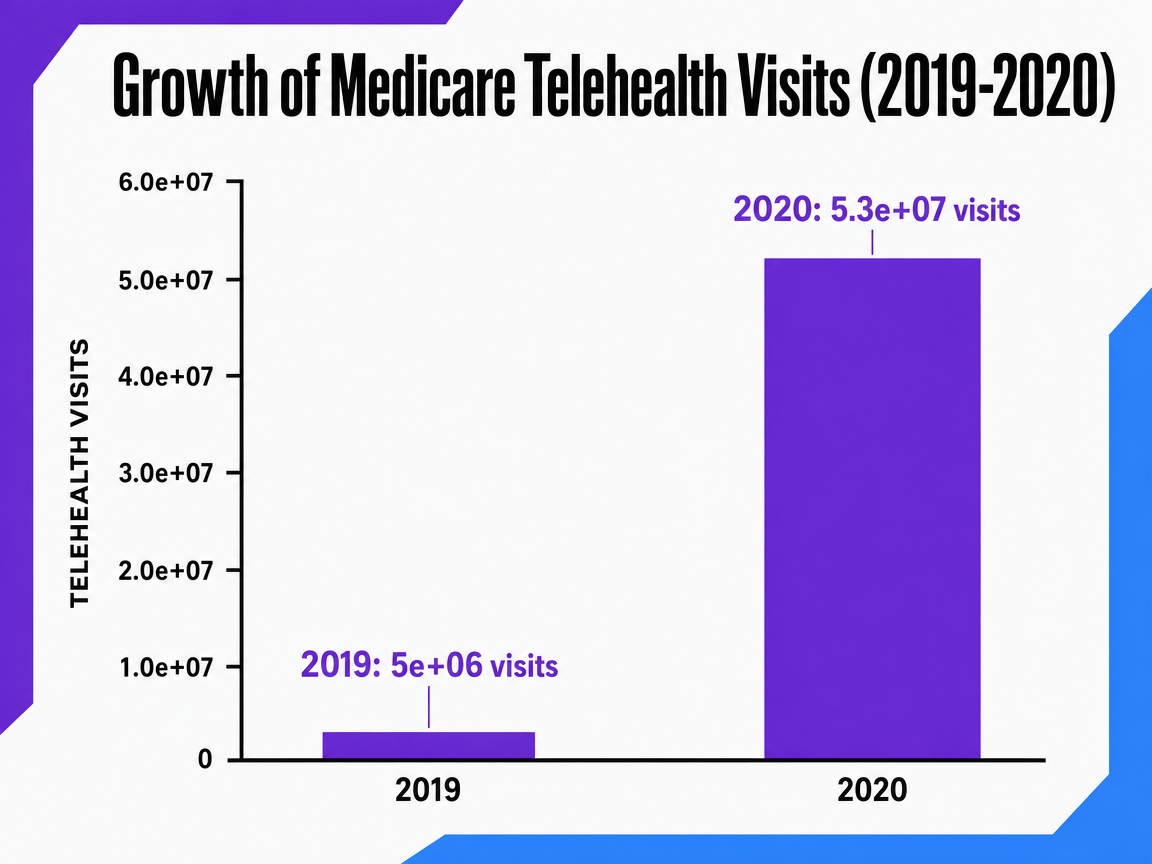 Growth of Medicare Telehealth Visits (2019-2020)
A time-series comparison showing the dramatic increase in telehealth visits between 2019 and 2020. This can be a bar chart comparing the two years.
Coordination as the hidden tax in multi-market growth
The four inputs that move volume are knowable. The reason most systems fail to compound them across a footprint is mechanical: every new location adds touchpoints that have to be reconciled by hand. A 15-site system running quality content, reputation response, portal optimization, and telehealth promotion through a different agency or local coordinator at each site is not running one growth program. It is running 15, and the integration work falls on a marketing leader whose calendar was already full.
The narrative review of digital marketing in healthcare frames the problem at the tactical level, concluding that coordinated digital marketing can raise patient awareness and engagement but that fragmented execution and regulatory variability blunt the effect 19. The healthcare marketing strategy literature reaches a similar conclusion from a different angle, arguing that effective programs start from patient needs and service design rather than channel-by-channel campaigns 11. Both findings point to the same operational fact. The work that produces patient volume, quality data translated into content, narrative reviews aggregated and acted on, portal flows tuned against conversion, telehealth service lines packaged for new markets, has to be produced inside a single system or the production cost rises faster than the output.
The coordination tax shows up in three places a growth executive can name without prompting:
- Time-to-launch in a new market stretches from weeks to quarters because every asset has to be briefed, reviewed, and trafficked separately.
- Quality of execution drifts because no single team owns the standard across markets.
- Reporting becomes a reconciliation exercise rather than a decision tool, with GA4, CRM, and call-tracking data living in formats that do not roll up cleanly.
The hospital advertising review found evidence on marketing impact remains mixed and methodologically uneven, in part because programs are rarely instrumented well enough to isolate what worked 12. That measurement gap is itself a coordination problem.
Test scalable patient acquisition workflows in real time
Experience hospital marketing execution that adapts instantly to multi-site expansion, without added coordination or cost drag.
If you manage multiple locations: the economics of centralized production
The remainder of this piece speaks directly to operators running five or more sites under a single growth budget. At one or two locations, the per-location agency model is irritating but tolerable. At fifteen or thirty, the math stops working, and the reason is not pricing. It is the shape of the cost curve.
Two production models compete for the same output. In the per-location retainer model, each site contracts its own scope, briefs its own content, manages its own review profile, and pays a fixed monthly fee. Cost rises linearly with site count. Coordination touchpoints rise faster than linearly, because every cross-market initiative, payer-facing quality content, a new telehealth service line, a portal flow change, has to be re-briefed and re-approved at each engagement. In the account-level production model, strategy, content production, and measurement run once at the system level and deploy to every location. Cost behavior is sublinear: adding a sixteenth site adds distribution work, not a new production stack.
Per-location retainer vs. account-level production as site count scales
| Dimension | Per-location retainer (N sites × R) | Account-level production (C + small marginal cost per site) |
|---|---|---|
| Cost behavior at 5, 15, 30 sites | Linear: 5R, 15R, 30R | Sublinear: C, C + minor delta, C + larger but flattening delta |
| Coordination touchpoints | Scales with N (separate briefs, approvals, reporting per site) | One brief, one approval cycle, one reporting model |
| Content output dependency | Bounded by each agency's local capacity | Bounded by central production cadence, shared across sites |
| Time-to-launch in a new market | Weeks to quarters per market | Days to weeks once the system pattern exists |
Conceptual model. R = per-location retainer; C = centralized production cost; N = number of sites. Grounded in the digital marketing review's finding that coordinated execution outperforms fragmented tactics 19and the healthcare marketing framework's emphasis on system-level service design 11.
The narrative review of digital marketing in healthcare reaches the same conclusion from a tactical angle: coordination across channels raises awareness and engagement more reliably than isolated campaigns, and fragmented execution dampens measurable effect 19. The healthcare marketing strategy literature argues that effective programs start from service design and patient needs rather than channel-level activity, which is harder to do when each market is running its own playbook 11.
The operational takeaway for a multi-site marketing leader is to identify which work genuinely requires local execution, community relationships, physician liaison, in-market events, and which work is being duplicated across markets without local value-add. Quality content, reputation infrastructure, portal optimization, and telehealth service-line assets sit in the second category. Pulling them into a single production system is where the cost curve bends.
Measuring the system, not the campaign
Most multi-site marketing dashboards still report campaign-level metrics: cost per click, form fills, attributed appointments by source. Those numbers describe activity. They do not describe whether the acquisition system is compounding. A growth program built on the four inputs needs a measurement layer that reads at the account level and rolls down to the location, not the reverse.
Three measurement shifts separate systems that compound from systems that churn:
- Acquisition cost has to be calculated against booked first appointments and downstream service-line revenue, not against leads. The hospital advertising review found that most studies in the field cannot isolate marketing effect because outcomes are measured too far upstream of actual care delivery 12. A system that tracks intake conversion, no-show rate, and 90-day service-line attachment by market exposes which inputs are producing patient volume and which are producing noise.
- Quality and reputation data have to sit in the same reporting model as paid and organic performance. Care Compare scores 1, narrative review themes 5, and HCAHPS-driven satisfaction signals 9are leading indicators of conversion efficiency in the markets where they move. Treating them as separate quarterly reports hides the connection.
- The unit of analysis is the system. Reporting that ranks locations against each other without controlling for market structure, payer mix, and competitive density misallocates budget toward markets that were already easy. The competition literature is clear that effects vary by context 16. A scalable model measures the program once, decomposes performance by market characteristics, and routes production capacity to where the next dollar produces the most volume.
See How Leading Hospital Networks Scale Patient Acquisition—Without Linear Cost Increases
Request a data-backed walkthrough of AI-driven patient acquisition models proven to reduce marketing coordination complexity for multi-location healthcare systems and high-volume digital agencies.
What value-based contracts change about good acquisition
Risk-bearing arrangements rewrite the definition of a valuable patient. Under the ACO REACH model, participating organizations are accountable for total cost and quality for aligned Medicare beneficiaries, with the program designed to improve care through better coordination, enhanced access, and increased accountability 15. A growth program optimized for fee-for-service volume will overshoot in some service lines and underperform in others once a meaningful share of revenue runs through total-cost-of-care contracts.
The acquisition implication is segment-level. For attributed lives, the work is retention, primary care engagement, and chronic-disease management, the inputs that move total cost of care, not new procedural volume. Portal-enabled monitoring and telehealth follow-up, which the evidence links to higher preventive service use and reduced hospital utilization 13, 10, stop being engagement nice-to-haves and become contract performance levers. For fee-for-service service lines, particularly elective specialty care, conventional volume acquisition still applies, but the messaging has to survive payer scrutiny on appropriateness as networks tighten.
The operational read for a multi-site system carrying both contract types is that one acquisition program no longer serves both. Production capacity has to be segmented by population: attributed-lives content and outreach run on a retention-and-management cadence, while procedural service lines run on a conventional demand-generation cadence. Reporting needs to separate the two, or budget will keep flowing to the easier-to-measure side while the contract-performance side quietly erodes.
Where the evidence is thinner than the marketing literature suggests
A model built on four inputs is only as honest as its weakest source. The hospital advertising systematic review concluded that evidence on the impact of hospital advertising on patient outcomes and costs remains sparse and of variable quality, with most studies unable to isolate causal effects 12. The competition literature shows similar fragility: a systematic review found competition may be associated with better quality in some contexts, but effects are mixed and highly context-dependent 16. Reputation research carries its own caveats, including the finding that online ratings can reflect selection bias and may lag actual current quality 17.
Two practical consequences follow. Treating any single input as a guaranteed lever overstates what the research supports; the inputs work as a coordinated system, not as standalone tactics. And measurement has to do the work that the literature cannot. A multi-site operator who instruments intake conversion, downstream service-line attachment, and market-level performance against quality and reputation data builds the internal evidence base the published research is still missing. The scalable model is defensible because it is measured, not because each lever is independently proven.
 Increased patient survival likelihood vs. expectation (Q1 2024 vs Q4 2019)
Increased patient survival likelihood vs. expectation (Q1 2024 vs Q4 2019)
Frequently Asked Questions
References
- 1.Hospital Quality Initiative Public Reporting.
- 2.New Analysis Shows Hospitals Improving Performance on Key Patient Safety Measures, Surpassing Pre-Pandemic Levels.
- 3.Patients' perspectives on digital health tools.
- 4.Delivering Digital Health Solutions that Patients Need: A Call to Action.
- 5.The Impact of Narrative Reviews on Patient E-doctor Choice.
- 6.Online Reviews and Hospital Choices (U.S. DOJ working paper version).
- 7.Telehealth Is Just as Effective as In-person Care, Study Finds.
- 8.Can competition improve hospital quality of care? A difference-in-differences analysis.
- 9.Patient Satisfaction with Healthcare Services and the Techniques for Improvement: A Systematic Review.
- 10.The Impact of Telehealth Adoption on Patient Outcomes: A Systematic Review.
- 11.The impact of marketing strategies in healthcare systems.
- 12.The effectiveness of hospital advertising: systematic review.
- 13.Patient Portals and Patient Engagement: A State of the Science Review.
- 14.Telehealth and patient access: systematic review.
- 15.ACO REACH Model.
- 16.Effects of hospital competition on quality and efficiency: a systematic review.
- 17.Hospital reputation and choice of hospital: systematic review.
- 18.Online reviews and patient selection of physicians and hospitals.
- 19.Digital marketing strategies in healthcare: narrative review.