
Key Takeaways
- Content's importance is settled in budget conversations, but contribution is not; closing the gap takes a loaded-cost ROI formula, a chosen attribution model, and a self-reported layer running in parallel.
- Anchor ROI to closed-won revenue from the CRM and build the denominator on fully loaded costs, so the headline number reconciles with the same ledger finance already books 1.
- Treat attribution as an operating decision: replace last-touch with U-shaped or W-shaped multi-touch, but only after standardizing lifecycle stages, UTMs, and opportunity timestamps in a unified data layer 4, 3.
- Add one open-text "how did you hear about us" field on high-intent forms and report self-reported sources alongside software-tracked credit, since the disagreement between columns is the insight 8, 9.
- Swap the linear funnel for Forrester's Discover, Explore, Buy, Use, Ask, Engage stages, and extend content KPIs into post-sale so onboarding and education content get credit for net revenue retention 14, 18.
- Run a three-tier cadence: weekly leading indicators, monthly pipeline influence with reconciled views, and quarterly sourced revenue benchmarked against vertical medians, budgeting 16 to 20 analyst hours monthly for the hybrid layer 1, 9.
- As attention fragments and content automation scales output, the loaded-cost ROI math, multi-touch model, self-reported layer, and lifecycle KPI map become more valuable, not less, for keeping production governed against revenue 12, 11.
The Measurement Gap Between Content Importance and CFO-Ready Revenue Math
Roughly 71% of B2B marketers say content marketing has become more important to their organization year over year, yet most demand gen teams still walk into quarterly reviews with traffic charts instead of sourced revenue 13. That gap is the entire problem. Importance has been settled in the budget conversation. Contribution has not.
The pattern shows up the same way across teams: a content calendar producing decent organic traffic, a marketing automation platform reporting MQLs, and a CRM that quietly disagrees with both. When the CFO asks what closed-won revenue the program influenced last quarter, the answer arrives in three different numbers depending on which dashboard gets pulled. None of them survive a follow-up question about lead quality or pipeline velocity.
Closing that gap takes three layers running in parallel, not a better dashboard:
- The first is an ROI formula tied to CRM-stage revenue rather than top-of-funnel engagement.
- The second is an attribution model selected as an operating decision, with explicit trade-offs around how mid-funnel content gets credited 3.
- The third is a hybrid layer that pairs software-based multi-touch tracking with self-reported attribution to capture the demand-creation channels software cannot see 9.
The sections that follow build each layer in the order a demand gen manager would actually deploy them.
The ROI Formula That Survives a CFO Conversation
Define Revenue at the Closed-Won Stage, Not the MQL
The formula itself is unremarkable: revenue minus investment, divided by investment, multiplied by one hundred 1. What breaks in most reporting is the numerator. Teams plug in MQL-stage value or pipeline created, then watch the number get challenged the moment finance asks which deals actually closed.
Revenue belongs at the closed-won stage in the CRM, pulled from opportunity records that carry a content touchpoint within the attribution window. That means closed-won amount, not annualized contract value inflated by assumptions, and it means deals where the content engagement preceded or accompanied the opportunity creation date. Pipeline-influenced revenue is a legitimate secondary metric for forward-looking conversations, but the headline number reported to the CFO should reconcile to the same closed-won figure the finance team already books. When marketing's revenue claim and finance's revenue ledger agree at the deal level, the ROI conversation moves past methodology and into program decisions 1.
The Investment Side: Loaded Cost, Not Just Production Spend
The denominator is where most ROI calculations quietly inflate. Production spend, the freelance writer invoice or the agency retainer, is the visible cost. The loaded cost is everything else the program actually consumes: salary allocation for the demand gen manager, SEO tooling, CMS and analytics subscriptions, design hours, distribution spend, and the proportional cost of the marketing automation seats the content workflow touches.
Finance teams already know the fully loaded number. Submitting a ROI calculation that uses only freelance invoices invites the obvious correction and undermines the rest of the report. Build the denominator from the same general-ledger categories the CFO sees: people, software, services, and media. The resulting ROI will be lower than the production-only version, and it will be the version that holds up under scrutiny 1.
Benchmarks: What Good, Median, and Underperforming Look Like
A ROI number means nothing without a peer comparison. Recent B2B medians give demand gen teams a defensible reference point. Column Five's cross-industry analysis places median content marketing ROI at:
- Roughly 420% for B2B SaaS
- 400% for fintech
- 350% for professional services
- Programs falling below 200% generally classified as underperforming relative to peers 1
Those numbers reset the conversation. A program returning 180% is not a moderate success awaiting more time; it is sitting beneath the threshold where most comparable programs operate. A program at 350% in professional services is on the median, not ahead of it. The reference line at 200% is the operational signal worth marking on any internal dashboard, because it separates programs that warrant continued investment at current shape from programs that need a structural change to content mix, distribution, or conversion path.
Vertical context matters when reporting. SaaS programs benefit from higher contract values and shorter consideration windows that compress payback. Professional services programs carry longer cycles and lower deal counts, which is why the median sits lower even when execution quality is comparable. Reporting a 380% ROI as a SaaS team is a below-median result; reporting the same number in professional services is above median. Same math, opposite conversation. Tag every benchmark with the vertical it came from before bringing it into the CFO meeting 1.
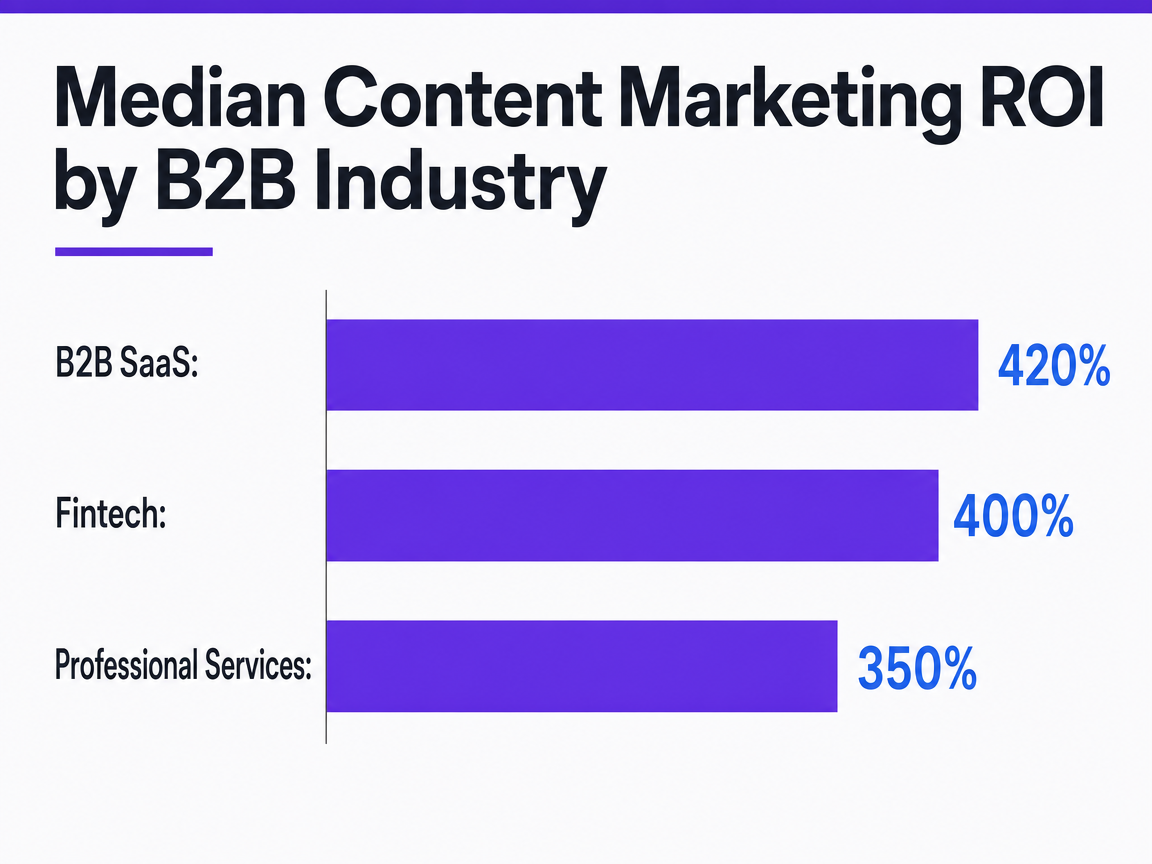 Median Content Marketing ROI by B2B Industry
Breakdown of median content marketing ROI benchmarks for different B2B verticals, as reported by Column Five Media. This can be visualized as a bar chart comparing the industries.
The 748% Outlier: When Thought-Leadership SEO Compounds
A separate benchmark sits well above the vertical medians. Long-running thought-leadership SEO programs post a median ROI near 748%, a figure cross-cited by First Page Sage and Column Five for programs that have run multiple years with consistent quality standards 2, 1. The scope matters: this is not a benchmark for all content marketing, and it is not what a six-month program should expect. It applies to multi-year SEO investments tied to subject-matter authority, not paid distribution, not social, and not short-form campaigns.
The number is useful for two arguments. It justifies the duration of a SEO investment that has not yet matured, and it sets the ceiling demand gen teams can credibly cite when modeling out-year returns. Citing 748% for a nine-month-old blog program will not survive the first follow-up question 2.
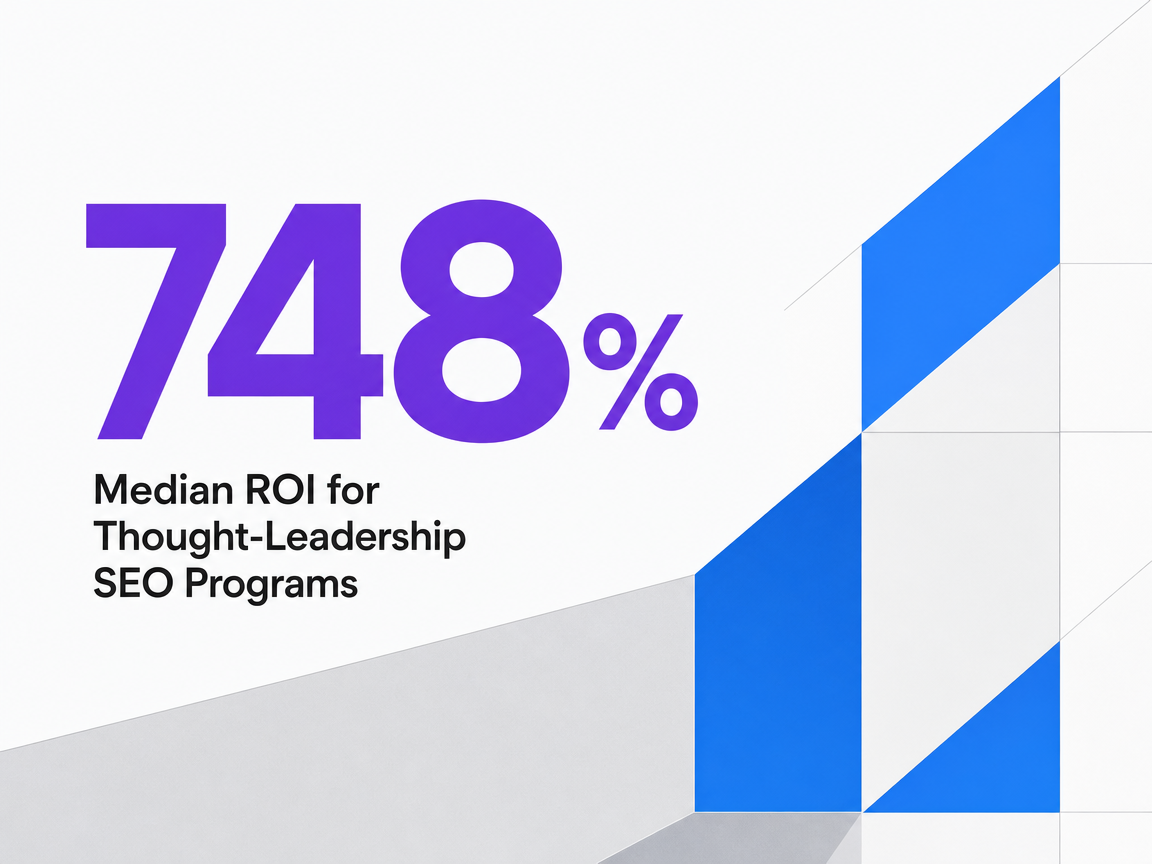 Median ROI for Thought-Leadership SEO Programs
Median ROI for Thought-Leadership SEO Programs
Attribution as an Operating System, Not a Quarterly Report
Why Last-Touch Keeps Winning the Argument and Losing the Truth
Last-touch attribution remains the default in most B2B platforms because it is the easiest to defend in a meeting: the last campaign before conversion gets the credit, and the report writes itself. It is also the most misleading model in common use, because it systematically strips credit from the early and middle content that did the actual persuading 4. A buyer who read four blog posts over three months and then converted on a branded paid search click gets recorded as a paid search win. The blog program looks expensive and ineffective in the same dashboard that the buyer's behavior contradicts.
The operational consequence is budget reallocation that follows the report rather than the buyer. Mid-funnel comparison content gets cut, demand-capture spend gets raised, and the pipeline thins out two quarters later when there is less mid-funnel content to convert against 3.
Choosing Between U-Shaped, W-Shaped, and Time-Decay
The practical replacement set is small.
U-shaped attribution : Splits credit between the first touch and the lead-creation touch, usually forty percent each, with the remaining twenty percent distributed across middle interactions.
W-shaped attribution : Adds a third anchor at opportunity creation, splitting roughly thirty percent to each of the three milestones.
Time-decay attribution : Assigns progressively more credit to touches closer to the close date, useful when sales cycles are long and the most recent content carries the most persuasive weight 4.
For most B2B demand gen teams, U-shaped is the right starting point and W-shaped is the right next step once opportunity-stage data is clean in the CRM 4. Both models credit the early content that creates awareness and the mid-funnel content that drives conversion, which is precisely the credit pattern last-touch erases. Time-decay is the better choice for programs with sales cycles past nine months, where the buyer's most recent reading material correlates more tightly with deal momentum than the original discovery moment.
The implementation effort scales with the model. U-shaped runs natively in HubSpot, Salesforce, and most marketing automation platforms with minimal configuration 4. W-shaped requires standardized opportunity-creation events and clean stage definitions. Time-decay typically needs a separate analytics layer or a configured report rather than an out-of-the-box dashboard 3. Pick the model the team can actually maintain, not the one that looks most sophisticated in a slide.
The Unified Data Layer Required to Make Any Model Trustworthy
Model choice is downstream of data quality. Any attribution output, U-shaped or W-shaped or otherwise, is only as accurate as the touchpoint records feeding it 5. The work that determines whether attribution is useful or theatrical happens in the plumbing:
- Standardized lifecycle stages between marketing automation and the CRM
- Consistent UTM conventions enforced at the campaign-creation step
- Cross-channel tracking that includes offline touches like events and sales conversations
- A single source of truth for opportunity creation and closed-won timestamps 3
Without that layer, swapping from last-touch to W-shaped just rearranges the same flawed inputs and produces a different wrong answer. Demand gen teams that try to fix attribution by changing models, while leaving fragmented data behind, end the quarter with the same credibility problem in a new format. Build the unified layer first, then choose the model.
Measure True Content Impact With Full Access
Track content-driven pipeline and revenue attribution on live campaigns before making a commitment.
The Hybrid Layer: Self-Reported Attribution and the Dark-Social Problem
What Software-Only Attribution Misses
Software-based attribution can only credit touchpoints it can see. That excludes a long list of channels where B2B buyers actually form opinions:
- A podcast episode consumed on a phone with no UTM
- A slide screenshot shared in a private Slack community
- A peer recommendation in a closed industry group
- A LinkedIn post read in-app without a click
Those interactions move buyers from unaware to in-market, and they arrive at the website as direct or organic-brand traffic with no campaign data attached 9.
The consequence is a systematic underweighting of demand-creation content and overweighting of demand-capture channels. Paid search and retargeting collect credit for closing buyers who were already persuaded by content the tracking layer never recorded. Refine Labs calls this the attribution mirage: the report is internally consistent and externally wrong 9. The fix is not a better tag manager. It is asking the buyer.
Building the Self-Reported Form Field
Self-reported attribution adds one question to high-intent forms, usually demo requests, contact-sales, or pricing inquiries: how did you hear about us 8. The field works best as an open-text response rather than a dropdown, because dropdowns prime the buyer toward channels the marketing team already tracks and miss the specific podcast, newsletter, or community the team did not know was driving pipeline 7.
Placement matters more than wording. The question belongs on forms where intent is high enough that an extra field will not collapse conversion rate, which usually means bottom-of-funnel forms tied to a sales conversation, not gated ebook downloads. Keep the field optional. Buyers who skip it still convert; buyers who answer it produce the signal 6.
The answers need a categorization layer to be useful at the aggregate level. Raw responses like "saw your CEO on the SaaStr podcast" or "someone in our Pavilion Slack mentioned you" should be normalized into channel buckets weekly so the data rolls up into the same revenue view as software-tracked sources. Two hours of normalization work per week is the typical cost 8.
Reconciling Software Credit and Buyer Self-Report Into One View
The two layers measure different things and should not be averaged. Software-based multi-touch attribution captures demand-capture channels, the trackable touches that convert known buyers. Self-reported attribution captures demand-creation channels, the influences that made the buyer a buyer in the first place 9. Forcing both into a single weighted score erases the distinction the hybrid is meant to surface.
The reconciled view runs as two columns in the same revenue report. Closed-won opportunities show their multi-touch credit distribution on one side and their self-reported discovery source on the other, both tied to the same opportunity ID. When the two columns disagree, that is the insight. A deal that software credits to paid search but the buyer attributes to a podcast tells the demand gen team that podcast sponsorships are creating pipeline the platform is misreading 9. Report both columns to the CFO. The honest version of the number is the version that travels.
Replacing the Funnel With a Lifecycle KPI Map
Discover, Explore, Buy, Use, Ask, Engage: Content Metrics Per Stage
Forrester's lifecycle model retires the linear funnel in favor of six stages a buyer actually moves through: Discover, Explore, Buy, Use, Ask, and Engage 14. The reporting consequence for content is straightforward. Each stage gets its own KPI and its own revenue signal, and the program stops being evaluated on a single MQL number that compresses six different jobs into one metric.
Discover is the awareness stage, where buyers identify a need and begin researching solutions 15. Content metrics belong to non-branded organic sessions, podcast mentions surfaced by self-report, and assisted opportunity influence on accounts with no prior engagement history. The revenue signal is new logo pipeline created in accounts that first touched within the quarter.
Explore covers active evaluation. Comparison content, product-category guides, and detailed solution pages do the work here. The KPI is conversion rate from anonymous to known on mid-funnel assets, and the revenue signal is opportunity-creation rate among engaged accounts.
Buy is the deal stage. Case studies, ROI calculators, and sales-enablement content carry credit. The KPI is content-assisted opportunity progression between stages, and the revenue signal is closed-won rate on opportunities that touched late-stage content within thirty days of close.
Use, Ask, and Engage shift the lens to post-sale, where onboarding documentation, knowledge-base depth, and customer education programs become the measurable assets 15. The KPIs are time-to-first-value, support ticket deflection, and expansion opportunity rate sourced from in-product content engagement.
Post-Sale Content as Retention Revenue
Most content reporting stops at closed-won, which is where Forrester's Lifecycle Revenue Marketing framework breaks from convention. The argument is that marketing, sales, and customer success should share capabilities and metrics across pre- and post-sale stages, with content KPIs traveling into retention and expansion rather than ending at the contract signature 16, 17.
The practical implication for a demand gen manager is a second revenue column on the same content P&L: net revenue retention influence. Onboarding sequences, product education libraries, and customer-facing thought leadership get tagged to opportunities the same way acquisition content does, and the renewal or expansion deal gets credited back to the content touchpoints that supported the customer between purchases 18. Programs that count this column typically discover that post-sale content carries a higher ROI than the acquisition content getting most of the budget.
See How Top Marketing Teams Tie Content Performance Directly to Pipeline Revenue
Request a walkthrough of the exact workflows and data integrations used by enterprise brands to connect content output with qualified lead generation and measurable closed-won revenue.
A Reporting Cadence One Demand Gen Manager Can Actually Run
Weekly Leading Indicators, Monthly Influence, Quarterly Sourced Revenue
The cadence problem is rarely effort. It is mismatched frequency. Leading indicators get reported monthly when they should be watched weekly, and sourced revenue gets reviewed weekly when it only stabilizes quarterly. A three-tier cadence fixes the mismatch and fits inside one operator's calendar.
- Weekly belongs to leading indicators: non-branded organic sessions on priority pages, conversion rate on mid-funnel assets, and the self-reported attribution field response rate. These move fast enough that a seven-day check catches problems before they compound, and none of them require a CRM pull. A thirty-minute Monday review covers it.
- Monthly belongs to pipeline influence. Pull opportunities created in the prior month, distribute credit using the chosen multi-touch model, and reconcile against the self-reported column 3. The output is a content-influenced pipeline number with both software and buyer-reported views shown side by side 9. This is the meeting where mid-funnel investment decisions get made.
- Quarterly belongs to sourced revenue. Closed-won deals from the quarter get tied back to content touchpoints within the attribution window, ROI gets calculated on loaded cost, and the result gets benchmarked against the relevant vertical median 1. This is the number that travels to the CFO.
The Hours-Per-Month Cost of Each Attribution Layer
Cadence only works if the labor math works. The three reporting layers carry meaningfully different time costs, and a demand gen manager running this alone needs to know which hours go where before committing to the structure.
| Reporting Layer | Analyst Hours / Month | Primary Work |
|---|---|---|
| Software-only multi-touch attribution | 6–8 | Model configuration upkeep, UTM hygiene, monthly pipeline pull and credit distribution 3 |
| Self-reported attribution layer | 8–10 | Weekly normalization of open-text responses into channel buckets, monthly rollup into the revenue view 8 |
| Hybrid reporting cadence (both layers reconciled) | 16–20 | All of the above plus monthly two-column reconciliation and quarterly CFO-ready sourced revenue report 9 |
The hybrid layer roughly doubles the software-only commitment. That is the honest cost of catching demand-creation channels the platform cannot see, and it is the budget line worth defending when the alternative is a quarterly report that systematically misreads which content is producing pipeline.
What Changes When Attention Fragments and Production Scales
Two trends pull the measurement discipline in opposite directions. Deloitte's 2025 survey on digital media consumption documents how hyperscale social video platforms have splintered audience attention across formats and devices, making any single-channel view of content performance structurally incomplete 12. The same research arm separately finds that leading marketing organizations are turning to content automation to scale production, personalize at the asset level, and tighten the link between output and measurable performance 11.
The combined effect on a demand gen function is a wider surface area to measure and a faster cadence of assets entering the market. The methodology described in the prior sections, the loaded-cost ROI formula, the U-shaped or W-shaped multi-touch model, the self-reported layer, and the lifecycle KPI map, becomes more valuable as production scales, not less. Higher output without those guardrails generates more touchpoints the platform cannot interpret and more closed-won revenue the report cannot explain. Approval-first AI execution platforms like Vectoron are built to keep that loop governed: every asset ships against the same measurement structure the CFO already trusts.
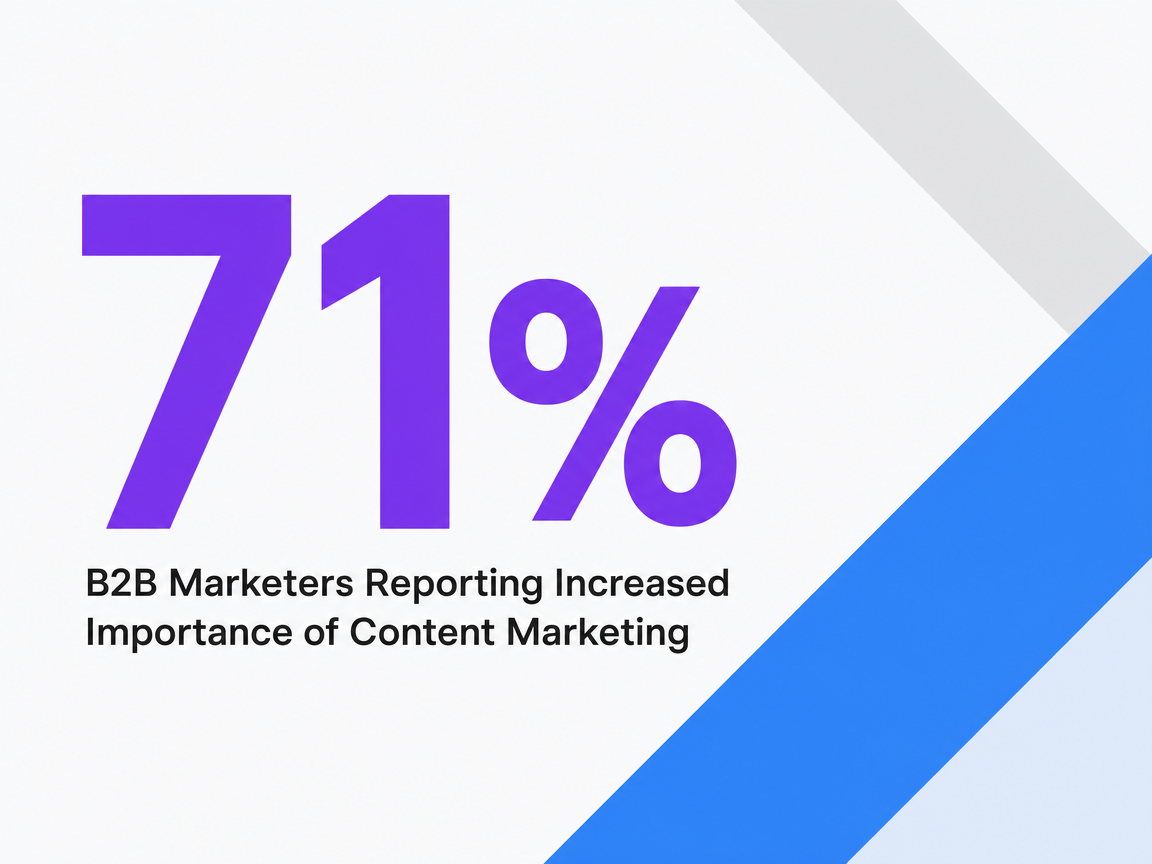 B2B Marketers Reporting Increased Importance of Content Marketing
B2B Marketers Reporting Increased Importance of Content Marketing
Frequently Asked Questions
References
- 1.Content Marketing ROI: How to Measure What Actually Matters.
- 2.Content Marketing ROI Statistics by Industry.
- 3.Complex B2B Marketing Attribution Made Simple: 10 True Models.
- 4.Marketing Attribution for B2B: The Models That Work and the ....
- 5.B2B Marketing Attribution: A Comprehensive Guide.
- 6.What is self-reported attribution?.
- 7.[Infographic] Should My Business Use Self-Reported Attribution?.
- 8.Self-reported attribution: what it is & why you need it.
- 9.The Attribution Mirage.
- 10.Content Marketing ROI for Universities.
- 11.Marketing content automation.
- 12.2025 Digital Media Trends.
- 13.The 2023 B2B Content Marketing Report.
- 14.Ditch the Funnel, Go for the Customer Life Cycle.
- 15.Customer Lifecycle Framework: A Guide for Growth Marketers.
- 16.Lifecycle Revenue Marketing: The Key To B2B Marketing Growth.
- 17.Lifecycle Revenue Marketing Capabilities Help B2B Triumph In A ....
- 18.Customer Success Plays A Crucial Role In Revenue Process Transformation.