
Key Takeaways
- Lead executive reports with marketing-sourced revenue, channel CAC, LTV/CAC, pipeline velocity, and payback period, since these are the five figures CEOs and boards consistently read 2.
- Triangulate across marketing-mix modeling, incrementality testing, cohort analysis, and real-time execution metrics, because no single method produces a defensible ROI figure on its own 1.
- Reconcile every platform-reported conversion against CRM closed-won records before any ROI math runs, since platform credit routinely overstates booked revenue by 40% or more 1.
- Build a unified first-party data layer through a CDP so SEO, paid, and backlink touches live on one customer profile that downstream attribution can actually query 611.
- Score the team honestly against the five-stage maturity model and fund the jump to the next stage rather than buying another platform that papers over weaker fundamentals.
- Run three nested reporting cycles—weekly operating reviews with sales, monthly finance reconciliation, and a one-page quarterly QBR—so cadence itself becomes the credibility asset 8.
Why CFOs Stop Believing the Marketing Number
The credibility gap rarely opens with a fight. It opens with a CFO scrolling past the marketing slide. Google Ads claims a 6.2x return. LinkedIn reports a 4.1x. The paid social agency shows a 5.8x. Add them up and marketing supposedly drove more revenue than the company actually booked last quarter. That arithmetic problem is what executives notice, and once they notice it, every subsequent number gets discounted.
Demonstrating the return on marketing spend remains the single hardest reporting problem most leadership teams face, and the failure mode is consistent: platforms over-credit themselves, last-click models reward whichever channel happened to close the browser tab, and marketing-sourced revenue claims routinely exceed booked revenue by forty percent or more once reconciled against the CRM 1. A CFO does not need to understand attribution theory to spot that the math does not close.
The fix is not a better attribution model. Boston Consulting Group's research is direct on this point — no single methodology produces an executive-defensible number on its own, and convergence across multiple methods is what builds confidence 1. The marketing leaders who keep their budgets present a measurement system, not a single ROI figure. They report in the financial language already used by the finance team: marketing-sourced revenue, customer acquisition cost broken out by channel, lifetime-value-to-CAC ratio, and payback period 2.
What follows is the operating system underneath that report — the metrics, methods, reconciliation steps, and data layer required to make the number hold up under scrutiny across SEO, paid, and backlink programs running in parallel.
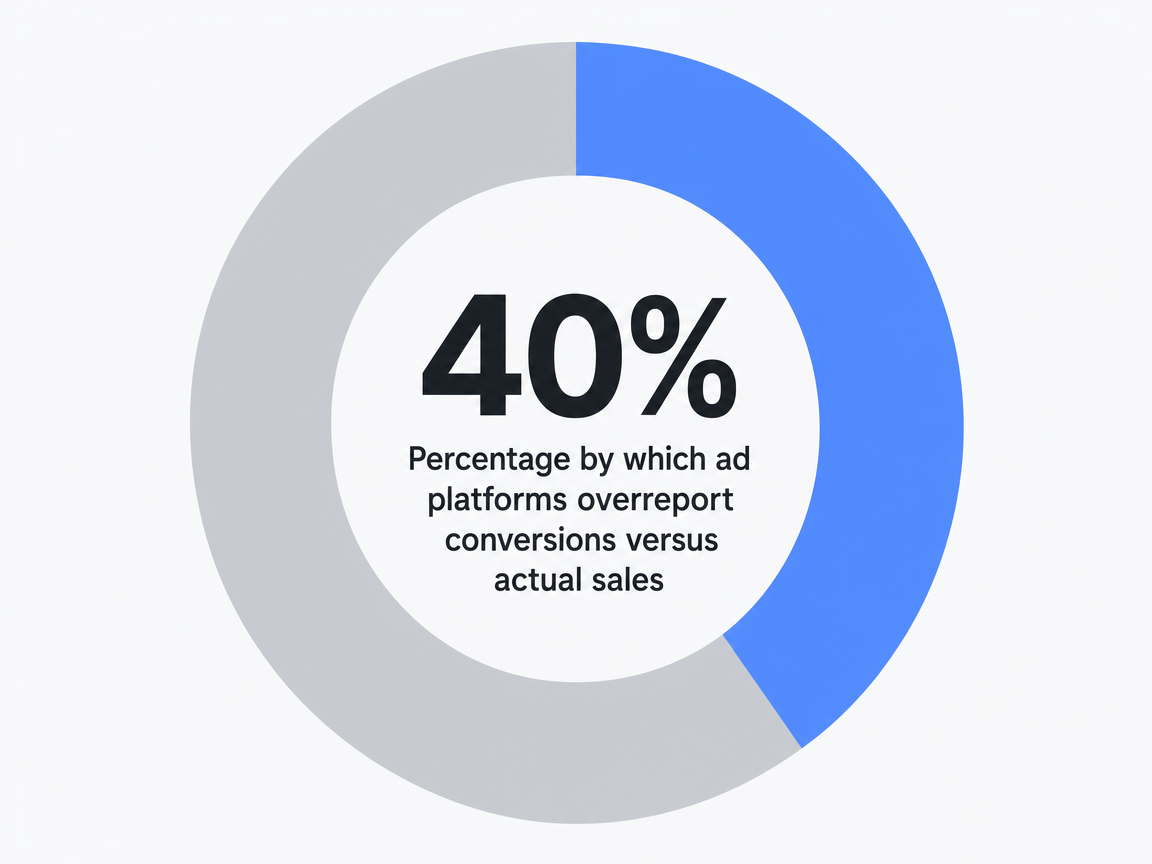 Percentage by which ad platforms overreport conversions versus actual sales: 40%
The Five Metrics Executives Actually Read
Marketing-Sourced Revenue as the Anchor
The first number on the slide should be marketing-sourced revenue — closed-won dollars where marketing originated the opportunity, defined by a tight sourcing rule the sales team has signed off on. That definition matters more than the figure itself. If sales believes a deal was self-sourced and marketing claims it, the rest of the deck loses authority before the second slide.
Gravity Global's executive reporting research identifies five metrics CEOs and boards consistently want to see: marketing-sourced revenue, customer lifetime value, qualified lead volume, CAC by channel, and overall marketing ROI calculated as marketing-sourced revenue divided by total marketing spend 2. Lead with the dollar number. Trail it with the qualified-pipeline figure that supports next quarter's revenue, because executives read forward, not backward.
CAC by Channel and the LTV/CAC Ratio
Customer acquisition cost broken out by channel is where most executive conversations actually get decided. A blended CAC hides the channels subsidizing the losers. Splitting CAC across paid search, paid social, organic search, and referral programs forces the conversation onto where the next marginal dollar should go — which is the conversation a CFO wants.
Pair channel-level CAC with the LTV/CAC ratio. Harvard Business School Online identifies 3:1 as the general industry benchmark for a sustainable acquisition model — the value generated by a customer should equal roughly three times the cost of acquiring them 3. A ratio under 1.5:1 signals that growth is being bought rather than earned. A ratio above 5:1 usually means the company is under-investing and leaving share on the table.
Calculate LTV using gross margin, not revenue. A SaaS team running 75% gross margins on $1,200 ARPU with 18-month median retention has an LTV of roughly $1,620, not $2,160. Executives spot the difference, and using the wrong figure once gets the entire deck flagged.
Report LTV/CAC by channel and by segment — enterprise, mid-market, self-serve — because the blended figure obscures which acquisition motion is actually working.
Pipeline Velocity and Payback Period
Pipeline velocity tracks how quickly marketing-sourced opportunities convert into revenue, calculated as the number of qualified opportunities multiplied by average deal size and win rate, divided by sales cycle length. When velocity climbs, marketing is feeding sales better-fit opportunities. When it drops while volume holds, lead quality is degrading even if MQL counts look healthy.
CAC payback period closes the loop. A SaaS team acquiring a customer at $4,800 CAC against $400 monthly gross profit has a 12-month payback. Boards expect SaaS payback under 18 months for self-serve and under 24 for enterprise motions. Reporting payback alongside LTV/CAC tells the CFO when the cash returns, not just whether the unit economics work eventually. Both numbers belong on the same slide as channel CAC — that single page is what gets debated.
The Four-Method Triangulation System
Marketing-Mix Modeling for Long-Range Channel Contribution
Marketing-mix modeling answers the question executives keep asking and rarely get a clean answer to: if paid search were cut in half next quarter, what happens to revenue? MMM uses regression against historical spend, sales, and external variables — seasonality, pricing changes, competitive launches — to estimate the contribution of each channel to top-line revenue over time. It does not need cookies. It does not care about ATT opt-in rates. That is why BCG places it as one of the four legs of a defensible measurement stool 1.
The objection from finance teams used to be cost. A traditional MMM engagement ran six figures and twelve weeks. That is no longer the floor. A SaaS team running $5M annually across three or four major channels can build a quarterly MMM using two years of weekly spend and revenue data, an open-source library like Meta's Robyn, and a half-time analyst. The output is a set of channel response curves showing diminishing returns at specific spend thresholds — the exact input a CFO needs to approve a budget reallocation. Refresh the model every quarter so the response curves stay current as the mix shifts.
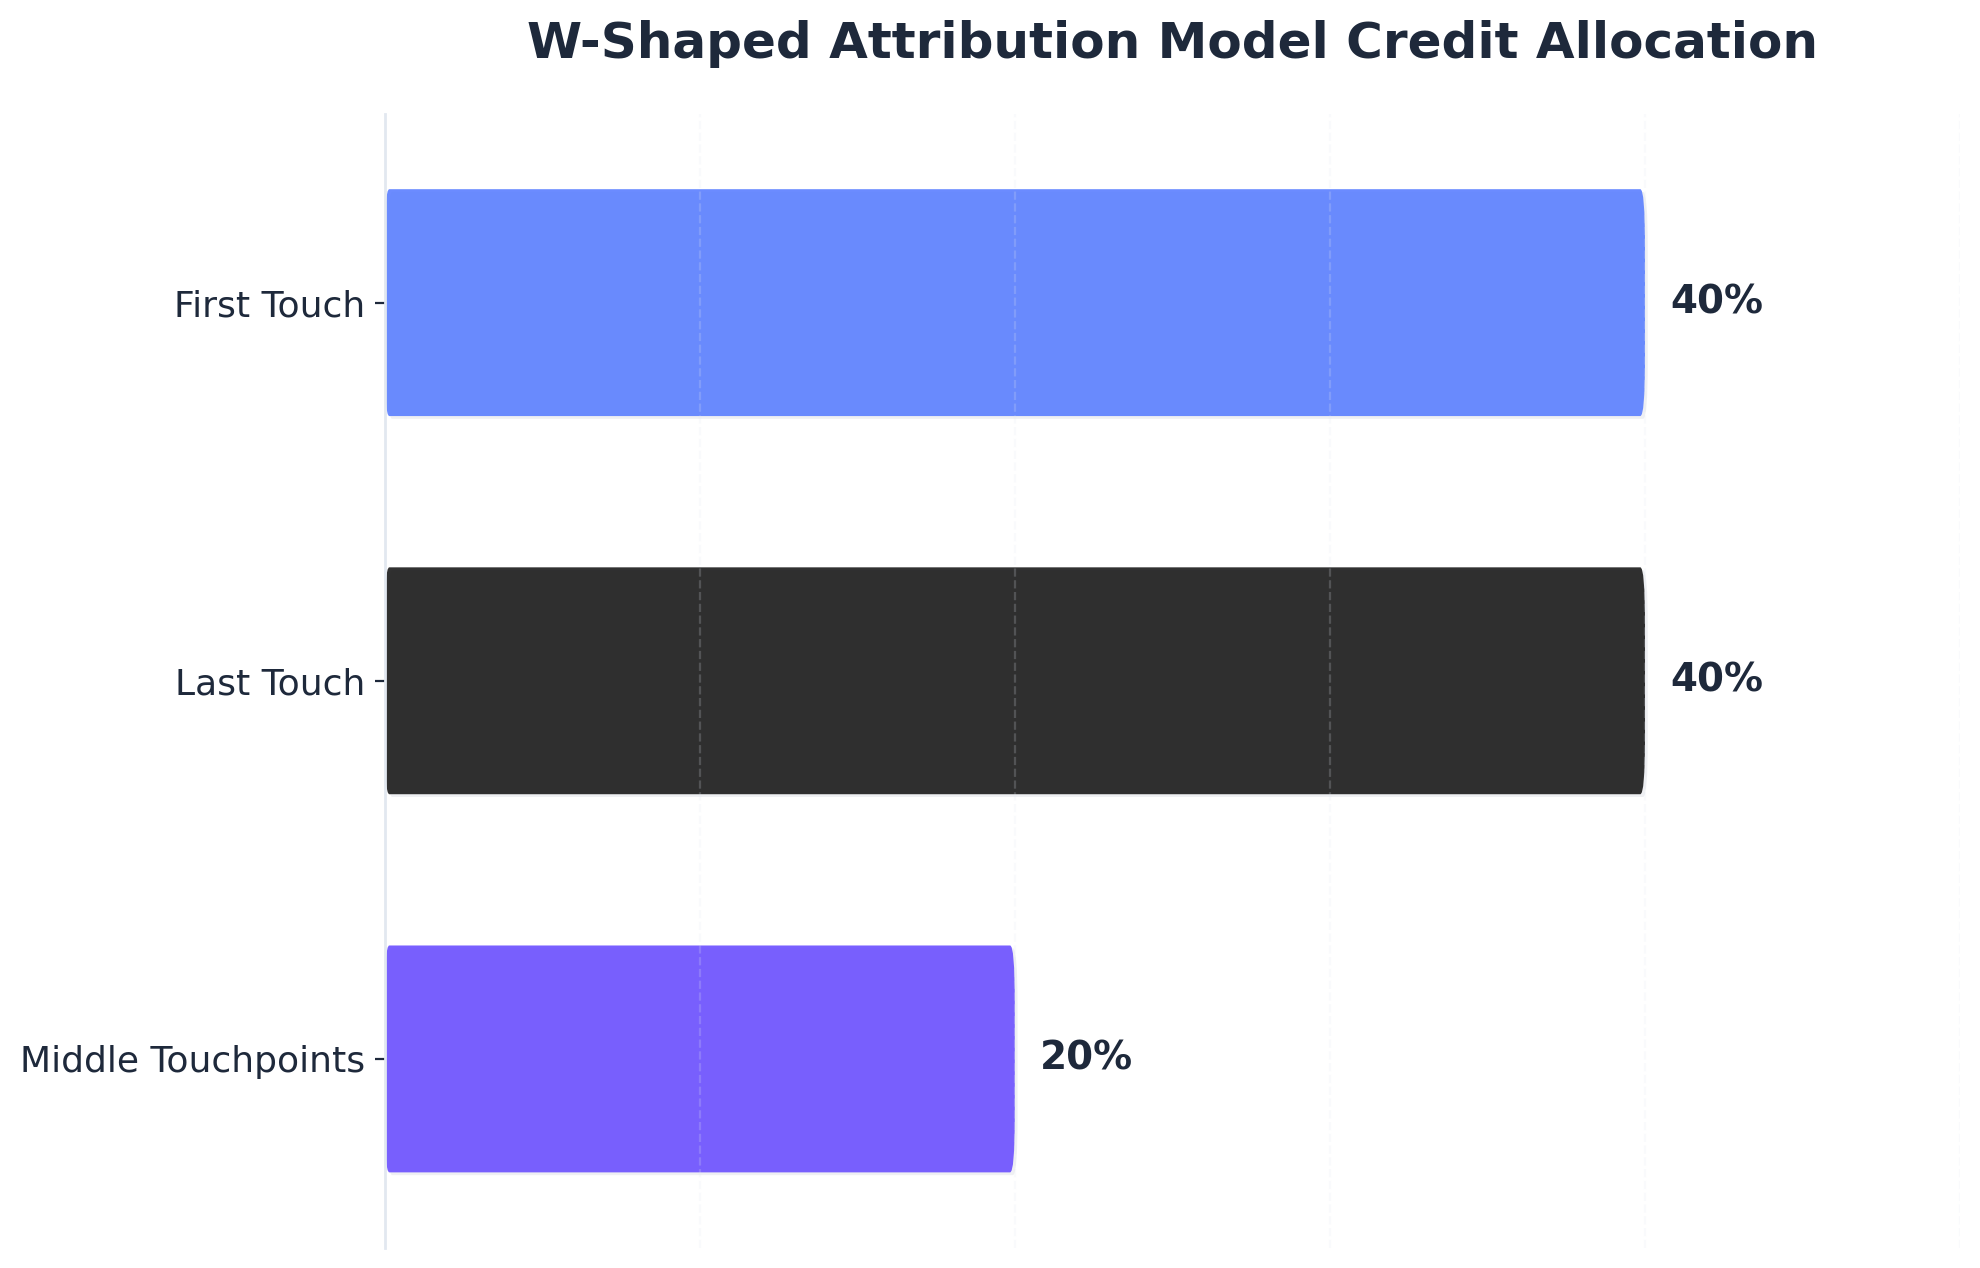 W-Shaped Attribution Model Credit Allocation
W-Shaped Attribution Model Credit Allocation: First Touch: 40%, Middle Touchpoints: 20%, Last Touch: 40%. The W-shaped attribution model allocates 40% of conversion credit to the first touch, 40% to the last touch, and distributes the remaining 20% across middle touchpoints,.
Incrementality Testing for Causal Proof
MMM estimates contribution. Incrementality testing proves it. The distinction matters because attribution and modeling both correlate marketing activity with outcomes, while a properly designed holdout test isolates causation. Pick a channel, suppress it in a matched market or audience for two to four weeks, and compare conversion rates against a control. The lift between groups is the incremental contribution — not what the platform claimed, not what last-click assigned, but what actually would not have happened without the spend.
Run incrementality tests on the channels with the largest budgets and the loudest internal debates. Brand search is the canonical example. Most teams find that 30% to 60% of branded paid clicks would have converted organically, which means platform-reported brand ROAS is roughly half of what gets credited. Geographic holdouts work for paid social and display. Audience holdouts inside the ad platform — Meta's conversion lift studies, Google's geo experiments — work for prospecting campaigns.
Schedule four incrementality tests per year, one per major channel. Document the methodology, sample size, and confidence interval before running each test. Bring the results to the QBR. Convergence between MMM contribution and incrementality lift is what BCG describes as the validation point that builds executive confidence 1.
Cohort and Customer Insight Analysis
The third leg looks at customers, not campaigns. Group new customers by acquisition month and channel, then track retention, expansion, and gross margin contribution over the following twelve to twenty-four months. The pattern that emerges almost always reverses surface-level CAC rankings. A channel with $800 CAC and 14-month median retention often outperforms a $400 CAC channel where customers churn at month six.
Cohort analysis is also where LTV/CAC stops being a single number and becomes a diagnostic. Segment cohorts by acquisition source, plan tier, and company size. The 3:1 benchmark from Harvard Business School Online holds at the blended level 3, but the channels and segments that drag the average down are where the next budget conversation should focus. A team that finds its content-driven enterprise cohort runs at 6:1 LTV/CAC while paid social self-serve runs at 1.4:1 has the answer to where the next dollar goes — and the data to defend the shift.
Real-Time Execution Metrics for Daily Operations
The fourth leg is the dashboard the team actually opens every morning. Cost per qualified opportunity, click-through rate, conversion rate by landing page, pipeline created in the last seven days. These metrics do not belong in the board deck. They belong in the daily standup, where they drive bid adjustments, creative rotations, and content production priorities.
The discipline is keeping these execution metrics out of the executive narrative. A CFO does not need to see CTR. A CFO needs to see that pipeline velocity climbed 18% this quarter and CAC dropped $340 against plan. The four legs serve different audiences — MMM and incrementality for the board, cohorts for strategic planning, real-time metrics for the team running the channels 1.
Prove Marketing ROI With Full Platform Access
Test real-time marketing impact with end-to-end analytics and publishing for seven days, risk-free.
Reconciling Platform-Reported Numbers Against CRM Truth
Where the 40% Inflation Comes From
Every ad platform optimizes against its own conversion pixel, and every pixel claims credit whenever a click or impression touches a buyer who eventually converts. Google Ads counts a view-through within 24 hours. Meta counts a 7-day click and a 1-day view by default. LinkedIn counts a 30-day post-click. A single buyer who sees a Meta ad on Tuesday, clicks a Google brand search on Wednesday, and converts Friday gets credited as a full conversion in two separate platforms. Stack three or four channels and the over-credit compounds — platform-claimed conversions routinely exceed booked revenue by 40% or more once reconciled against the CRM 1.
The fix starts with a single source of truth. CRM closed-won is the denominator. Every platform-reported conversion gets deduplicated against that record using email, lead ID, or account ID before any ROI math runs. Anything that cannot be matched to a CRM record does not count.
A Channel-Level CAC Reconciliation Table
The reconciliation move that builds executive trust is showing the gap between platform-reported and CRM-verified numbers in the same table. The example below uses illustrative figures for a Series C SaaS team running roughly $5M in annual paid spend. Drop in actual numbers from the last completed quarter to produce the version that goes to the CFO.
| Channel | Spend (Q) | Platform-Reported Conversions | Platform CAC | CRM-Verified Customers | CRM CAC | Inflation |
|---|---|---|---|---|---|---|
| Paid Search (non-brand) | $420,000 | 180 | $2,333 | 132 | $3,182 | +36% |
| Paid Search (brand) | $95,000 | 140 | $679 | 62 | $1,532 | +126% |
| Paid Social (Meta + LinkedIn) | $310,000 | 96 | $3,229 | 58 | $5,345 | +66% |
| Organic Search (content) | $180,000 | n/a | n/a | 74 | $2,432 | n/a |
Three patterns repeat across nearly every reconciliation of this kind. Brand paid search shows the largest gap because much of the credited conversion would have arrived through organic. Paid social inflates next because view-through windows catch buyers already in the funnel. Organic content typically lands as the lowest verified CAC once the cohort matures, but it does not show up at all in platform dashboards — which is why a CRM-anchored view shifts budget conversations toward channels the ad platforms cannot self-report on 2.
Why Data-Driven Attribution Beats Last-Click
Last-click attribution rewards whichever channel happened to close the browser tab. First-click rewards whichever ad ran when the buyer first heard of the company. Both ignore the seven other touches in between. Google's data-driven attribution model uses machine learning to compare conversion paths against non-conversion paths, assigning fractional credit based on which touchpoints carry the highest statistical probability of driving the outcome 5. The output is closer to causal than any rule-based model can produce on its own.
DDA is not the answer by itself — it still runs inside a single platform's view. Use it as the in-platform allocation method while incrementality testing and MMM provide the cross-channel reality check. Convergence across all three is what holds up in the boardroom 1.
The First-Party Data Layer Underneath Every Number
Unifying SEO, Paid, and Backlink Data into One Profile
Every method covered so far — MMM, incrementality, cohort analysis, channel-level CAC reconciliation — collapses without a single customer record underneath it. Three siloed reports do not triangulate. They argue.
A Customer Data Platform consolidates first-party data from every touchpoint into a unified profile that downstream systems can query, which is what makes accurate multi-touch attribution possible in the first place 6. The plumbing is specific: organic search sessions tagged with Search Console query data flow into the profile alongside paid clicks captured server-side through Conversions API, while referral traffic from earned backlinks gets stamped with the originating domain before the visitor ever fills out a form. When that visitor becomes a lead, then an opportunity, then closed-won revenue, every prior touch lives on the same record.
The strategic point eMarketer makes is sharper than the technical one: data infrastructure outperforms AI tooling as a competitive advantage because AI cannot fix fragmented, unreliable inputs 11. A SaaS team running SEO, paid, and backlink programs as one coordinated growth motion needs the data to behave that way too — collected directly from customers through transparent forms, preference centers, and gated content rather than reassembled from third-party pixels 79.
Continuous Data Quality Governance
A unified profile decays the moment it stops being maintained. Validity's research on CRM hygiene argues against treating data quality as a quarterly cleanup and pushes toward continuous monitoring — baseline standards, validation at every entry point, automated anomaly detection, and named ownership when something breaks 10. The benchmark most teams adopt is 95% valid email coverage across active records, paired with standardized UTM taxonomy and deduplicated account IDs.
Assign one person on the marketing operations team as the data steward. Their job is not analysis. It is enforcing the rules: rejecting form submissions with malformed emails, flagging UTM drift within 24 hours, and reconciling CRM accounts against the CDP weekly. Shared KPIs between marketing and sales — cost-per-qualified-opportunity, sales cycle length — only hold up when both teams agree the underlying records are clean 8. Without that discipline, the executive ROI report becomes a debate about the data instead of a decision about the budget.
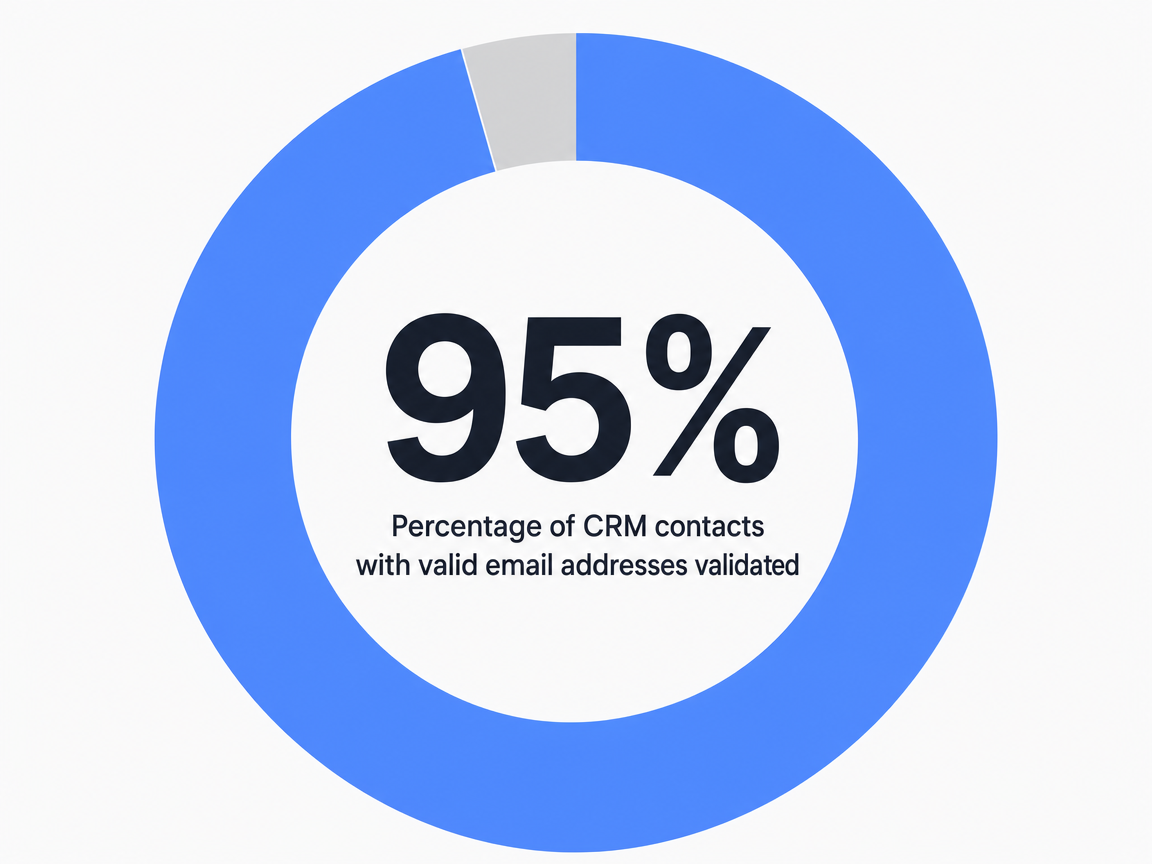 Percentage of CRM contacts with valid email addresses validated: 95%
Unlock Reliable ROI Measurement for Stakeholder Confidence
Connect with Vectoron to see how leading agencies and enterprise teams quantify marketing impact across SEO, PPC, and content—enabling executive-level reporting that drives strategic investment decisions.
The Measurement Maturity Self-Assessment
Most marketing teams operate one or two stages below where they think they do. The exercise that closes the gap is honest scoring against five maturity levels, then funding the next stage rather than the next platform.
Stage 1 — Platform-reported only. : ROI comes from stitching Google Ads, Meta, and LinkedIn dashboards together. CRM revenue is referenced occasionally but not reconciled. The board deck shows ROAS figures that, summed, exceed booked revenue. Diagnostic question: does the ROI on the last QBR slide match the revenue line on the finance deck within 10%?
Stage 2 — CRM-anchored attribution. : Closed-won revenue is the denominator. UTM taxonomy is enforced, and every platform conversion gets deduplicated against a CRM record. Last-click or position-based rule attribution still runs the allocation. Diagnostic: can the team produce CAC by channel from CRM data without exporting from ad platforms?
Stage 3 — Data-driven attribution plus cohort analysis. : DDA runs inside Google Ads 5, cohort retention curves segment LTV by acquisition source, and LTV/CAC gets reported by channel against the 3:1 benchmark 3. Diagnostic: does the team know which cohort, by source and quarter, has the highest 12-month gross margin contribution?
Stage 4 — Triangulated MMM and incrementality. : Quarterly marketing-mix modeling produces channel response curves. At least four incrementality tests run per year. Convergence across methods drives budget decisions 1. Diagnostic: did the last reallocation cite a specific MMM saturation point or holdout lift number?
Stage 5 — Coordinated measurement across SEO, paid, and backlinks. : A unified first-party data layer feeds all three programs, governed continuously 10. The next dollar conversation happens at the program level, not the channel level.
Score honestly. Fund the jump to the next stage before the next tool.
The Executive Reporting Cadence That Survives Scrutiny
Reporting cadence is where measurement systems either compound trust or quietly burn it. The teams that hold budget run three nested cycles, each with a different audience and a different set of numbers.
Weekly — operating review with marketing and sales. : Pipeline created in the last seven days, cost-per-qualified-opportunity by channel, and any UTM or data quality anomalies flagged by the steward. Sales joins to validate lead quality against the shared definition. Shared KPIs only function when both teams see the same numbers at the same time 8.
Monthly — finance reconciliation. : Marketing operations and finance close the books on marketing-sourced revenue against the CRM, deduplicate platform-claimed conversions, and lock the channel-level CAC table. Nothing moves to the executive deck until finance has signed the reconciliation.
Quarterly — board-level QBR. : One page, five metrics: marketing-sourced revenue, channel CAC, LTV/CAC by segment against the 3:1 benchmark 3, pipeline velocity, and payback period 2. MMM response curves and the latest incrementality test result appear as appendix evidence, not headline numbers. Convergence across methods is what gets cited when a reallocation is proposed 1.
The cadence itself becomes the credibility asset. A CFO who has seen six months of reconciled numbers stops auditing the math and starts debating the strategy — which is the conversation worth having.
Frequently Asked Questions
References
- 1.The Four-Legged Approach to Understanding Marketing ROI..
- 2.How to Make an Executive Marketing Report for Your CEO (Or Board)..
- 3.LTV/CAC Ratio: What It Is & How to Calculate It..
- 4.Marketing Orchestration vs Marketing Operations..
- 5.About data-driven attribution..
- 6.What Is a Customer Data Platform? CDP Guide [2026]..
- 7.What Is First-Party Data? Definition, Examples & Guide..
- 8.Cross-Functional Collaboration: How Marketing and Sales Work Together for Growth..
- 9.Privacy regulations: How to build a first-party data strategy..
- 10.What is Data Quality Monitoring? How to Keep Your CRM in Shape..
- 11.Data infrastructure, not AI, may be your competitive advantage going forward..