
Key Takeaways
- Portfolio-level marketing efficiency depends on five linked metrics: attribution coverage, service-line LTV:CAC, contribution margin per acquired patient, payback period by site cohort, and marginal CAC by location cohort.
- Attribution coverage is the foundational input that determines whether every other metric can be trusted, with Forrester setting a maturity bar near 90% of patient interactions 2.
- A blended 3:1 LTV:CAC benchmark misleads multi-specialty operators because high-margin orthopedic lines can mask primary care lines barely clearing the floor, hiding which units subsidize others 5.
- Operators should standardize metric definitions across sites, sequence reviews from coverage to cohort CAC, and frame budget approvals as cohort-level allocations rather than channel spend requests 6.
The CFO Problem No Single Metric Solves
A Chief Growth Officer faces a common challenge in multi-location healthcare: identifying which sites effectively utilize marketing spend. Traditional metrics like blended customer acquisition cost (CAC) or portfolio LTV:CAC often fail to provide the granular insights needed. For instance, a Harvard Business School benchmark suggests an LTV:CAC ratio of three or higher indicates a scalable business5. However, this benchmark loses relevance when applied across a diverse portfolio encompassing orthopedics, primary care, and behavioral health, where unit economics, payer mix, and patient consideration windows vary significantly.
McKinsey highlights that disparate metrics from various agencies, internal teams, and channels create confusion for C-suite executives6. This issue is amplified for healthcare operators with multiple sites. The crucial metrics are not merely those displayed on a dashboard, but rather those that can guide financial decisions on future growth capital allocation.
Why Marketing Efficiency Breaks at the Portfolio Level
Efficiency metrics designed for a single business unit become problematic when applied across a multi-location healthcare portfolio. While the mathematical calculations may be correct, the resulting insights are often misleading for decision-making. A blended CAC, for example, averages out high-performing sites with underperforming ones, making it impossible for a finance team to distinguish between them.
The root cause lies in inadequate measurement coverage. Forrester emphasizes that healthcare marketers should aim to measure approximately 90% of prospect and patient interactions throughout their journey, requiring comprehensive visibility into all encountered materials2. Many multi-location operators fall short of this standard. Each site often uses its own agency, call-tracking setup, and conversion definitions, leading to inconsistent inputs that are then aggregated into a portfolio-level number.
This dynamic is consistent with McKinsey's observations across various industries: when different groups and channels generate their own metrics, C-suite executives receive a fragmented view, lacking a unified definition of success6. In a multi-specialty healthcare portfolio, this confusion is compounded. Specialties like orthopedics and primary care have distinct consideration windows, payer mixes, and contribution margin profiles, yet they frequently share a single marketing dashboard and a generalized LTV:CAC figure. At the portfolio level, true efficiency is less about a single metric and more about the integrity of the underlying measurement system.
Test Real Marketing Efficiency Metrics in Action
Experience measurable improvements in marketing efficiency with publishable results during your 7-day full-access trial.
The Five Linked Metrics That Predict Scalable Growth
Attribution Coverage as the Foundation Metric
Before any efficiency metric can be trusted, an operator must understand the extent to which the patient journey is actually being measured. Attribution coverage quantifies the percentage of touchpoints, channels, and pre-conversion behaviors that a measurement system can observe and assign credit to. Forrester sets a maturity benchmark, suggesting that roughly 90% of patient interactions should be visible to the marketing team, starting with a thorough inventory of all assets, channels, and interactions2. Many multi-location operators measure significantly less, often around 40-50%, especially when accounting for paid search, organic, referral, and offline call traffic.
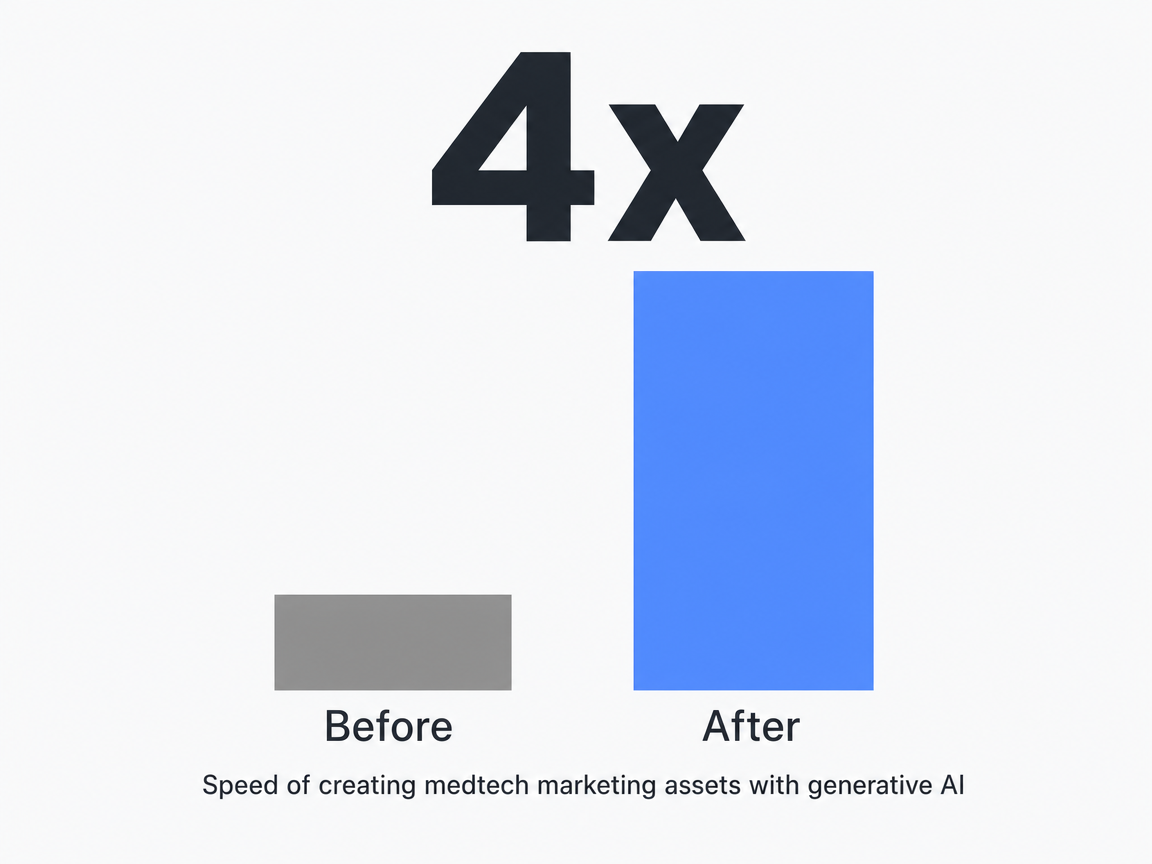 Speed of creating medtech marketing assets with generative AI: 4x
Coverage also involves quality, not just quantity. The NIH notes that current healthcare attribution models often give equal credit to every touchpoint, whereas weighted multi-touch attribution would distribute revenue based on actual contribution across the journey steps1. Equal-weight attribution can overstate the impact of channels late in the funnel while understating the channels that drive initial consideration. For a CFO allocating marketing budget, this distortion is a critical flaw.
To assess coverage, an operator should:
- List every significant patient touchpoint from initial awareness to a booked appointment
- Identify which ones the current system can observe, timestamp, and attribute
- Calculate the resulting ratio to represent the coverage number
If this figure is below the recommended range, all subsequent metrics, including CAC, LTV:CAC, and payback, are based on incomplete data. Attribution coverage is therefore the foundational metric that determines the reliability of all other metrics.
LTV:CAC Ratio, Read Through a Specialty Lens
The 3:1 LTV:CAC ratio is a widely cited marketing benchmark, indicating a scalable business that can cover marketing costs, overhead, and generate profit5. While effective for single-specialty operators with consistent payer mix and short consideration windows, for multi-specialty healthcare portfolios, it serves as a starting point rather than a conclusive analysis.
The issue is variance. A high-margin orthopedic surgical line might achieve LTV:CAC ratios between 13:1 and 53:1, especially with complex joint procedures and strong payer reimbursement. Conversely, a primary care panel operating on capitated contracts might be closer to the 3:1 floor, with longer payback periods and lower contribution per visit. A blended portfolio average, combining a 30:1 orthopedic line with a 4:1 primary care line, may appear healthy but conceals critical information for the CFO: which specialties are subsidizing others, and which would fail if their growth budget were reduced.
Analyzing LTV:CAC through a specialty lens means calculating it first at the service-line level, then aggregating. Each service line requires its own LTV definition, based on realistic episode revenue, retention behavior, and contribution margin, rather than top-line revenue. CAC should be calculated specifically for the channels and creative driving that particular service line, not as a blended figure across all marketing spend. The portfolio LTV:CAC then becomes a weighted aggregate of these credible service-line ratios, offering a more accurate picture than a single, potentially misleading number.
This granular approach is crucial for budget allocation. A board reviewing a single portfolio ratio cannot determine whether to invest more in high-return specialties, improve underperforming ones, or rebalance the mix. However, a board reviewing service-line ratios, along with their respective volumes and contribution margins, can make informed decisions. The 3:1 threshold remains the minimum for a healthy unit5, and this approach reveals which units comfortably exceed it, which barely meet it, and which are negatively impacting the overall average while consuming a disproportionate share of marketing resources.
Contribution Margin Per Acquired Patient
While LTV:CAC indicates if marketing is self-sustaining, contribution margin per acquired patient reveals the actual financial value each new patient adds to the profit and loss statement after accounting for variable costs. These metrics are related but answer different questions. A specialty might achieve a 3:1 LTV:CAC ratio but still yield low contribution if the variable costs of service delivery are high relative to revenue per episode.
The calculation is straightforward: revenue per acquired patient minus the variable costs associated with that patient (e.g., clinical labor, supplies, payer-specific reimbursement adjustments, billing costs), divided by the number of patients acquired in the period. The result is a dollar figure, which is particularly relevant for finance teams who plan operations in monetary terms. A contribution margin of $1,200 per acquired orthopedic consult, for instance, carries more weight in a budget discussion than a 30:1 ratio that obscures the actual cash generated.
This metric also highlights instances where a marketing channel attracts unprofitable patients. A campaign might meet its CAC target but bring in a payer or service mix that erodes contribution. In such cases, the CAC dashboard might show positive results, while the contribution-per-patient metric signals a problem. McKinsey advocates for standardized definitions across internal groups, agencies, and channels to ensure the C-suite receives a consistent picture rather than conflicting reports6. Contribution margin per acquired patient is the key metric that compels marketing, finance, and operations to agree on the characteristics of a profitable patient before funding future campaigns.
Payback Period and the Cash Cycle of New Sites
The payback period measures the time, in months, required for the contribution margin generated by an acquired patient to offset their acquisition cost. For multi-location operators, this metric is crucial for determining the timing of new site openings. A specialty with a 4:1 LTV:CAC and a 26-month payback period presents a different financial challenge than one with a 3.2:1 ratio and an 8-month payback, even if the former appears more favorable on a steady-state ratio dashboard.
New sites inherently skew this calculation. A clinic in its third month of operation will have an elevated CAC due to low brand awareness, minimal organic discovery, and a greater reliance on paid marketing. Consequently, its payback period will be longer than it would be at eighteen months. Operators who apply mature-site payback assumptions to ramping sites risk misforecasting cash needs and overpromising timelines to the board. Tracking payback by site cohort allows operators to observe the actual curve and plan working capital accordingly.
The decision driven by payback is clear: if the payback period for new sites exceeds the operator's tolerance for marketing cash drag, growth capital should be reallocated. This might involve shifting funds from acquisition spend towards conversion rate improvements, payer mix optimization, or referral generation to shorten the recovery window. McKinsey's research on healthcare consumer experience improvements indicates potential revenue gains of up to 20% over five years when these levers are strategically utilized4. Payback is the metric that guides operators on when to implement these strategies.
Marginal CAC by Location Cohort
Marginal CAC by location cohort is a critical metric for portfolio-level capital allocation, yet it is often absent from multi-location healthcare marketing reports. This metric should dictate where the next dollar of growth budget is invested.
A blended CAC across multiple sites averages a new clinic in its second month with a mature clinic in its fifth year, rendering the average arithmetically correct but operationally unhelpful. Marginal CAC by cohort categorizes locations by tenure (e.g., 0-6 months, 7-18 months, 19-36 months, 37+ months), specialty mix, and market density. It then calculates the cost of acquiring the next patient within each specific cohort, rather than relying on a historical average across all patients. This approach acknowledges that a mature site in a saturated market faces a different acquisition curve than a new site in an underserved area.
This metric directly informs allocation decisions. A mature cohort exhibiting rising marginal CAC signals channel saturation; further investment will yield diminishing returns and reduce overall portfolio efficiency. Conversely, a new-site cohort with high but rapidly declining marginal CAC indicates a healthy ramp-up; prematurely reducing spend could unnecessarily extend the payback window. Without a cohort-based view, operators risk over-investing in saturated markets due to their high absolute volume, or under-investing in ramping markets because their absolute CAC appears unfavorable compared to the portfolio average.
Tracking marginal CAC by cohort requires the foundation established by the preceding four metrics. Attribution coverage must be robust enough to accurately link new patients to their originating channels. CAC must be calculated at the individual location level, not blended. LTV and contribution margin need to be cohort-specific to allow for an honest comparison of the marginal return on investment across cohorts. These five metrics are not isolated tools but an integrated system, with marginal CAC by cohort being the ultimate output designed to guide strategic decisions.
If You Manage Multiple Locations: The Hidden Tax of Per-Site Measurement
For operators managing ten or more sites, the economics of marketing measurement shift significantly. What works for a three-site operation becomes a substantial hidden cost on the marketing P&L as the portfolio grows to thirty or more locations.
This "tax" manifests in three key areas:
- Degraded attribution coverage as site count increases
- Inconsistent metric definitions across various agency contacts
- Excessive analyst hours spent reconciling reports instead of acting on insights
Forrester's 90% measurement benchmark becomes increasingly difficult to achieve with each new location added under a fragmented reporting model, as every site introduces new conversion definitions and call-tracking configurations that require alignment2. McKinsey's research identifies a similar pattern: when internal groups, agencies, and channels each produce their own metrics, C-suite executives are forced into reconciliation rather than decisive action6.
| Operator profile | Per-location reporting model | Account-level measurement model |
|---|---|---|
| Single site | Attribution coverage achievable; one definition set | Marginal benefit limited at this scale |
| 10 sites | Coverage drift begins; reconciliation hours rise | Shared definitions hold; coverage near Forrester benchmark2 |
| 50 sites | Coverage gap widens; metric inconsistency compounds6 | Flat measurement overhead; portfolio-level cohort analysis viable |
The benefits of consolidating measurement are well-documented. McKinsey's work in healthcare found that providers who improved consumer experience and the supporting marketing measurement saw revenue increases of up to 20% over five years, while cost-to-serve decreased by up to 30%4. These results were achieved by operators who viewed measurement as a portfolio-wide capability, not a per-site expense.
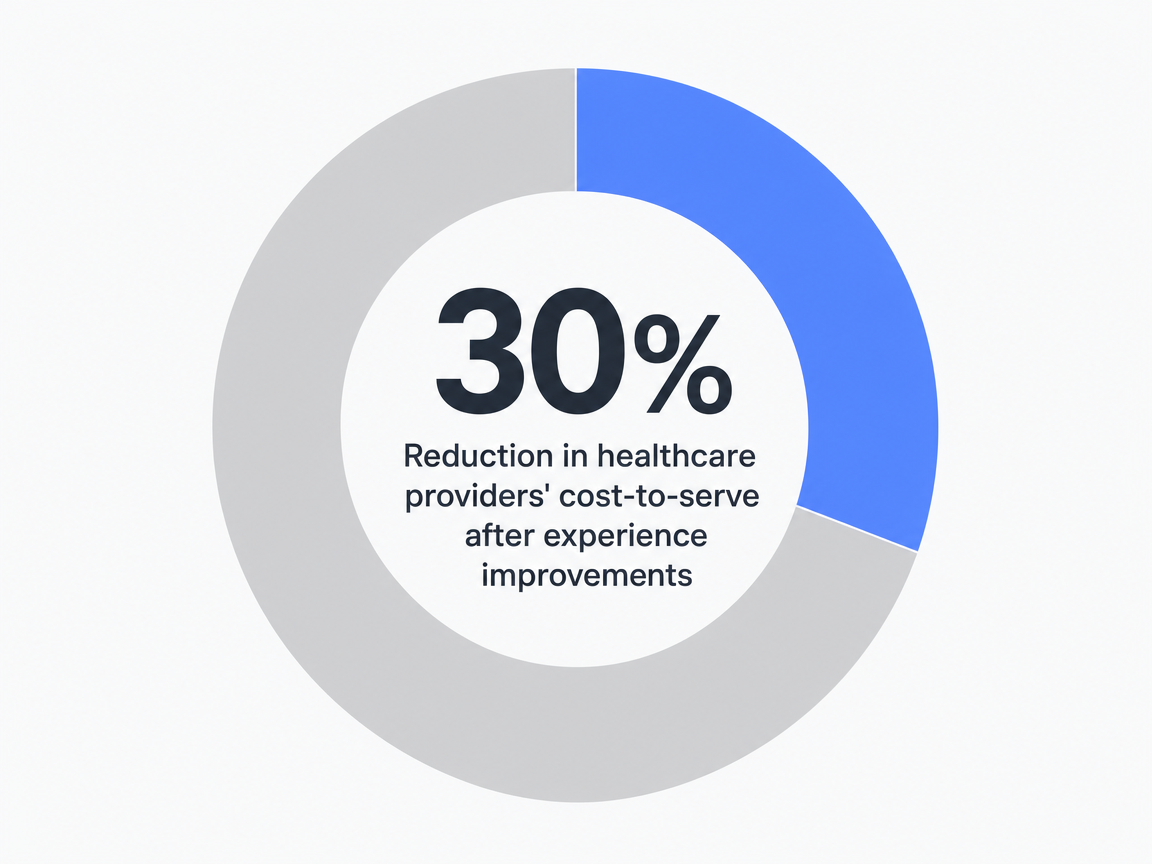 Reduction in healthcare providers' cost-to-serve after experience improvements: 30%
The operational imperative is to eliminate the reconciliation tax. Standardize metric definitions, attribution logic, and reporting cadence at an account-wide level before expanding to new sites, rather than attempting to align them retroactively.
See How Top Operators Benchmark Marketing Efficiency at Scale
Request a data-backed walkthrough of marketing efficiency metrics and workflows used by multi-location healthcare and agency leaders to coordinate scalable growth—without increasing overhead or complexity.
Operationalizing the System: From Dashboard to Decision
A measurement framework confined to a slide deck will not influence capital allocation. The five key metrics become impactful only when integrated into the operational cadence: monthly budget reviews, quarterly board reporting, and the decision-making logic that determines which sites receive growth funding and which require optimization.
The initial step involves consolidating metric definitions before the next reporting cycle. This means establishing a single definition for a conversion, a consistent LTV calculation per service line, and a uniform CAC formula applied across all locations. McKinsey emphasizes that varying definitions across internal groups, agencies, and channels lead to C-suite confusion, and standardizing nomenclature around the patient journey is the solution6. This is a one-time effort that yields continuous returns in every subsequent reporting period.
The second step is to sequence the metrics appropriately:
- Review attribution coverage first, as the reliability of all downstream metrics depends on achieving Forrester's maturity bar for coverage2
- Examine service-line LTV:CAC and contribution margin per acquired patient at the unit level, with the portfolio number presented as a weighted aggregate rather than a standalone headline
- Review payback period and marginal CAC by cohort, as these metrics directly inform capital allocation decisions
The third step involves transforming the budget approval process. Instead of channel-specific spend requests, proposals should be framed as cohort-level allocations: how much capital will be directed to mature sites with rising marginal CAC, how much to ramping cohorts within their payback window, and how much to service lines whose contribution margins justify additional acquisition pressure. The dashboard then evolves from a mere reporting artifact into a critical document that guides the CFO's financial commitments.
Where AI Measurement Helps and Where It Quietly Fails
AI has secured a legitimate role in the measurement stack, though not always in the way vendor presentations suggest. Forrester's 2026 healthcare tech forecast stresses that every AI use case must demonstrate measurable ROI, with efficiency gains reflected in metrics already tracked by leaders7. For the five-metric system, this translates into specific areas where AI excels and others where it produces seemingly confident outputs from flawed inputs.
AI offers concrete advantages:
- Weighted multi-touch attribution at a portfolio scale becomes feasible when models can process channel, location, and service-line data to assign credit based on contribution, addressing the equal-split default identified by the NIH attribution review1
- Cohort segmentation for marginal CAC
- Anomaly detection for payback drift
- Reconciliation of metric definitions across locations
However, operators must be wary of "quiet failures." An AI model trained on incomplete attribution coverage will generate a CAC number with high precision but still be incorrect about which channel warrants further investment. Forrester's 2026 B2C work highlights a related risk: approximately one-third of brands are expected to erode customer trust through self-service AI deployments that remove human judgment where patients still desire it10. The lesson for measurement is clear: AI enhances a robust system but merely propagates errors within a broken one.
Frequently Asked Questions
References
- 1.Modernizing Medical Attribution - PMC - NIH.
- 2.Healthcare Marketing: What Would You Need to Do to Measure 90 Percent?.
- 3.Healthcare 2025: A Year Of Progress, A Future Of Possibilities.
- 4.Marketing in healthcare: Improving the consumer experience.
- 5.LTV/CAC Ratio: What It Is & How to Calculate It.
- 6.The future of marketing measurement.
- 7.US Tech Forecast For Healthcare: Demand For Personalized ....
- 8.Measuring the ROI of Digital Transformation in Health Care - Deloitte.
- 9.What to expect in US healthcare in 2026 and beyond - McKinsey.
- 10.Forrester's 2026 B2C Marketing, CX, And Digital Predictions.