
Key Takeaways
- Deduplicate exposure across channels before trusting any blended metric, because attribution built on un-reconciled platform totals inflates reach and misallocates credit across the media plan 4.
- Require attribution models beyond last-click and the ability to toggle between them, so credit distribution reflects the full journey rather than whichever channel sits closest to conversion 2.
- Treat tagging enforcement as a hard prerequisite with schema validation and coverage governance, because attribution against inconsistent UTMs produces charts that are confidently wrong 7.
- Demand funnel-stage contribution reporting so upper-, mid-, and lower-funnel activity remain separable, preventing internal arguments that defund demand-generation channels based on closer-only views 2.
- Score vendors against Forrester's four-metric floor: hybrid customer count, distribution and spend, cross-channel conversion, and competitor spend by channel 8.
- Insist on approval workflow and execution routing inside the platform, since findings that exit to Slack and tickets leave analyst hours flat and the labor case unmet 10.
- Require live-data review and anomaly detection so attribution operates as a weekly and monthly cadence rather than a quarterly snapshot that pushes work back into spreadsheets 1.
Why the Dashboard Layer Is the Wrong Place to Start
Most agency principals start a reporting-tool search by comparing dashboard screenshots. That is a mistake. Dashboards are the cheapest and least differentiating layer of any modern reporting stack. Every serious contender can render a bar chart of Meta spend next to Google conversions. The question that decides margin and retention is what sits underneath.
A reporting platform earns its keep by resolving three problems dashboards alone cannot touch:
- Deduplicating exposure across channels so a single user seen on CTV, paid social, and search is counted once rather than three times 4.
- Distributing conversion credit across the full customer journey instead of the last click 2.
- Enforcing the data hygiene that makes either capability trustworthy 7.
Miss any of those and the visualization layer is just a prettier version of the platform exports already being stitched together in Looker Studio.
The evaluation frame that follows treats reporting as a decision system, not a visualization layer. Seven criteria form the rubric. Four disqualifiers end demos early. One section addresses the reporting-to-execution gap, where dashboards produce findings that never become approved actions and reporting labor stays flat. Principals running paid, SEO, and content programs across multi-location service verticals will recognize the P&L consequences of each gap: hours per client report, retainer defensibility, and the churn signals that arrive when clients stop believing the numbers.
Consolidation Dashboards vs. Cross-Media Measurement vs. Decision Systems
Three product categories get sold under the same "marketing reporting tool" label, and conflating them is how agencies end up paying for the wrong layer. The distinction matters because each category solves a different P&L problem, and a shortlist that mixes all three produces demos that are impossible to compare.
Consolidation dashboards : Pull reports from Google, Meta, TikTok, and call tracking into a single canvas. Looker Studio and the AgencyAnalytics-style tools sit here. They speed up report assembly, but they do not deduplicate impressions across channels, do not resolve identity across sessions, and do not enforce a shared attribution model. A user seen on YouTube, Meta, and branded search still counts three times 6. The output is a cleaner-looking version of the platform exports the agency already had.
Cross-media measurement platforms : Operate one layer deeper. They de-duplicate impressions, unify data from disparate media channels, and produce a single view of how channels work together to drive outcomes without double-counting or bias 6. This is where multi-touch attribution becomes trustworthy, because the underlying exposure data is reconciled before credit is distributed 4. Cross-media measurement is the floor for any agency claiming to report on blended performance rather than channel-level performance.
Decision systems : Add the orchestration layer that Forrester describes as a cross-channel marketing hub: customer data management, analytics, segmentation, and workflow tools for designing, executing, and measuring engagement across digital and offline channels 10. The reporting output is not the endpoint. Findings route into ranked recommendations, approvals, and executed work, then loop back as KPI impact. This category is what closes the reporting-to-execution gap that leaves reporting labor flat even after a dashboard upgrade.
The evaluation consequence is straightforward. Agencies buying a consolidation dashboard should expect faster report assembly and nothing else. Buying a cross-media measurement platform without the workflow layer means insight without operational follow-through. Buying a decision system without deduplicated measurement underneath produces confident recommendations built on double-counted data. The rubric in the next section assumes an agency is evaluating for at least category two, and ideally category three.
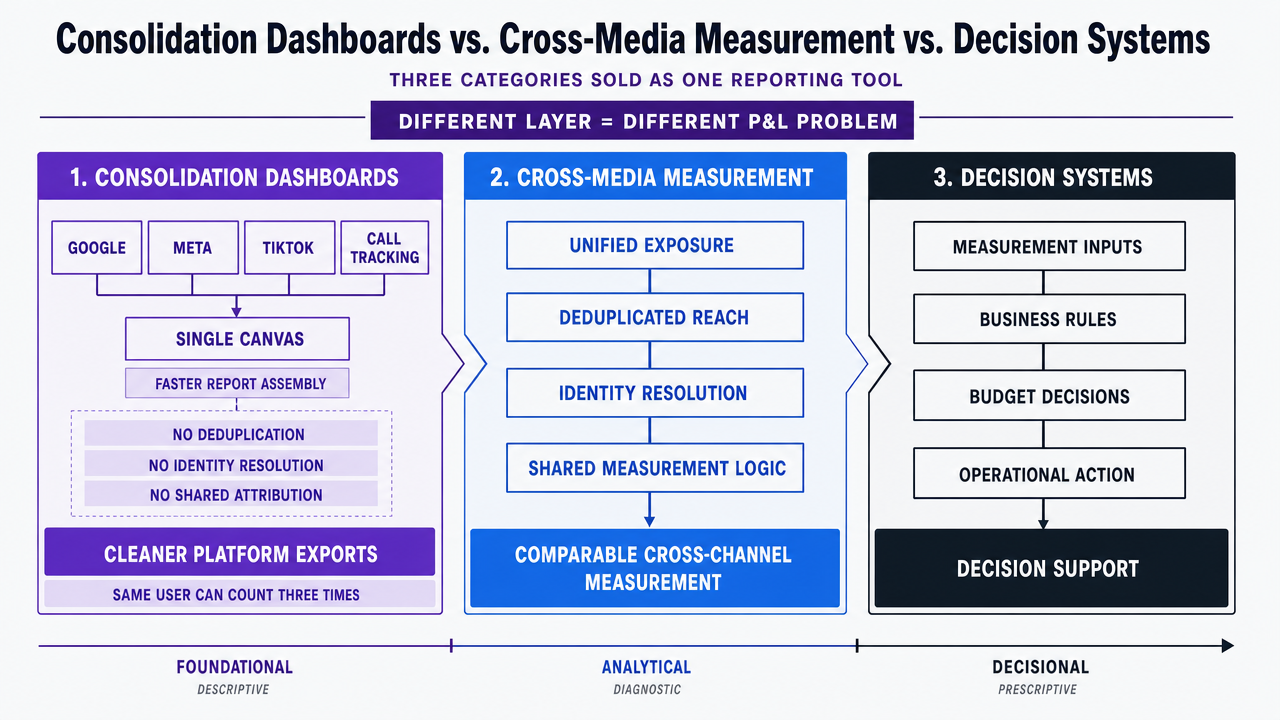 Visualize the three-tier category comparison that distinguishes consolidation dashboards, cross-media measurement platforms, and decision systems, directly supporting the section's core comparison framework
The Seven-Criterion Evaluation Rubric
Deduplicated Cross-Channel Exposure
Deduplication is the first criterion because everything downstream depends on it. If a platform cannot resolve the same user across YouTube, Meta, branded search, and a call tracking number into a single exposure record, every attribution model built on top of that data is inflating reach and misallocating credit.
The requirement is that the platform integrates data across distinct media channels to produce a unified view of who was reached, how often, and what outcomes were driven 4. That means identity resolution across sessions and devices, not a shared date range applied to separate platform exports. A tool that stacks Google, Meta, and TikTok reports into one canvas without reconciling the audience underneath is a consolidation dashboard, not a measurement platform 6.
The demo test is direct. Ask the vendor to show a single customer journey where the same identifier appears across three channels, and ask how impressions were deduplicated. If the answer references channel-level totals summed together, the tool fails this criterion. Agencies reporting blended CAC or MER on top of un-deduplicated exposure are quoting confidence intervals they cannot defend when a client asks how the number was built.
Attribution Model Support Beyond Last-Click
Last-click still ships as the default in most agency stacks, and it still misallocates budget in every account running more than two channels. The second criterion is whether the platform supports at least one non-last-click model, and ideally lets the operator switch models to see how credit distribution changes.
Multi-channel attribution distributes conversion credit across every touchpoint in the customer journey rather than assigning it all to the first or last interaction 2. Different models produce different pictures of which channels introduce demand, build intent, and close deals 3. A reporting tool that only shows one view of credit is not a reporting tool for agencies running integrated programs; it is a scorecard for whichever channel happens to sit closest to the conversion.
Forrester frames cross-channel attribution as what enables more precise management of marketing efforts compared with single-touch approaches 9. The evaluation implication is that the tool must expose the model as a variable, not hard-code it. During a demo, ask to see the same campaign report under two different attribution models. If the vendor cannot toggle the view, the platform is enforcing a methodology rather than supporting one.
Tagging Enforcement as a Hard Prerequisite
Before any attribution model runs, the campaigns feeding it have to be tagged. For multi-channel attribution modeling to work, all marketing campaigns across Search, Social, Email, Display, Affiliate, and other channels must be 100% tagged with campaign tracking parameters 7. The scope of that requirement is worth stating plainly: it is a methodological prerequisite that applies to every campaign in every channel the agency runs, not a benchmark a vendor can claim to meet on the agency's behalf.
Most agency stacks fail this test before tool selection is even relevant. A personal-injury firm running Google, Meta, and call tracking with inconsistent UTM conventions across three campaign managers cannot get a trustworthy attribution report from any platform. The tool will happily produce a chart; the chart will be wrong.
The third criterion is whether the platform enforces tagging discipline rather than assuming it. That means schema validation on ingest, automatic flagging of untagged or malformed campaigns, and a governance view that shows tagging coverage as a percentage across active spend. Agencies evaluating without this feature end up buying the reporting tool and then hiring the analyst hours to clean the data feeding it, which defeats the margin case for the purchase in the first place.
Funnel-Stage Contribution Reporting
Conversion counts alone do not tell a client why their pipeline is soft or which channel to defund. The fourth criterion is whether the platform reports contribution by funnel stage, showing upper-, mid-, and lower-funnel activity as separable views rather than collapsing everything into a single conversion column 2.
A DSO client with 42 locations running paid search, connected TV, and organic content needs to see that CTV is filling the top of the funnel with new-patient demand, branded search is closing it, and organic content is doing the mid-funnel comparison work. A reporting tool that only shows the closer wins the internal argument for defunding CTV every quarter, and the pipeline collapses two quarters later.
Funnel-aware KPIs also give the agency the upsell surface. When the platform reports which stage is under-invested, the recommendation to add budget to CTV or content is grounded in the client's own data rather than the agency's opinion. During a demo, ask the vendor to show the same campaign contributing to three different funnel stages, and how the tool decides which touchpoints belong at which stage.
The Forrester Four-Metric KPI Floor
Forrester's cross-channel measurement framework defines four essential metrics agencies should track:
- Hybrid customer count
- Distribution and spend of those hybrid customers
- Cross-channel conversion
- Customer spend with competitors by channel 8
These four are the KPI floor for a reporting tool shortlist. A platform that cannot produce all four should not advance past initial screening.
Hybrid customer count identifies the customers touched by more than one channel and quantifies the overlap the agency's media plan is producing. Distribution and spend shows where those hybrid customers are concentrated and how much budget is chasing them. Cross-channel conversion ties the multi-touch journey to outcomes. Competitor spend by channel puts the agency's performance in market context rather than in a vacuum.
The four are discrete enough to score cleanly. During a demo, request the definition and calculation method for each. Vendors that supply proxies, that redefine hybrid customer to mean multi-session user, or that cannot produce the competitor view are meeting the label but not the framework. Agencies presenting these four metrics to clients each quarter earn retainer defensibility that channel-level reporting cannot match, because the numbers describe the business rather than the media buy.
Approval Workflow and Execution Routing
The sixth criterion is where most reporting tools stop and where the labor problem starts. A finding on a dashboard is not an action. Until the recommendation moves through approval and lands in the hands of the team executing the change, reporting hours and execution hours remain separate line items on the agency's P&L.
Forrester describes cross-channel marketing hubs as enterprise platforms that support customer data management, analytics, segmentation, and workflow tools for designing, executing, and measuring engagement across digital and offline channels 10. The workflow layer is the part most reporting tools skip. It is also the part that determines whether a reporting purchase compresses labor or just relocates it.
The evaluation test is whether findings can be routed to a named owner, prioritized against other pending work, approved by the account lead, and tracked to executed outcome without leaving the platform. Handing a client a PDF that shows a paid search shift is worth $18K next quarter is not the same as routing that recommendation through approval into a campaign change with a start date. Agencies that treat approval workflow as optional keep the analyst hours they were trying to eliminate.
Iteration Cadence and Live-Data Review
Attribution is not a quarterly deliverable. It is an ongoing practice that has to iterate as spend shifts, channels launch, and creative changes rotate through 7. The seventh criterion is whether the platform supports live-data review rather than snapshot reporting.
Live data means the attribution view updates as new exposure and conversion data arrive, not when an analyst refreshes a scheduled export. It also means the tool exposes anomaly detection so a broken pixel or a mis-tagged campaign surfaces in hours, not at the end of the month when the client asks why the numbers moved 1.
The operational takeaway is a review cadence the agency can commit to in a retainer: weekly for active campaigns, monthly for portfolio-level shifts, quarterly for model recalibration. A platform that only supports the quarterly view forces the other two cadences back into spreadsheets, and the reporting labor the tool was purchased to compress reappears in a different column of the timesheet.
 Campaign tagging requirement for multi-channel attribution
Campaign tagging requirement for multi-channel attribution
Evaluate real agency reporting workflows risk-free
Test advanced reporting capabilities on your actual client data before making a platform commitment.
Disqualification Criteria: What Should End a Demo in Ten Minutes
Four questions ended most demos before the vendor gets to pricing. Any single "no" is grounds to move on, and running the list first protects the hours a shortlist would otherwise burn on tools that were never going to fit.
- One: does the platform deduplicate impressions across channels, or does it sum platform-level totals? If the answer is the latter, this is a consolidation dashboard and every blended metric on top of it is inflated 6. End the demo.
- Two: can the operator switch attribution models on the same report and see credit redistribute? If the tool hard-codes last-click, or hard-codes any single model, it is enforcing a methodology rather than supporting attribution work 9. End the demo.
- Three: does the platform surface tagging coverage as a governance view, with schema validation on ingest? If tagging is treated as the agency's problem to solve upstream, the reporting tool will produce charts against dirty data and the analyst hours the purchase was meant to compress will stay on the timesheet 7. End the demo.
- Four: can a finding be routed to a named owner, approved, and tracked to executed change without leaving the platform? If not, the tool stops at insight and the reporting-to-execution gap stays open 10. End the demo.
The Reporting-to-Execution Gap
A finding in a dashboard has no P&L consequence until someone acts on it. That gap between insight and executed change is where most reporting-tool purchases fail to deliver the margin case the agency built to justify them.
The pattern is familiar. An analyst pulls the weekly cross-channel view, spots that Meta prospecting is undercutting branded search at the mid-funnel, writes a Slack message, tags the paid media lead, waits for account-lead approval, updates a project management ticket, and hands the change to the campaign manager. Four handoffs, three tools, and roughly two days from finding to executed change. The reporting platform did its job. The reporting labor did not shrink because the work that surrounds the report never entered the platform.
Forrester's cross-channel marketing hub definition treats this as the same product surface: customer data management, analytics, segmentation, and workflow tools for designing, executing, and measuring engagement across channels 10. When reporting and workflow live in one governed loop, the ranked recommendation, the approval, and the executed change carry the same identifiers as the KPI impact tracked afterward. Attribution stops being a monthly retrospective and becomes an operating cadence 1.
The evaluation implication for a shortlist is direct. Ask each vendor to demonstrate a finding moving from surfaced signal to approved recommendation to executed change to measured outcome without leaving the platform. Tools that require an export at any step are selling the reporting layer only, and the labor problem stays intact.
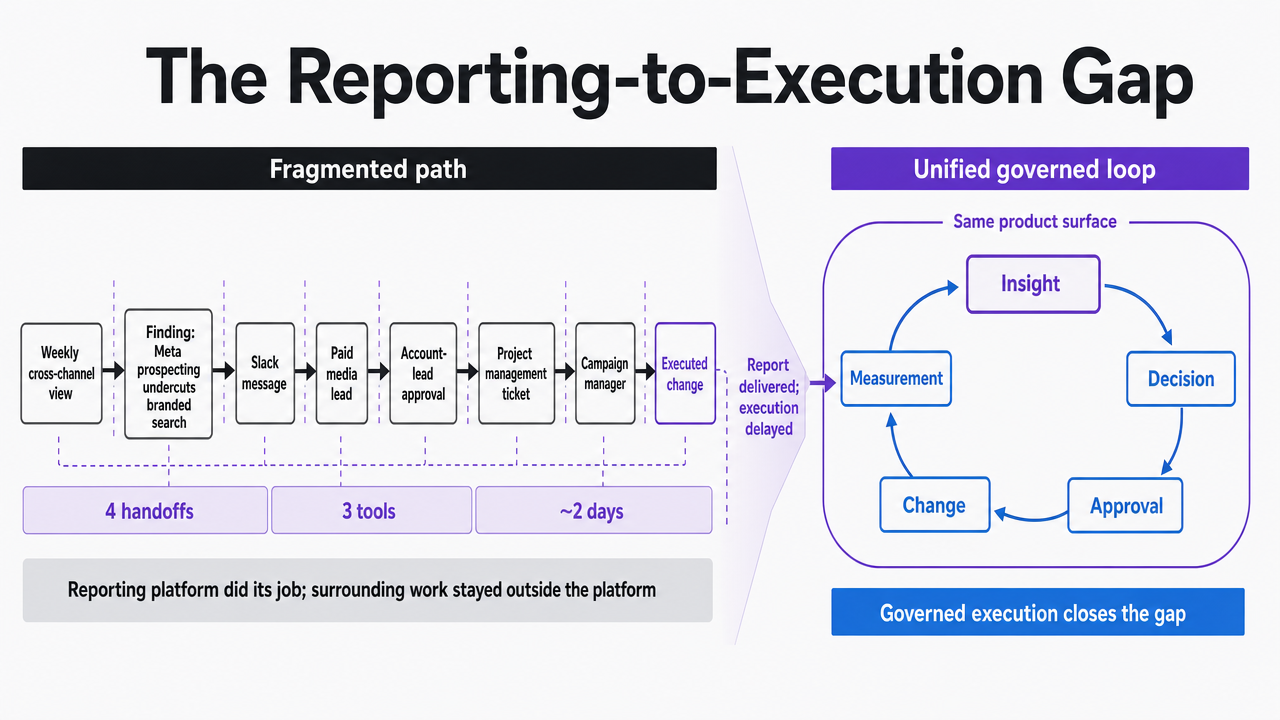 Visualize the workflow contrast between a fragmented reporting-to-execution path and a unified governed loop, supporting the section's operational argument
See How Leading Agencies Streamline Reporting With Centralized Approval Workflows
Request a live walkthrough of enterprise-grade reporting and approval dashboards designed to cut manual coordination, reduce review cycles, and deliver actionable insights across all marketing channels.
If You Operate Across Multiple Locations or a Portfolio of Accounts
This section is for principals running multi-location clients or a book of ten-plus accounts. The evaluation math changes at that scale, because reporting labor stops being a per-client expense and starts being a portfolio drag that compounds every time a new location or account is onboarded.
The status quo for most portfolio agencies is an analyst pulling GA4, Looker Studio, and platform exports into a client-specific report each month. Multiply the hours by the account count and the operator economics get uncomfortable fast. A consolidated reporting-plus-orchestration model changes the variable that scales: instead of hours per client per month, the constraint becomes recommendations reviewed per PM per week, which flexes with headcount rather than with account count.
The comparison worth running against a shortlist uses the agency's own numbers, not vendor-supplied ROI claims:
| Variable | Status-Quo Stack | Consolidated Reporting + Orchestration |
|---|---|---|
| Analyst hours per client report | H1 (agency-supplied) | H2 (target after consolidation) |
| Blended analyst rate | R (agency-supplied) | R |
| Clients per PM | C1 | C2 (target after workflow routing) |
| Monthly reporting cost per client | H1 × R | H2 × R |
| PM capacity ceiling | C1 accounts | C2 accounts |
Two numbers decide whether a platform pays for itself at portfolio scale: the delta between H1 and H2, and the delta between C1 and C2. The first is the reporting-labor compression. The second is the account-capacity gain that comes from routing findings into approved actions inside the platform rather than through Slack, tickets, and handoff meetings 10. A DSO client with 42 locations is one contract; the reporting labor to service it well is closer to five. Only the second column of the table makes that math work.
Running the Scoring Worksheet Against a Vendor Demo
The seven criteria only earn their keep when they are applied in real time, during the demo, with the vendor watching. Principals who send the rubric ahead as a questionnaire get marketing answers back. Principals who score live get operational ones.
The worksheet is a single page. Seven rows, one per criterion: deduplication, attribution model flexibility, tagging enforcement, funnel-stage contribution, the Forrester four-metric floor 8, approval workflow, and iteration cadence. Three columns: score from zero to two, evidence observed in the demo, and the disqualification flag if the answer is a no on any of the four hard gates.
- Score zero when the capability is absent or answered with a roadmap date.
- Score one when it exists but requires an export, a services engagement, or a workaround.
- Score two when the vendor demonstrates the capability inside the platform on the agency's own data or a representative sandbox.
A shortlist entry needs a two on all four disqualifiers and no zeros across the remaining three criteria to advance to pricing.
Bring one live account to every demo. A personal-injury firm running Google, Meta, and call tracking is enough surface to expose whether the platform deduplicates, whether attribution models toggle, and whether a finding routes into approved action without leaving the tool 10. Vendors that resist working with a real account are selling the screenshots, not the system.
Frequently Asked Questions
References
- 1.Cross Channel Attribution & Measurement for Success.
- 2.The Benefits of Multi-Channel Attribution in Modern Marketing..
- 3.Multi-Channel Attribution: What Is It & How Does It Work?.
- 4.What Is Cross-Channel Measurement? How It Works and Why It Matters.
- 5.Why Cross-Media Measurement Is a Must-Have for Marketers.
- 6.Best cross-media measurement tool: What to look for.
- 7.Multi-Channel Attribution Modeling: The Good, Bad and Ugly Models.
- 8.Four Essential Metrics For Cross-Channel Measurement.
- 9.Use Cross-Channel Attribution To Understand Marketing Effectiveness.
- 10.Choose A Cross-Channel Marketing Hub That Amplifies Your Customer Obsession Strategy.