
Key Takeaways
- Budget defenses collapse when marketers lean on internal dashboards; Forrester found 64% of B2B marketing leaders do not trust their own measurement, and CFOs read that hesitation 10.
- Anchor the conversation in Forrester's 8% of revenue B2B spend benchmark as a variance band tied to growth stage, not a ceiling or target 6.
- Replace channel-level ROI claims with pipeline contribution, payback period, and LTV:CAC, since those metrics speak the revenue-adjacent language finance already uses in the operating plan.
- Treat the measurement-confidence gap as the real budget risk and borrow credibility from external references like Forrester, McKinsey, and Deloitte rather than defending contested attribution models 3.
- Coordinated operating models capture up to 30% greater efficiency and up to 10% incremental top-line growth at the same spend, while fragmented stacks forfeit those deltas to coordination drag 7.
- Match each CFO objection to a specific benchmark — spend ratio, pipeline contribution, measurement-trust finding, and operating-model multiplier — so the meeting becomes four answers rather than one continuous argument.
- Multi-location healthcare operators need a different ROI frame, linking spend to clinical, operational, and financial outcomes together because single-dimension ROI under-represents utilization, payer mix, and provider productivity effects 1, 8.
Why Budget Defenses Collapse Under CFO Scrutiny
Marketing budgets rarely get cut because the work is bad. They get cut because the defense is built on the wrong evidence. A VP walks into the quarterly review with pipeline-sourced numbers, MQL volume, and a deck of campaign highlights, and the CFO asks a different question entirely: what would happen to revenue if this line item dropped 20%? The deck does not answer that question, and the budget loses ground.
The credibility problem is well-documented. Forrester's 2024 Marketing Survey found that 64% of B2B marketing leaders do not trust their own organization's marketing measurement 10. When the people closest to the data privately doubt it, finance reads the room within minutes. Vanity metrics, last-touch attribution stories, and channel-by-channel ROI claims that no one can reconcile across platforms all signal the same thing to a CFO: the math is soft.
Deloitte's 2026 CMO Survey reinforces the shift. Marketing leaders are now accountable for profitable growth, not activity, and are expected to draw a clean line between spend and financial outcomes 3. That accountability is colliding with tighter headcount: marketing organization growth dropped from 5.5% in Fall 2023 to 3.9%, even as martech investment continues 4. Defending a budget in that environment requires more than a results recap.
What works is a layered argument built on benchmarks the CFO already respects. Three of them matter most:
- Spend as a percentage of revenue
- Channel efficiency tied to pipeline contribution
- Measurement-confidence data that reframes the trust question
A fourth layer, the operating-model multiplier, explains why coordinated execution outperforms a fragmented stack at the same spend level. The sections that follow assemble those layers in the order a budget meeting actually unfolds.
The Spend-Ratio Anchor: What 8% of Revenue Actually Means
The first benchmark a CFO will accept is the one their finance peers already use. Forrester's 2024 B2B Marketing Budget Benchmarks places the average B2B firm's marketing investment at roughly 8% of annual revenue, a figure that carries weight precisely because it comes from an analyst the finance organization respects 6. That number does the heavy lifting at the start of a budget defense: it reframes the conversation from "is this spend too high?" to "is this spend in line with comparable firms?"
The trap is treating 8% as a ceiling or a target. Forrester's own analysis cautions that the figure is a midpoint, not a prescription, and that optimal spend shifts with go-to-market model, growth stage, and product category 6. A SaaS firm pursuing aggressive net-new logo acquisition routinely operates well above the average. A mature B2B company with strong account expansion economics may run below it without underperforming. The benchmark works as an anchor, not a verdict.
That distinction matters in a live budget meeting. When a CFO sees marketing at 11% of revenue, the instinct is to mark it as excess. The defensible counter is not to argue the number down but to place it inside the variance band: high-growth SaaS firms with longer sales cycles and competitive paid channels concentrate spend earlier in the customer lifecycle, and Forrester's commentary explicitly supports that variance 6. The argument shifts from defending a percentage to defending a growth thesis.
The Deloitte 2026 CMO Survey reinforces why this anchor has become non-negotiable. Marketing leaders are now expected to demonstrate clear links between spend and financial outcomes, with profitable growth replacing brand awareness as the primary accountability 3. The 8% reference point gives that conversation a starting coordinate. Without it, every budget line reads as discretionary. With it, the discussion moves to allocation, efficiency, and return — terrain where a prepared marketing leader has stronger ground than finance assumes.
The spend-ratio anchor alone does not win the meeting. It opens the door for the next layer of the defense: where that 8% is going, what it is buying in pipeline contribution, and whether the channels carrying the load are operating at expected efficiency.
Channel Efficiency Benchmarks That Survive Attribution Debates
Once the spend-ratio question is settled, the conversation moves to allocation. This is where most budget defenses lose altitude. Channel-by-channel ROI claims pulled from native platform dashboards tend to overcount conversions, double-attribute revenue, and inflate the contribution of whichever channel sits closest to the click. A CFO who has been through two or three of these reviews knows the pattern and discounts the numbers accordingly. The defensible move is to anchor channel efficiency in metrics that hold up under cross-examination: pipeline contribution, payback period, and unit economics tied to the same financial statements finance already trusts.
McKinsey's analysis of performance branding makes a useful structural point here. Firms that combine rigorous performance measurement with brand-level investment report marketing efficiency gains of up to 30% and incremental top-line growth of up to 10% without expanding the budget 7. The mechanism is not a better dashboard. It is a unified customer data foundation that lets channel investments be evaluated against the same revenue series, rather than against channel-specific proxies that no one outside marketing recognizes. That is the lens the next two subsections apply, first to pipeline contribution and then to SaaS-specific unit economics.
Pipeline Contribution vs. Activity Metrics
Activity metrics survive in marketing reviews because they are easy to produce. Impressions, sessions, MQLs, and cost-per-lead all roll up cleanly from native platforms. Forrester's 2024 analysis of B2B measurement practices points to the consequence: many of the metrics organizations track do not support strategic decisions, and overreliance on vanity and activity indicators is part of why measurement credibility has eroded inside marketing functions themselves 10.
Pipeline contribution is the metric that translates. Sourced pipeline, influenced pipeline, and pipeline velocity by channel give finance a number expressed in the same units as revenue forecasts. A paid search program that produces a 4:1 ratio of sourced pipeline to spend is a defensible line item even when last-touch attribution looks noisy. The discipline is reporting channel performance against revenue-adjacent denominators, not against engagement proxies that finance has no way to verify.
One operational note matters here. Pipeline contribution only holds up when the underlying customer data is unified across SEO, paid, and outbound — the same foundation McKinsey identifies as the precondition for the 30% efficiency gain 7. Fragmented reporting reintroduces the trust problem the metric was meant to solve.
SaaS Payback and LTV:CAC Framing Against the 8% Baseline
SaaS leaders face a specific problem with the 8% Forrester benchmark: it averages across B2B firms with very different growth profiles, and a high-growth SaaS company running at 15-20% of revenue on marketing will look like an outlier against it 6. The defense is to layer unit economics on top of the spend ratio, not to argue the ratio away.
CAC payback period and LTV:CAC are the two metrics that survive that layering. A payback under 12 months on new ARR, paired with an LTV:CAC ratio that clears the threshold the board has already approved in the operating plan, reframes elevated spend as concentrated investment in a working acquisition motion. The 8% figure becomes context rather than a constraint.
The Deloitte 2026 CMO Survey points in the same direction. Marketing leaders are now expected to demonstrate clean links between spend and financial outcomes, with profitable growth as the primary frame 3. Payback and LTV:CAC speak that language directly. They convert a percentage-of-revenue debate into a return-on-deployed-capital debate, which is the conversation a CFO came prepared to have.
Test real-world ROI benchmarks with live campaigns
Validate key marketing ROI metrics by running and measuring published campaigns during your trial.
The Measurement-Confidence Gap as the Real Budget Risk
The single most underestimated threat to a marketing budget is not poor performance. It is the moment a CFO realizes the marketing team itself does not fully believe its own numbers. Forrester's 2024 Marketing Survey put a figure on that moment: 64% of B2B marketing leaders said they do not trust their organization's marketing measurement, and the metrics they do track often fail to support strategic decisions 10. That data point is not a sidebar to the ROI conversation. It is the conversation.
The scope of the finding matters. Forrester surveyed B2B marketing leaders specifically, not finance executives evaluating marketing from the outside. The lack of confidence is internal. When a VP presents a 4.2x return on a paid program and the CFO probes the assumptions, the hesitation in the answer is usually not coyness. It reflects the same trust gap the survey captured. Finance leaders read that hesitation accurately, and budget conversations turn on what gets read between the lines.
This is where benchmarks shift from being supporting evidence to being protective infrastructure. A budget defense built on internal dashboards alone inherits the credibility of those dashboards, which the people running them already doubt. A defense built on external reference points — Forrester's spend ratio, McKinsey's efficiency ranges, Deloitte's outcome framework — borrows credibility from sources finance already accepts and gives the marketing leader room to discuss attribution honestly without conceding the budget. The argument becomes: the channel-level numbers carry the usual measurement caveats, and here is how the program performs against the external benchmarks that do not depend on our internal attribution model.
The defensive move is also a diagnostic one. Marketing organizations that close the measurement-confidence gap tend to share three traits visible in the research:
- A unified customer data foundation rather than channel-specific reporting 7
- Explicit linkage between marketing indicators and business outcomes rather than activity proxies 10
- Accountability structures that tie spend to profitable growth rather than awareness 3
None of these is a dashboard feature. Each is an operating-model choice.
The CFO objection waiting at the end of every budget meeting is some version of "how do we know any of this is real?" The honest answer is that internal measurement is contested, and the marketing leaders who admit that and then anchor the program in external benchmarks tend to keep more of their budget than those who insist the dashboards are airtight. The next layer of the defense addresses why a coordinated operating model produces measurably different results at the same spend level, and why that difference is the multiplier most budget defenses leave on the table.
The Operating-Model Multiplier: Coordinated vs. Fragmented Stacks
Two marketing programs running at the same percentage of revenue can produce materially different returns based on how the work is organized. That gap is the operating-model multiplier, and it is the layer of the defense most marketing leaders skip because it sits outside the channel-by-channel ROI conversation finance expects. McKinsey's performance-branding research quantifies the difference: organizations that unify customer data, run integrated measurement, and operate with shared planning cycles report marketing efficiency gains of up to 30% and incremental top-line growth of up to 10% without expanding the budget 7. Those deltas do not come from a new channel or a higher spend tier. They come from removing the friction between channels that already exist in the plan.
The fragmented stack is the default state for most growth programs. An SEO agency, a paid search agency, a backlink vendor, an in-house content team, and a separate analytics function each optimize against their own scorecard, and the seams between them absorb a meaningful share of the budget without producing pipeline. A coordinated operating model — whether built in-house, run through a single integrated partner, or executed on a unified platform — collapses those seams. The next two subsections quantify what the seams cost and translate the McKinsey deltas into a table a marketing leader can put in front of finance.
What Coordination Drag Costs a Growth Program
Coordination drag is the share of marketing spend consumed by handoffs, duplicated research, conflicting briefs, and reconciliation work between siloed channels and vendors. It rarely appears as a line item, which is part of why it survives budget reviews untouched. A keyword strategy built by an SEO agency without visibility into the paid search account produces overlap that inflates blended CPC. A backlink program targeting pages the content team is about to deprecate wastes acquisition spend. An analytics function reporting against three different attribution models gives finance three different answers to the same question.
Forrester's measurement analysis points to the downstream effect: when metrics across functions do not reconcile, the credibility of every channel claim erodes, and marketing leaders end up defending a stack they cannot fully verify 10. The drag shows up twice — once in efficiency loss and again in the trust gap that follows. McKinsey's framing locates the fix in a unified customer data foundation and shared operating cadence rather than additional tooling 7. The operational test is simple: if SEO, paid, and backlink decisions are reviewed in separate meetings against separate scorecards, the program is paying coordination drag whether or not the line item is visible.
Economics Table: What the Benchmarks Imply at Your Revenue Level
The McKinsey deltas become concrete when expressed against the Forrester spend baseline. A B2B firm running at the 8% average commits roughly $0.08 of every revenue dollar to marketing 6. The performance-branding research indicates that a coordinated operating model can deliver up to 30% greater efficiency on that same commitment, or up to 10% incremental top-line growth without raising it 7. The table below expresses both deltas as variables rather than fabricated dollar figures, so a marketing leader can drop in the firm's actual revenue line during the budget meeting.
R : Annual revenue
S : Baseline marketing spend at the Forrester 8% anchor (S = 0.08R) 6
| Scenario | Marketing Spend | Efficiency Outcome | Top-Line Outcome |
|---|---|---|---|
| Fragmented stack (baseline) | S = 0.08R | Baseline pipeline per dollar | Baseline revenue trajectory |
| Coordinated operating model — efficiency case | S = 0.08R (unchanged) | Up to 30% greater output per dollar 7 | Baseline revenue, lower CAC |
| Coordinated operating model — growth case | S = 0.08R (unchanged) | Reallocated to higher-yield channels | Up to 10% incremental top-line lift 7 |
The argument the table supports is narrower than the headline numbers suggest. McKinsey's ranges are upper bounds tied to firms that fully unified their data and operating cadence, not guaranteed outcomes 7. The defensible position in front of finance is that the coordinated model captures a measurable portion of those deltas at the same spend level, while the fragmented stack systematically forfeits them.
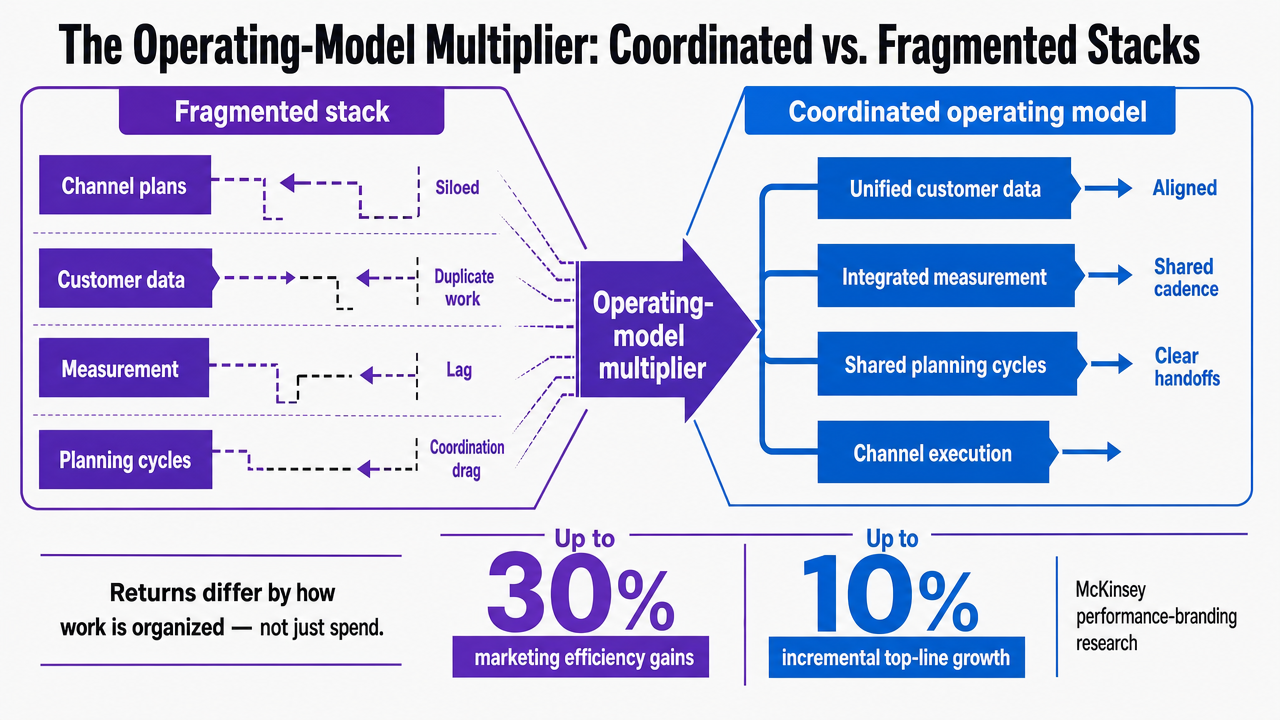 Visualize the structural comparison between a fragmented marketing stack and a coordinated operating model, supporting the section's argument about coordination drag and the McKinsey efficiency multiplier
The Budget Defense Script: Matching Benchmarks to CFO Objections
A budget meeting is a sequence of objections, not a single verdict. Marketing leaders who treat it as one continuous argument lose ground on whichever sentence the CFO chooses to interrupt. The defensible structure is shorter: anticipate the four objections finance reliably raises, and pair each with the external benchmark that answers it directly. The benchmarks already covered in the preceding sections do the work — the script is the order in which they appear.
- Objection one: "This spend looks high relative to revenue." The answer is the spend-ratio anchor. Forrester's 2024 B2B benchmark of roughly 8% of annual revenue, paired with the variance band tied to GTM model and growth stage, repositions the line item as comparable rather than excessive 6. The marketing leader does not defend the percentage; the marketing leader places it inside a respected range.
- Objection two: "How do we know the channels are actually working?" The answer is pipeline contribution expressed in revenue-adjacent units, not native dashboard ROI. Sourced and influenced pipeline by channel, payback period, and LTV:CAC translate the question into language the operating plan already uses. The Deloitte 2026 CMO Survey frames the same expectation from the finance side: marketing leaders are now accountable for clear links between spend and financial outcomes 3.
- Objection three: "Your own attribution numbers contradict each other." The honest answer reframes the question. Forrester's finding that 64% of B2B marketing leaders do not trust their organization's measurement indicates the credibility gap is structural across the function, not specific to this program 10. The defense concedes the internal limits and pivots to external benchmarks that do not depend on the contested attribution model.
- Objection four: "Why not cut the budget and accept slower growth?" The answer is the operating-model multiplier. McKinsey's performance-branding research shows that coordinated programs capture up to 30% greater efficiency at the same spend level 7, meaning the comparable cut from a fragmented stack would forfeit returns the current model is already producing. The argument moves from defending the dollar to defending the structure that makes the dollar work.
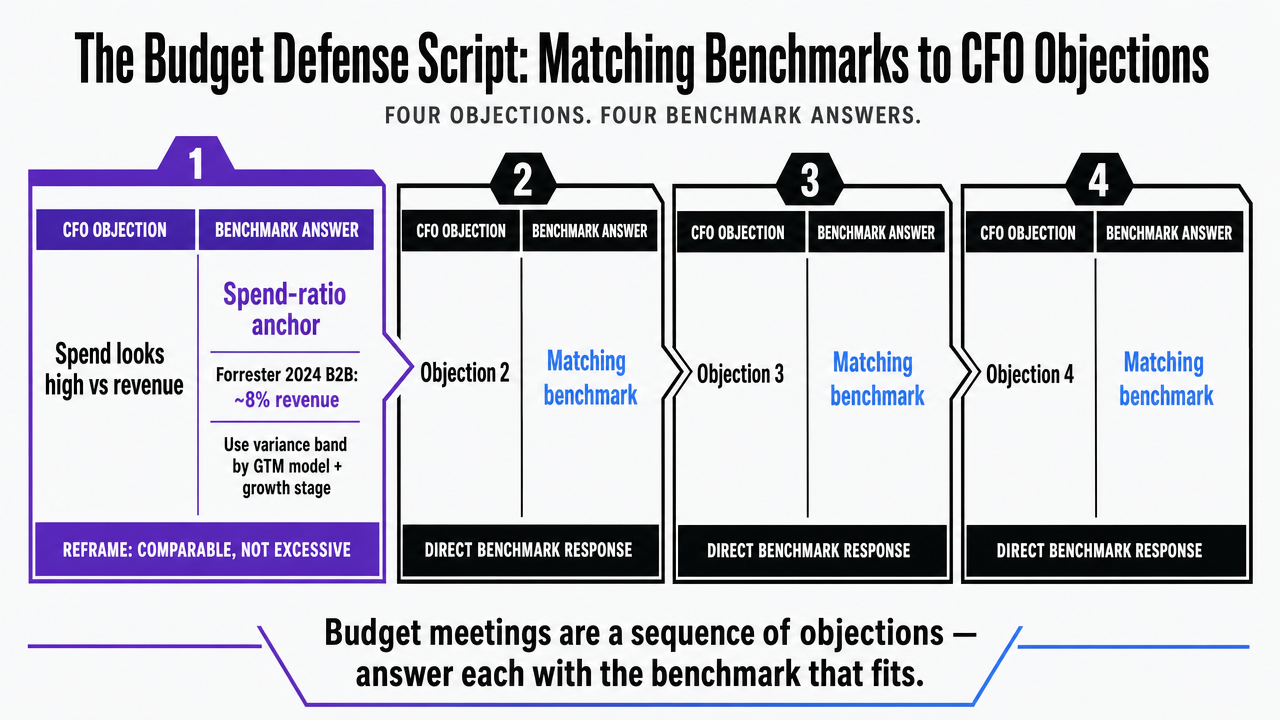 Process infographic mapping each of the four CFO objections to its corresponding external benchmark, directly mirroring the section's four-layer defense script
Access Industry-Specific ROI Benchmarks for Confident Budget Defense
Request a tailored report with current ROI data across SEO, PPC, and multi-channel campaigns—benchmarked against leading SaaS and enterprise marketing teams. Equip your next budget conversation with independent, data-driven evidence.
If You Operate Multiple Healthcare Locations: A Different ROI Frame
The benchmarks covered so far assume a SaaS or B2B revenue model where pipeline contribution, payback period, and LTV:CAC carry the argument. Multi-location healthcare operators face a different conversation. The reader for this section is the growth leader at a dental support organization, a multi-specialty group, a behavioral health network, or a regional surgical platform — someone defending a marketing budget to a CFO who is also tracking provider productivity, chair utilization, and payer mix. The same Forrester and McKinsey reference points still apply, but the metrics that close the meeting are not the same ones a SaaS VP would use.
The shift is not cosmetic. A systematic review of marketing metrics in healthcare organizations found that only a minority of studies incorporated clear return-on-investment or financial performance metrics, with most institutions defaulting to patient volume and satisfaction indicators instead 2. That gap is a budget vulnerability. When the marketing leader cannot speak the same financial language as finance and operations, the line item gets read as a cost center rather than a growth lever. The two subsections below address both halves of the fix: why narrow ROI definitions systematically understate the value of marketing in a multi-location system, and how to construct a defense that links spend to the clinical, operational, and financial outcomes the executive team already tracks.
Why Single-Dimension ROI Underrepresents Multi-Location Value
A single-dimension ROI calculation — marketing spend divided by attributable new patient revenue — captures a fraction of what a multi-location program actually produces. A peer-reviewed systematic review of ROI in large-scale healthcare quality improvement programs makes the structural critique directly: ROI is often narrowly defined and under-represents non-financial benefits, including quality, safety, and system-level effects that compound over time 1.
In a multi-location context, the under-representation is concrete:
- A campaign that fills appointment slots at an underutilized location improves provider productivity and chair time, both of which carry margin implications finance tracks separately from new-patient revenue.
- A reputation program that lifts review volume across a regional footprint changes referral patterns and payer negotiation leverage.
- A patient-acquisition channel that disproportionately delivers commercially insured visits shifts payer mix without appearing in the marketing ROI line.
None of these effects survive a spend-over-revenue calculation, and finance teams quietly know it.
Linking Marketing Spend to Clinical, Operational, and Financial Outcomes
Deloitte's framework for measuring the ROI of digital transformation in healthcare gives multi-location operators the structure their CFOs will accept. Quantifying digital and marketing investments requires linking spend to measurable clinical, operational, and financial outcomes, with defined baselines and time-series tracking for each 8. The marketing budget defense becomes a three-column argument rather than a single ratio.
- The clinical column covers patient engagement, adherence to recommended care pathways, and access measures the operations team already reports.
- The operational column covers chair or room utilization, schedule density at underperforming locations, and no-show rates that marketing channels can influence through reminder and intake workflows.
- The financial column carries the conventional metrics — cost per acquired patient, lifetime revenue by service line, payer mix shift — but reads as one input among three rather than the whole case.
Research on scaling patient-facing digital health technologies reinforces the same point: both clinical and economic outcomes, including utilization and cost impacts, must be evaluated together, because either dimension alone systematically misrepresents the program's contribution 11. For a multi-location operator, the practical move is to bring all three columns to the budget meeting and let finance weight them.
What Marketing Leaders Should Walk Into the Next Budget Meeting With
The defense fits on a single page. A spend-ratio anchor placed inside a variance band, a pipeline contribution view expressed in revenue-adjacent units, an honest acknowledgment of the internal measurement gap paired with external benchmarks, and a coordinated operating-model argument that explains why the current spend produces more than a comparable cut would preserve. Four layers, four objections, four answers. The deck does not need a fifth slide.
What the layers share is a refusal to argue inside the contested attribution model. Forrester's spend ratio, McKinsey's efficiency range, and Deloitte's outcome framework hold up because they sit outside the dashboards finance has already learned to discount 6, 7, 3. The marketing leader who brings external reference points keeps the conversation on terrain where the math is shared.
The operating-model layer is the one most budget defenses still leave behind. Coordinated execution across SEO, paid, and backlinks against a single account-level plan — the model Vectoron is built around — is what turns the benchmarks from supporting evidence into a structural argument. The next budget meeting rewards the leader who walks in with both.
Frequently Asked Questions
References
- 1.The development of the concept of return-on-investment from large-scale healthcare quality improvement programmes.
- 2.Marketing strategies and performance metrics in healthcare organizations: A systematic review.
- 3.2026 CMO Survey | Deloitte US.
- 4.The CMO Survey: Marketers Spend on New Technologies as They Battle Usage and Impact.
- 5.Marketing strategies and performance metrics in healthcare organizations: a systematic review.
- 6.The Average B2B Firm Invests 8% Of Revenue In Marketing.
- 7.Performance branding and how it is reinventing marketing ROI.
- 8.Measuring the ROI of Digital Transformation in Health Care.
- 9.The impact of marketing strategies in healthcare systems.
- 10.B2B Marketing Leaders Don't Trust Their Measurement — And What They Measure Isn't Helping.
- 11.Success factors and measures for scaling patient-facing digital health technologies.