
Key Takeaways
- Finance reviews demand a causal-asset-journey framework, not more dashboards, because CFOs want to know the revenue impact of cutting spend and the return on the next dollar.
- Retire last-click ROAS, standalone MQL counts, and reach proxies as headline metrics since platform-reported conversions overstate contribution and exposure data cannot justify allocation decisions 7.
- Marginal ROMI, not average ROMI, drives allocation because a channel with strong average returns may deliver near-zero incremental value once scaled beyond its efficient frontier 1.
- Multi-location operators should rank sites by marginal ROMI against a consistent qualified-inquiry standard, presenting reallocation across locations rather than aggregate spend efficiency to protect the total budget 2.
The CFO Is Not Asking for More Dashboards
The finance team already has dashboards. What it lacks is a compelling reason to maintain a line item that grew last quarter while the sales pipeline remained flat. This scenario represents a negotiation problem, not a measurement problem, requiring an evidence-based defense.
Marketing's strategic influence has expanded, but so has the scrutiny it faces. Duke's Fuqua School highlights an environment where marketing's impact is increasing alongside demands for greater accountability and deeper CFO involvement in spending decisions 8. This means reporting volume no longer suffices; a defensible business case is essential.
Many VPs approach this situation with the wrong data. They present dashboards designed for daily optimization, featuring metrics like session counts, click-through rates, cost per lead by channel, or ROAS from ad platforms. However, finance departments are not asking these questions. Instead, they pose a single question in various forms: What is the revenue impact if this budget line is cut? What would have happened without this expenditure? What is the return on the next dollar spent, not the average dollar spent to date?
Addressing these questions necessitates a more focused, rigorous metric stack, rather than a broader one. Wharton's guidance on budget defense emphasizes that metrics should build a rationale for spending, transforming marketing from a cost center into an investment opportunity 10. The subsequent discussion identifies which metrics meet this criterion.
Why Most Metric Stacks Collapse Under Scrutiny
Typical metric stacks were developed when marketing budgets could expand based on activity reports. This era has ended. Recent CMO Survey data from Duke's Fuqua School indicates that marketing budgets grew only 3.3% in the past year, a decrease from 5.8% in Fall 2024, with digital marketing facing particular scrutiny and CFOs playing a more active role in spending decisions 8. This shift has changed the nature of financial inquiries.
The issue isn't the quality of the underlying data, but rather the flawed logic connecting that data to spending decisions. A dashboard showing a 12% quarter-over-quarter decrease in cost per lead doesn't explain whether the last dollar spent resulted in a booking, a case, or a treatment plan. It answers a different question, one that finance no longer prioritizes.
Three common failure patterns emerge:
- First, metric stacks often confuse activity with outcome, treating clicks, sessions, and form fills as evidence of contribution instead of mere exposure.
- Second, they accept platform-reported conversions as causal, despite platform attribution being optimized to claim credit rather than isolate true lift.
- Third, they average performance across channels or campaign windows, obscuring the marginal impact that finance truly cares about: what the next dollar yields, not the average.
Peer-reviewed research in digital analytics supports this view, noting that narrow channel-level measurement creates a myopic perspective of the customer journey, rewarding optimization of easily measurable steps over those that drive revenue 3. A metric stack designed for daily channel optimization is inadequate for annual budget defense. These two objectives require distinct metrics, and presenting the wrong ones in a finance review can lead to unnecessary budget cuts.
Metrics to Retire Before the Next Budget Review
An effective budget defense begins by eliminating irrelevant metrics. Only metrics that finance would accept as evidence for a spending decision should remain. Metrics that emphasize exposure, output, or platform self-attribution do not meet this standard, and their inclusion in primary reports undermines the credibility of more relevant metrics.
Three categories frequently dominate legacy dashboards but offer minimal defensive value:
- Last-click ROAS as a headline figure
- MQL volume without downstream economic analysis
- Reach proxies like pageviews and follower counts
Each fails for specific, documented reasons. While these metrics can still be useful for internal diagnostic purposes, presenting them as the primary justification to a CFO should cease.
Last-Click ROAS as the Headline Number
Last-click ROAS addresses credit assignment within an ad platform, but it doesn't confirm whether the expenditure generated a customer who wouldn't have otherwise converted. Forrester's work on incrementality testing clarifies this distinction: controlled experiments reveal the true impact of a campaign on business outcomes, whereas platform-reported conversions often overstate contribution because platforms are designed to claim credit 7. A ROAS of 4.2 that, upon testing, shows a lift of only 1.1 is a common discrepancy, and finance will perceive this gap as a credibility issue. Relegate it to a diagnostic metric, not a headline.
MQL Volume Without Downstream Economics
MQL counts represent the top of a pipeline that the CFO does not directly fund; revenue does. An MQL number reported without conversion-to-opportunity rates, opportunity-to-close rates, and revenue per closed account is merely a volume metric disguised as a performance metric. Digital analytics literature explicitly states that measuring only the easiest steps leads to a narrow view of the customer journey, rewarding activity over actual progress toward revenue 3. The rule for retirement is simple: MQL volume should be a supporting metric, while qualified-inquiry-to-revenue economics, which finance truly evaluates, becomes the primary focus.
Pageviews, Follower Counts, and Other Reach Proxies
Pageviews and follower counts measure exposure, not intrinsic value. Research on content marketing effectiveness indicates that performance hinges on managerial context and execution, not merely output volume, meaning traffic totals cannot serve as evidence of business impact 5. Similarly, a review of social media measurement in high-stakes service environments concludes that quantitative counts like hit counts and follower numbers can be misleading, and mixed methods are better for capturing outcomes that leaders value 4. Reach metrics belong in the diagnostic layer and should not influence spending decisions.
Test real ROI metrics with live campaigns
See how actionable ROI data improves your marketing budget decisions in one week of hands-on use.
A Three-Layer Stack That Answers the Cut Question
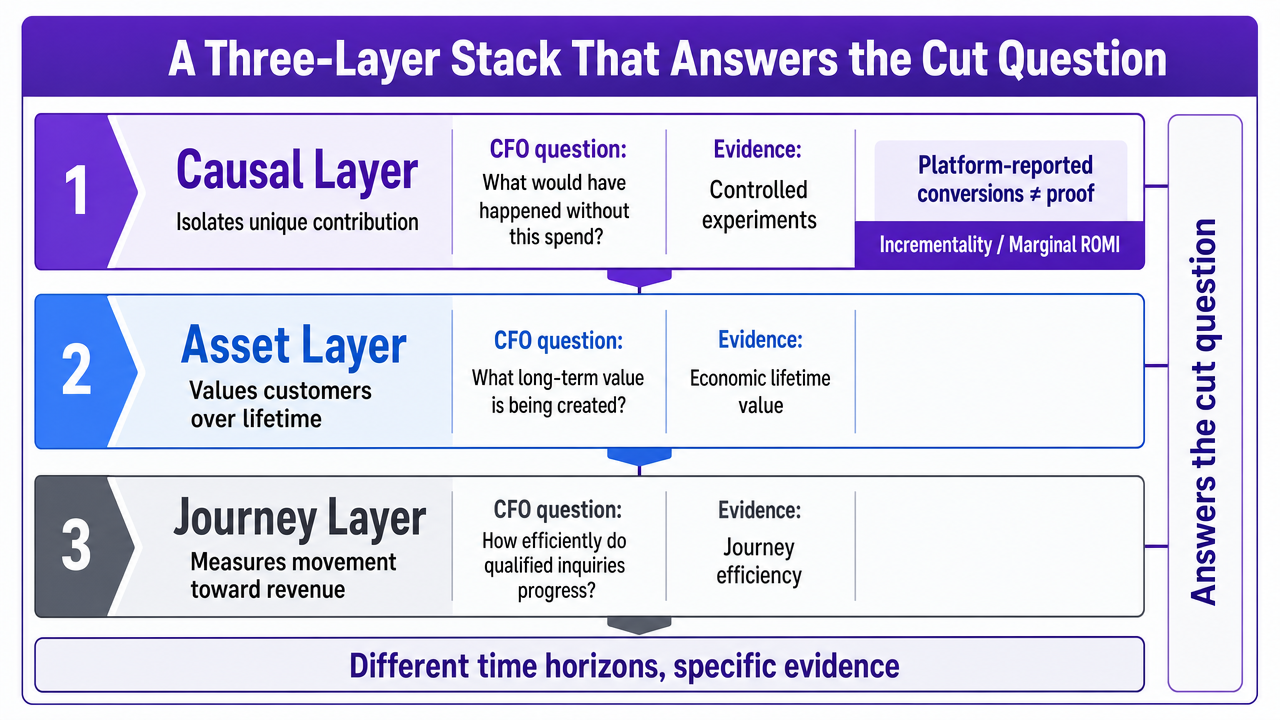
A metric stack successfully navigates finance review when each layer addresses a distinct question posed by the CFO. Three layers effectively achieve this:
- the causal layer, which isolates marketing's unique contributions;
- the asset layer, which values customers over their economic lifetime;
- and the journey layer, which measures the efficiency of moving qualified inquiries toward revenue.
Together, these layers answer the "cut" question across different time horizons, each drawing on specific evidence.
Causal Layer: Incrementality and Marginal ROMI
The causal layer directly addresses finance's core question: what would have happened without this expenditure? Platform-reported conversions cannot answer this, as platforms are designed to claim credit. Controlled experiments, however, can. Forrester's research on incrementality testing positions it as the method for isolating a campaign's true business impact, using holdout groups and geo-based tests to distinguish lift from baseline demand 7. Deloitte's CMO Survey also notes a growing interest among senior marketers in disciplined experimentation to strengthen strategies amidst economic and technological pressures 6. Both sources underscore that causal measurement is now essential for marketing functions seeking to be viewed as investments.
Marginal ROMI serves as the allocation tool alongside incrementality. The AMA asserts that return on marketing investment is the logical unifying metric, but only when calculated on a marginal basis, as allocation decisions depend on the next dollar's return, not the average 1. This distinction is crucial in financial discussions. A channel with an average ROMI of 3.4 might have a marginal ROMI near zero if it has been scaled beyond its efficient frontier. Conversely, a channel with a lower average return could still offer the highest marginal return. Reporting only averages obscures this critical allocation signal.
Marketing leaders should present a chart that pairs average and marginal ROMI for the same channel and period, typically across the last four quarters. The gap between these two lines forms the argument:
- if they track together, the channel is efficient;
- if average remains flat while marginal drops, the channel is overfunded;
- if marginal rises above average, it is underfunded.
Incrementality confirms that spending produced real results, while marginal ROMI guides future allocation. Neither is complete without the other, or without the second layer.
Asset Layer: LTV, Retention, and Payback
The asset layer answers a different financial question: not what a campaign achieved this quarter, but what marketing has built on the customer base's balance sheet. Metrics such as customer lifetime value (LTV), retention curves, and payback period translate acquisition spend into the financial language used for other capital deployments: current cost against future returns over a defined period.
Boston University's review of marketing accountability argues that a purely short-term financial view of ROI undervalues marketing's output, and that a robust accountability framework must encompass long-term customer value and relationship strength 11. The AMA echoes this, cautioning that ROMI alone is insufficient for strategic decisions because it doesn't capture multi-period customer-asset effects 1. Both sources emphasize the same operational point: a marketing budget that pays for itself in 14 months based on LTV is a different investment than one that pays back in 4 months, even if both yield identical quarterly ROAS.
This layer relies on three key numbers:
- LTV calculated using realized, not assumed, retention;
- payback period expressed in months from initial spend to break-even on gross margin;
- and retention curves segmented by acquisition channel, as channels produce customers of varying durability.
A channel that acquires cheaply but experiences rapid churn is a poorer investment than its average ROMI might suggest, a discrepancy finance will eventually uncover. Presenting this within the marketing case, complete with retention curves, distinguishes a proactive defense from a reactive one.
The asset layer also resolves the horizon debate, allowing VPs to defend spending that won't generate revenue in the current quarter without resorting to abstract brand equity arguments that finance doesn't quantify.
Journey Layer: Qualified-Inquiry Economics by Stage
The journey layer bridges causal proof and asset value, measuring the efficiency of moving a prospect from initial exposure to a revenue-generating action, stage by stage. For service businesses, this layer focuses on the qualified inquiry—a person who has articulated a problem the business can solve, within its market, and at a viable price—rather than mere form fills or raw lead counts.
McKinsey's consumer decision journey framework provides the structural basis, advocating for measurement at each stage, from initial consideration to purchase and loyalty, because marketing either facilitates or impedes progress at these points 9. Digital analytics literature reinforces this by highlighting that optimizing only the easiest-to-measure steps leads to a myopic view, rewarding activity over progress, which can result in rising session counts but stagnant pipelines 3.
Four metrics are central to this layer:
- cost per qualified inquiry (total channel spend divided by inquiries meeting a defined qualification standard);
- qualified-inquiry-to-booking rate (tracked back to the marketing source);
- revenue per booking (held constant across sources to reveal channel quality differences);
- and time from inquiry to booking (as longer timelines tie up working capital and misrepresent efficiency).
Consistent, documented qualification standards are crucial here; without them, the layer generates noise. When applied uniformly, often by reviewing recorded intake conversations against a fixed rubric, this layer connects spend directly to revenue. A peer-reviewed conversion rate optimization framework supports this mixed-method approach, showing that sales data combined with structured qualitative input from customer conversations yields more accurate touchpoint valuation than behavioral tracking alone 2.
The journey layer is where the qualified-inquiry economics that finance truly cares about reside. It also represents a significant opportunity for measurement improvement in most service businesses, given that the raw data—recorded intake conversations and booking outcomes—is often already being collected.
 Visualize the three-layer measurement framework (causal, asset, journey) that structures the article's core argument for budget defense
Triangulating the Three Layers Against Sales Data
The three layers provide distinct answers, but the key is to present them cohesively. A causal lift figure without an asset value is a short-term argument. An LTV number without incrementality is a projection that finance can easily dismiss. Journey-stage economics without either is an efficiency narrative disconnected from revenue. A strong defense requires these three perspectives to align, or for the VP to clearly explain any discrepancies.
Sales data serves as the ultimate arbiter. Closed revenue, linked back to marketing-sourced qualified inquiries, is the metric that reconciles these layers. When incrementality testing shows a 14% lift, the asset layer reports a 9-month payback for that cohort, and the journey layer indicates a falling cost per qualified inquiry with a stable booking rate, the three views converge on the same conclusion. Finance values agreement across independent measurements more highly than any single metric, precisely because each layer has different failure modes.
The peer-reviewed conversion rate optimization framework directly supports this reconciliation, demonstrating that combining sales data with structured customer input provides more accurate touchpoint valuation than any single data stream 2. Boston University's accountability review reinforces this principle from a governance perspective, arguing that credible marketing accountability requires evaluating meaningful indicators together, rather than relying on a single headline number 11.
When the layers disagree, that disagreement itself becomes a critical finding. For example, rising marginal ROMI coupled with a lengthening payback period suggests a channel is acquiring cheaper, lower-quality customers. Strong incrementality alongside weak journey economics points to a downstream conversion issue, not a spending problem. Presenting these disagreements to finance proactively, with a clear diagnosis, preserves credibility that a surprised CFO might otherwise question.
See How Leaders Quantify Marketing ROI to Justify Spend
Request a data-driven walkthrough of ROI metric selection frameworks proven to defend budgets and align marketing impact with revenue outcomes in complex organizations.
If the Function Manages a Portfolio of Locations
This article primarily addresses a VP defending a single marketing function. However, the case for a portfolio of locations differs significantly. A VP overseeing marketing for multiple dental offices, behavioral health clinics, or home services branches isn't defending one budget, but rather an allocation across locations, each with its own qualified inquiries, close rates, and revenue per booking. The finance question shifts from whether to fund marketing to which locations should receive the next marginal dollar and which should see a reduction.
Two failure modes commonly undermine portfolio defense:
- First, averaging performance across all locations and reporting a blended cost per qualified inquiry that no single location actually experiences.
- Second, ranking locations by total spend or absolute revenue, which rewards size over efficiency and overlooks reallocation opportunities finance seeks.
Both approaches leave money on the table and provide the CFO an easy justification to trim the aggregate budget.
Ranking Locations by Marginal ROMI, Not Average Spend Efficiency
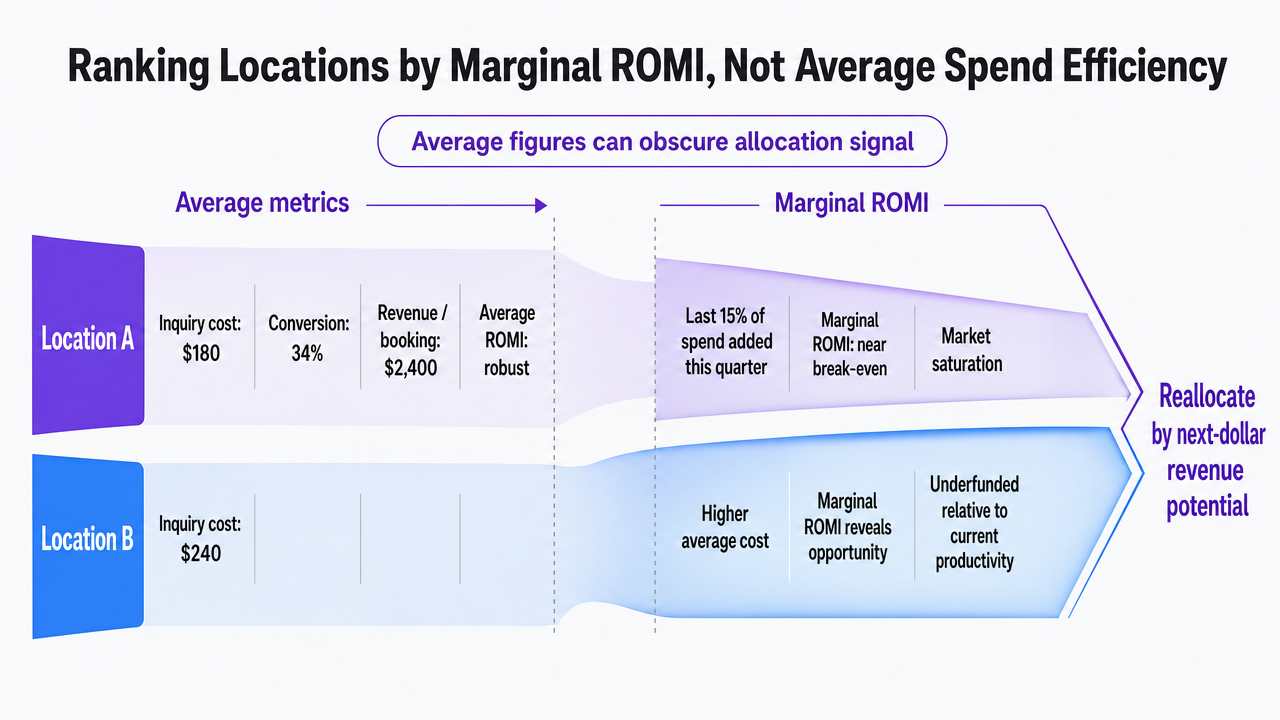
Average spend efficiency across a portfolio indicates which locations appear strong on paper. Marginal ROMI, however, reveals where the next dollar will generate the most revenue. The AMA's guidance on ROMI is even more pertinent in a multi-location context, as average figures obscure the crucial allocation signal: which locations have exceeded their efficient frontier, and which are underfunded relative to their current productivity 1.
Consider a concrete example: Location A generates qualified inquiries at a cost of $180 and converts 34% of them, with a revenue per booking of $2,400. Its average ROMI looks robust. Yet, its marginal ROMI, based on the last 15% of spend added this quarter, has approached break-even due to market saturation. Location B, conversely, has a higher inquiry cost of $240, but its marginal ROMI is increasing with spend because the market is under-penetrated. Ranking by average would suggest cutting B, while ranking by marginal ROMI would recommend shifting funds from A to B, maintaining a flat aggregate budget.
Finance will accept the reallocation argument. Without it, they are likely to cut the total budget.
 Illustrate the concrete Location A vs Location B comparison cited in the prose to show how marginal ROMI reveals reallocation opportunities that average metrics obscure
A Comparison Table for Portfolio Reallocation
The table below uses labeled variables, which the VP can populate with data from their own systems. Locations should be ranked by marginal ROMI, and this ranked view should be presented to finance alongside the causal and asset layers discussed previously.
| Variable | Definition | Source |
|---|---|---|
| Cost per qualified inquiry | Location spend divided by inquiries meeting a written qualification standard | Ad platforms, intake review |
| Qualified-inquiry-to-booking rate | Bookings divided by qualified inquiries, tracked to marketing source | CRM, booking system |
| Revenue per booking | Realized revenue per booked customer, held constant across sources | Financial system |
| Marginal ROMI | Return on the last increment of spend added, not the average | Incrementality tests or spend-response modeling 7 |
Locations should be sorted by the fourth row, not the first. The peer-reviewed conversion rate optimization framework supports combining this behavioral view with structured qualitative input from intake conversations, which is often key to maintaining a defensible and consistent qualification standard across sites 2.
Building the Budget Defense Narrative
The metric stack provides the evidence, but the narrative is what finance truly comprehends. A VP who presents incrementality results, LTV curves, and journey-stage economics on separate slides delivers a report. A VP who presents a single, cohesive argument, supported by these three views, delivers a defense.
The argument follows a consistent structure:
- It begins by addressing the "cut" question in finance's terms: what happens to revenue if this line is reduced by 15%, 25%, or eliminated entirely.
- It then uses the causal layer first, as incrementality is the only measurement that directly addresses counterfactual outcomes 7.
- Next, it moves to the asset layer to extend the time horizon, demonstrating that acquired customers generate revenue over multiple periods and that a broad view of return is more defensible than a single-quarter ROAS 11.
- Finally, it concludes with the journey layer, translating the aggregate case into per-inquiry economics that finance can audit against the CRM.
Wharton's guidance on budget defense remains relevant here: metrics build the rationale for how much to spend and on what, transforming the conversation from cost control to capital allocation 10. The VP's role is not to defend last year's spending, but to price the next dollar and rank alternatives. When the three layers align, the ranking provides the answer. When they disagree, proactively identifying and diagnosing the disagreement preserves credibility that a surprised CFO might otherwise question.
Frequently Asked Questions
References
- 1.Using Return on Marketing Investment Effectively.
- 2.Developing a conversion rate optimization framework for digital marketing campaigns.
- 3.Avoiding digital marketing analytics myopia: revisiting the customer decision journey.
- 4.Criteria to Measure Social Media Value in Health Care Settings.
- 5.Determinants of content marketing effectiveness: Conceptual and empirical investigation.
- 6.2026 CMO Survey | Deloitte US.
- 7.Incrementality Testing Boosts Marketing ROI.
- 8.Marketing's Strategic Influence Expands, As Does Scrutiny.
- 9.The Consumer Decision Journey.
- 10.Defending Your Budget, One Metric at a Time.
- 11.Marketing Accountability: A Holistic Approach.