
Key Takeaways
- A finance-grade marketing ROI report uses four sequenced layers: Executive Summary, Contribution Model, Channel Economics, and Forward Investment Case, where every metric traces cleanly through all four.
- Layer one belongs to four metrics only—Pipeline Contribution, CAC Payback, LTV:CAC, and Incremental Revenue—each carrying a confidence band and a reference to the attribution method behind it.
- Last-click attribution distorts allocation, so a defensible contribution model triangulates Marketing Mix Modeling, incrementality testing, and Multi-Touch Attribution while splitting brand and performance returns into separate columns 4.
- Treat SEO, paid, and backlinks as one acquisition system against a single blended CAC ceiling, then build the forward case as a capital proposal with named tradeoffs and confidence bands.
Why CFOs Stop Reading at Channel Dashboards
A channel dashboard is not a marketing ROI report. It is a status update written in a language finance does not speak. CFOs scanning a deck of CTRs, CPCs, MQL counts, and channel-level ROAS rarely make it past the second page, because none of those numbers reconcile to the P&L they own.
Deloitte's 2026 CMO Survey captures the pressure this creates: marketing leaders increasingly view themselves as primary drivers of enterprise growth, yet face persistent demands to quantify returns in terms finance will accept 7. McKinsey's analysis of the modern CMO role reaches a similar conclusion, arguing that sustainable, customer-centric growth depends on CMOs operating from a shared metric set with the CEO and CFO rather than a parallel one 5.
The disconnect is structural. Channel dashboards measure activity inside marketing's perimeter. CFOs evaluate capital allocation across the entire business. When a marketing report opens with paid social impressions instead of pipeline contribution and CAC payback, finance reads it as evidence that marketing is still optimizing inputs while the rest of the executive team is being held to outputs.
Forrester's measurement research adds the operational layer: organizations that consolidate measurement and abandon last-click thinking correlate with stronger business outcomes, while data silos and attribution shortcuts distort the ROI picture finance is trying to verify 4.
The fix is not a better dashboard. It is a different artifact, written for a different reader, with a structure that mirrors how the CFO reads.
A Report Architecture That Survives Finance Scrutiny
The Four-Layer Structure CFOs Actually Read
The marketing ROI reports that survive finance scrutiny share a common spine: four layers, sequenced in the order a CFO reads.
- Executive Summary, which states pipeline contribution, CAC payback, LTV:CAC, and incremental revenue against plan.
- Contribution Model, which explains how those numbers were produced and which methods were triangulated to produce them.
- Channel Economics, which breaks spend allocation and unit economics across SEO, paid, and backlinks as one acquisition system.
- Forward Investment Case, which proposes the next quarter's capital allocation with expected returns and risk ranges.
This sequencing matters because it inverts how marketing typically reports. McKinsey's analysis of CMO-CEO-CFO alignment argues that durable, customer-centric growth depends on shared metrics and an integrated operating model, not parallel scorecards translated at the boundary 5. A four-layer report enforces that shared model on the page: every metric in layer one reconciles to a method in layer two, every method ties to a channel cost structure in layer three, and every channel cost structure feeds the forward case in layer four.
The architecture also forces editorial discipline. If a metric cannot be traced through all four layers, it does not belong in the Executive Summary. That single rule eliminates most of the channel-vanity content that erodes finance's trust in marketing reporting and replaces it with a defensible audit trail.
What Belongs in Writing vs. What Stays in the Dashboard
A dashboard answers "what is happening right now." The ROI report answers "what did we buy with the quarter's budget, and what should we buy next." Conflating the two is why most marketing reports get skimmed.
The written report carries the four-layer narrative: pipeline contribution against plan, the methods used to attribute it, channel-level CAC and payback math, and the forward investment case with named tradeoffs. It carries assumptions, caveats, and the brand-versus-performance argument that McKinsey flags as a structural tension in modern marketing leadership 1. It carries the things a CFO will quote back in a board meeting.
The dashboard carries the operational telemetry: campaign-level pacing, creative performance, keyword rankings, bid adjustments, MQL flow, and weekly diagnostic metrics. It is the instrument panel for the marketing team, not the artifact for the executive team.
Forrester's measurement research reinforces the split: consolidated, unified measurement correlates with stronger business outcomes, while reports that mix operational telemetry with executive narrative tend to obscure both 4. The practical rule is simple. If a number does not change a capital allocation decision, it stays in the dashboard. If it does, it earns a paragraph in the report.
 Leading marketers using AI for real-time insights
Leading marketers using AI for real-time insights
Layer One: The Executive Summary CFOs Read First
Four metrics carry the Executive Summary:
- Pipeline Contribution against plan
- CAC Payback in months
- LTV:CAC ratio
- Incremental Revenue attributed to marketing
Nothing else belongs in layer one. Channel ROAS, MQL volume, and campaign-level efficiency are diagnostic numbers that support layer three, not opening lines a CFO reads before the next agenda item.
Deloitte's 2026 CMO Survey frames the reason directly: CMOs increasingly position marketing as a primary driver of enterprise growth, yet face sustained pressure to translate that claim into quantifiable returns finance can defend in a board packet 7. The metrics that survive that translation are the ones that already live in the CFO's vocabulary. Pipeline Contribution maps to forecasted revenue. CAC Payback maps to working capital efficiency. LTV:CAC maps to capital allocation logic. Incremental Revenue maps to the counterfactual finance always asks about: what would have happened without the spend.
McKinsey's analysis of CMO-CEO-CFO alignment reinforces the sequencing argument. Customer-centric growth depends on shared metrics across the C-suite, not parallel scorecards that get reconciled at the boundary of each function 5. When the Executive Summary opens with the four metrics finance already tracks, the rest of the report reads as supporting evidence rather than translation.
The discipline is subtractive. Every additional metric in layer one dilutes the four that matter. A pipeline number paired with a CAC payback figure and an LTV:CAC ratio answers the CFO's first three questions before they are asked. Adding a fifth metric invites a fourth question that the report has not yet earned the right to answer.
One operational rule keeps the Executive Summary honest: each of the four metrics must carry a confidence band and a method reference pointing to layer two. A pipeline number without a stated attribution method is a marketing claim. A pipeline number with an MMM-and-incrementality method reference is a finance-grade figure.
Prove ROI With Data-Driven Campaign Reporting
Generate actionable marketing ROI reports using your own live campaign data in just one week.
Layer Two: The Contribution Model That Replaces Last-Click
Unified Measurement: MMM, Incrementality, and MTA Working Together
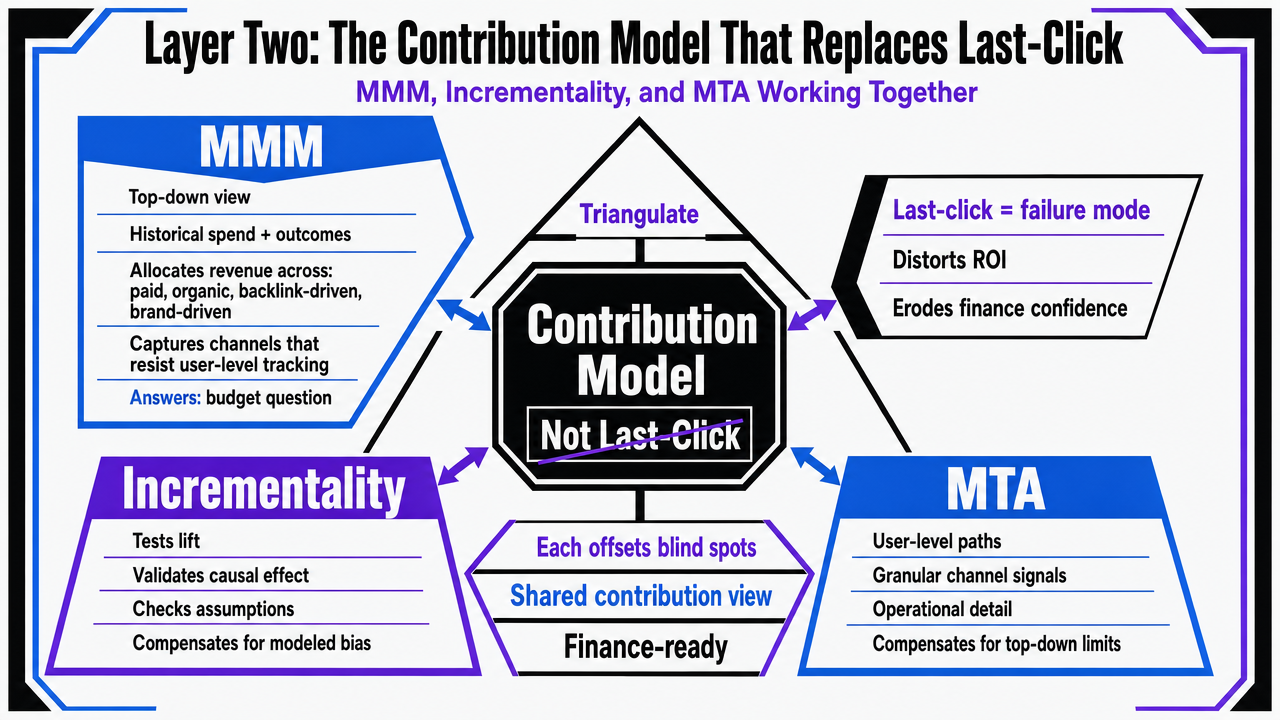
Layer two answers the only question a CFO actually asks about layer one: how was that number produced. The answer cannot be last-click. Forrester's measurement research treats last-click attribution as a recognized failure mode, alongside data silos and organizational resistance, that distorts ROI estimates and erodes finance's confidence in the report 4. A contribution model that survives scrutiny triangulates across three methods, each compensating for the others' blind spots.
Marketing Mix Modeling sets the top-down view. It allocates revenue across paid, organic, backlink-driven, and brand-driven contribution using historical spend and outcome data, and it captures the channels that resist user-level tracking. MMM answers the budget question: what is the marginal return on the next dollar in each channel, holding the others constant.
Incrementality testing supplies the causal layer. Geo holdouts, audience holdouts, and conversion-lift studies isolate what would not have happened without the spend. Incrementality is the method that converts a pipeline claim into a counterfactual finance can defend, and it is the only one of the three that directly answers the "would we have closed this anyway" objection.
Multi-Touch Attribution carries the bottom-up granularity. It explains how individual deals moved through the funnel, which content assisted which conversions, and where the friction lives. MTA is a diagnostic instrument, not a verdict.
The contribution model paragraph in the report names all three methods, states which one anchors each Executive Summary metric, and discloses the confidence band. McKinsey's analysis of CMO-C-suite alignment frames the underlying requirement: shared methods produce shared metrics, and shared metrics are what finance will sign off on 5.
The Brand-vs-Performance Tension the Report Must Address
Every quarterly ROI report carries an unresolved argument: how much of the budget should chase next-quarter pipeline versus next-year demand. McKinsey's analysis of marketing's modern core names this directly, warning that overemphasis on near-term performance ROI can erode the brand investment that drives long-term growth, and citing brand building as the top stated priority for marketing leaders heading into 2026 1.
A defensible report addresses the tension on the page rather than burying it. The Contribution Model layer should split reported returns into two columns:
- Performance contribution, measured against the current quarter's pipeline and CAC payback
- Brand contribution, measured against branded search volume, direct traffic, aided awareness, and the MMM-estimated baseline that exists when paid is paused
The split matters because it changes the conversation with finance. A CFO evaluating a brand investment line against the same payback horizon as a paid search line will always cut the brand line. A CFO evaluating brand against an explicit long-horizon return, with the baseline lift quantified, can weigh the tradeoff as a capital allocation decision rather than a marketing preference.
Deloitte's 2026 CMO Survey captures the same fault line: CMOs are rebalancing investments under budget pressure, with sustained disagreement over how to weight brand against performance when capital is constrained 7. The report's job is not to resolve the debate. It is to make the tradeoff legible.
 Illustrate the triangulation of MMM, Incrementality, and MTA described in the section, showing how each method compensates for the others' blind spots in the contribution model
Layer Three: Channel Economics as One Acquisition System
Coordinated SEO, Paid, and Backlink Economics Against a Single CAC Target
Layer three breaks the channel-by-channel reporting habit that finance has learned to distrust. Treating SEO, paid, and backlinks as separate ROI stories produces three optimistic narratives that, summed together, never reconcile to the blended CAC sitting in the CFO's model. The fix is to present channel economics as one acquisition system measured against a single blended CAC target, with each channel's contribution stated as a share of that target rather than as a standalone return.
The mechanics are straightforward. The report fixes a blended CAC ceiling derived from gross margin and the payback window finance will tolerate, then allocates that ceiling across paid, organic, and backlink-driven acquisition based on each channel's marginal contribution from the MMM in layer two.
- Paid carries the highest per-unit CAC and the shortest signal latency.
- Organic content carries the lowest per-unit CAC at steady state but a longer payback curve.
- Backlinks function as a multiplier on organic, reducing the time organic takes to reach steady state.
Forrester's measurement research is direct about the alternative: when channels are measured in isolation, last-click logic distorts the allocation and erodes finance's confidence in the underlying numbers 4. McKinsey's CMO-alignment work reinforces the point. Shared metrics across the C-suite require a single CAC view, not three 5.
CAC Payback and LTV:CAC: A Worked Example with Variable Labels
The CAC payback and LTV:CAC math belongs on the page in variable form so finance can substitute the company's actual figures and audit the result. Inventing dollar values for an article on report architecture would defeat the exercise. The variable labels below are the ones the report should carry verbatim, with the company's quarterly figures dropped in.
| Variable | Definition | Source in Report |
|---|---|---|
| Blended CAC | Total acquisition spend ÷ new customers acquired | Layer 3 summary line |
| Paid CAC | Paid media spend ÷ paid-attributed new customers (MMM-weighted) | Layer 3 channel detail |
| Organic CAC | Content, SEO, and backlink spend ÷ organic-attributed new customers | Layer 3 channel detail |
| Monthly ARPA | Average recurring revenue per account, monthly | Finance data, not marketing |
| Gross Margin % | (Revenue − COGS) ÷ Revenue | Finance data, not marketing |
| CAC Payback (Months) | Blended CAC ÷ (Monthly ARPA × Gross Margin %) | Layer 1 Executive Summary |
| LTV:CAC | (Monthly ARPA × Gross Margin % × Avg Customer Lifetime in Months) ÷ Blended CAC | Layer 1 Executive Summary |
Two disciplines keep the math defensible. First, Gross Margin and Monthly ARPA are pulled from finance's system of record, not from marketing's CRM. If the report uses a different ARPA than the one in the board model, the CFO will discount every other number on the page. Second, the customer lifetime input in LTV:CAC carries a confidence band, because it is the variable most often inflated to make the ratio look stronger.
McKinsey's analysis of CMO-CEO-CFO alignment frames why this matters: shared metrics depend on shared inputs, and the credibility of the LTV:CAC ratio rests on whether finance recognizes the variables feeding it 5. Deloitte's 2026 CMO Survey adds the budget context. CMOs facing sustained pressure to quantify returns gain leverage when the payback math is presented in the same form finance already uses for capital allocation decisions 7.
The worked example also enforces honesty about channel mix. A blended CAC that meets payback only because paid is subsidized by underpriced organic contribution is not a sustainable acquisition system. Splitting Paid CAC and Organic CAC on the same page exposes the cross-subsidy and turns it into a forward-investment question for layer four.
Layer Four: The Forward Investment Case
Layer four is where the report stops describing the past quarter and starts proposing the next one. It is also where most marketing ROI reports collapse, because the forward case is written as a budget request rather than a capital allocation proposal. Finance reads the difference instantly.
A defensible forward case names three things on the page: the incremental capital being requested, the expected return expressed in the same metrics that opened layer one, and the named tradeoffs the allocation forces. If a $1.2M shift from paid to organic content is the proposal, the report states the expected blended CAC delta, the payback impact, the assumed time-to-steady-state for the organic curve, and what gets cut or deferred to fund it. McKinsey's analysis of marketing's modern core frames the underlying expectation directly: marketing leaders must demonstrate accountability for growth, not just manage campaign throughput, and the forward case is where that accountability is written down 1.
Two disciplines separate a capital proposal from a budget request. First, every line in the forward case carries a confidence band, not a point estimate. Finance does not believe single-number forecasts and will discount any report that pretends to produce them. Second, the forward case names what the report will measure next quarter to validate the bet, so the next ROI report opens with a reconciliation rather than a new narrative.
Deloitte's 2026 CMO Survey captures why this matters under current budget pressure: CMOs are rebalancing investments while facing sustained scrutiny on returns, and the leaders gaining capital are those framing requests as portfolio decisions with explicit downside ranges 7. The forward investment case is the page that earns next quarter's budget by showing the math that will judge it.
See the Metrics That Demonstrate Marketing’s True Revenue Impact
Request a sample ROI report modeled for SaaS and agency teams—showcasing integrated SEO, PPC, and backlink performance tied directly to customer acquisition benchmarks.
AI-Enabled Measurement and the New Production Math
AI changes two lines in the ROI report, and the report should name both. The first is the cost basis of content and creative production, which compresses when generative tooling absorbs work that used to sit with agencies or in-house specialists. The second is the speed of measurement itself, where pattern detection across MMM outputs, incrementality results, and CRM signals shortens the loop between a spend decision and the evidence that judges it.
Sector maturity is uneven, and the report should say so plainly. McKinsey's late-2025 survey found that roughly 50% of healthcare organizations report generative AI implementation, with focus shifting from pilots to integrated deployments tied to business outcomes 3. That figure is healthcare-specific, not a cross-sector benchmark, and citing it as a universal adoption rate is the kind of overreach finance will flag.
The practical implication for layer three is a lower Organic CAC at steady state, because production throughput per dollar rises. The implication for layer two is tighter confidence bands, because measurement cycles run more often against the same MMM structure. McKinsey's analysis of marketing's modern core treats AI-enabled measurement as a central capability for the 2026 CMO agenda, not a side project 1. The report should reflect that by stating which AI-driven inputs changed which line, and by how much.
 Healthcare organizations reporting generative AI implementation
Healthcare organizations reporting generative AI implementation
If You Operate Multiple Sites: Rolling Site-Level Economics to Portfolio ROI
Audience shift: this section addresses multi-location operators rolling up site-level marketing economics into a portfolio ROI view. SaaS readers can skip to layer four operating cadence.
The four-layer structure holds at the portfolio level, but layer three changes shape. Each site or service line produces its own Blended CAC, payback curve, and channel mix, and the portfolio report must reconcile those into a single P&L view without erasing the variance that explains it. A multi-location operator running twenty sites against one blended CAC number is hiding the three sites that drag the average and the two that subsidize it.
The practical fix is a site-level economics table feeding a portfolio summary line. Each row carries the site's Paid CAC, Organic CAC, payback months, and contribution to portfolio pipeline. The summary line carries the weighted blended figures that open layer one. Outliers earn a named paragraph rather than disappearing into the average.
Deloitte's framework for digital transformation ROI in healthcare reinforces the multi-dimensional view: financial returns sit alongside operational efficiency and experience outcomes, and a portfolio report that captures only revenue lift misses the value drivers regulators and investors increasingly demand 6. McKinsey's healthcare marketing work adds the patient-experience layer, arguing that the ultimate measure of return includes improved outcomes and satisfaction scores, not just acquisition volume 2.
One discipline keeps the rollup honest. Site-level CAC must be calculated against site-level revenue, not portfolio-level revenue allocated by headcount or square footage. The cross-subsidy patterns that emerge are the forward-investment questions layer four is built to answer.
Operating the Report on a Quarterly Board Cadence
The ROI report is a quarterly artifact, not a monthly one. Monthly cadence collapses it back into a dashboard and strips the time horizon that makes attribution credible. Quarterly cadence matches how finance closes the books and how the board allocates capital, which is the audience the four-layer structure is built for.
Three operating rules keep the cadence productive.
- The report opens with a reconciliation against the prior quarter's forward investment case, naming where the bet landed inside, above, or below its confidence band. A report that never reconciles its own forecasts loses the credibility McKinsey's CMO-alignment work treats as the precondition for shared C-suite metrics 5.
- The contribution model in layer two is refreshed quarterly with new MMM coefficients and any incrementality tests that closed in the period, so the methods evolve with the business rather than calcifying around a single vendor study.
- The forward case names one structural bet per quarter, not five. Deloitte's 2026 CMO Survey describes the budget environment plainly: marketing leaders gain capital by framing fewer, better-defended requests, not by spreading the ask across every channel 7. One bet, fully scoped, with the metrics that will judge it, is what earns the next allocation.
Frequently Asked Questions
References
- 1.Past forward: The modern rethinking of marketing's core.
- 2.Marketing in healthcare: Improving the consumer experience.
- 3.Generative AI in healthcare: Adoption matures as agentic AI emerges.
- 4.Effective Marketing Measurement And Optimization Delivers Business Results.
- 5.The CMO's comeback: Aligning the C-suite to drive customer-centric growth.
- 6.Measuring the ROI of Digital Transformation in Health Care.
- 7.2026 CMO Survey | Deloitte US.