
Key Takeaways
- A single blended ROI figure no longer defends marketing spend; credible measurement requires a stack combining a financial layer, a causal layer, and a first-party signal layer.
- ROMI decomposed into revenue growth, efficiency gains, and cost avoidance reconciles to the income statement, while CLV:CAC segmented by cohort exposes which customers actually pay back acquisition cost 8.
- Multi-touch attribution breaks in phone-driven verticals because qualifying happens after the click; AI-read call intelligence supplies the last-mile signal that MMM and CLV:CAC need to consume 7.
- Spend the next two quarters fixing the data foundation, standing up weekly signal metrics, then layering monthly ROMI reviews and a quarterly MMM refresh under a locked reconciliation cadence.
Why a Single ROI Number Stopped Working
Marketing ROI, expressed as a single ratio of revenue over spend, has quietly become the least useful number on the quarterly review deck. It reconciles to nothing the CFO already trusts, it flattens causality into correlation, and it hides where the money actually came from. Forrester describes marketing ROI as "one of the most sought-after metrics" in B2B, then warns that it is routinely misapplied as a catch-all judge of performance 7. That misapplication is now expensive.
The pressure behind the misuse is well documented. Duke's Fuqua commentary on recent CMO Survey data notes that marketing pessimism sits at its highest point since the pandemic, even as AI's role in marketing execution expands 9. Deloitte's 2026 CMO Survey adds that leaders are being asked to strengthen core strategies through disciplined experimentation under tightening budgets 2. A VP defending spend with a single blended ROI number, in that environment, loses the argument before the meeting starts.
The alternative is not a better formula. It is a stack.
Board-legible ROI measurement in 2025 requires three layers working in parallel: a financial layer that speaks the CFO's language (ROMI, CLV:CAC, margin contribution), a causal layer that isolates what marketing actually caused (mix modeling, geo holdouts, incrementality tests), and a signal layer that captures first-party evidence of qualified demand — including AI-read phone intake, which most attribution models never see. Each layer answers a different question. None of them, on its own, produces a defensible number.
The sections that follow assemble that stack, layer by layer, and show where AI call intelligence closes the gap between a booked lead and booked revenue.
The Three-Layer Measurement Stack
Financial Layer: ROMI, CLV:CAC, and Margin Contribution
The financial layer exists for one reader: the CFO. Its job is to translate marketing activity into the same units used on the income statement — revenue, margin, and avoided cost — and to hold those numbers steady across quarters so trends mean something.
Three metrics carry most of the weight. Return on marketing investment (ROMI) measures the incremental profit generated per dollar of marketing spend, and Forrester's Total Economic Impact framework recommends decomposing that impact into revenue growth, efficiency gains, and cost avoidance rather than reporting a single blended figure 8. That decomposition is what makes ROMI legible to finance: each component maps to a line the CFO already tracks.
The load-bearing ratio is CLV:CAC. Wharton defines customer lifetime value as the total spend expected from a customer across the full relationship, calculated from purchase frequency, average order value, and customer lifespan 5. Divide that by fully loaded customer acquisition cost and the ratio tells a VP whether the business is buying customers profitably. For high-consideration service verticals, where a single booked case, procedure, or contract can carry twelve to thirty-six months of downstream revenue, CLV:CAC is a more honest performance signal than ROAS, which stops counting the moment the credit card clears.
Margin contribution closes the layer. Not every acquired customer is worth the same. Segmenting CAC by customer cohort — practice area, service line, insurance mix, location — reveals which segments produce high-margin lifetime value and which absorb spend without returning it. Forrester's B2B value model reinforces this: high-performing marketing organizations are 64% more likely to operate a measurement-driven culture, meaning finance-legible metrics get standardized rather than reinvented each quarter 6.
The financial layer answers what did marketing produce. It does not answer what marketing caused. That is the next layer's job.
Causal Layer: MMM, Geo Holdouts, and Incrementality
The financial layer records outcomes. The causal layer isolates which marketing actions actually moved them. This is where most in-house measurement stacks collapse, because the tools that dominate day-to-day reporting — platform dashboards and multi-touch attribution — are correlation engines, not causal ones.
Marketing mix modeling remains the anchor method. Deloitte describes MMM as a statistical methodology that quantifies the relationship between advertising, price, distribution, visits, and sales, using historical data to attribute revenue impact across channels and guide budget allocation 1. MMM handles offline and online channels in the same model, tolerates cookie deprecation, and produces the elasticity curves a CFO can read as marginal ROI. Its limits are equally clear: it needs multiple years of clean data, it operates at weekly or monthly granularity, and it cannot tell a VP which creative won yesterday.
Geo holdouts and incrementality tests fill that gap. By suppressing spend in matched market pairs — one region receives the campaign, a comparable region does not — a marketing team observes the true lift attributable to the channel. These experiments answer questions MMM cannot: does the paid search brand campaign cannibalize organic, does the local TV flight actually drive intake, does the retargeting layer produce incremental bookings or reshuffle existing ones.
Multi-touch attribution (MTA) belongs in the stack, but not at the top of it. Forrester warns that ROI methods are routinely misapplied when used as a catch-all judge of performance, and MTA is the most common offender — it credits touchpoints without proving causation 7.
A working comparison for VPs building this layer:
| Method | Causality | Granularity | Latency | Relative cost |
|---|---|---|---|---|
| MMM | Strong (aggregate) | Channel / week | Weeks to months | High |
| MTA | Weak (correlational) | User / touch | Near real-time | Medium |
| Incrementality tests | Strong (isolated) | Campaign / geo | Test window | Medium |
| Unified marketing measurement | Strong (blended) | Channel + user | Mixed | High |
Run MMM annually or semi-annually as the backbone. Run geo holdouts continuously against the highest-spend channels. Let MTA inform pacing decisions, never budget decisions.
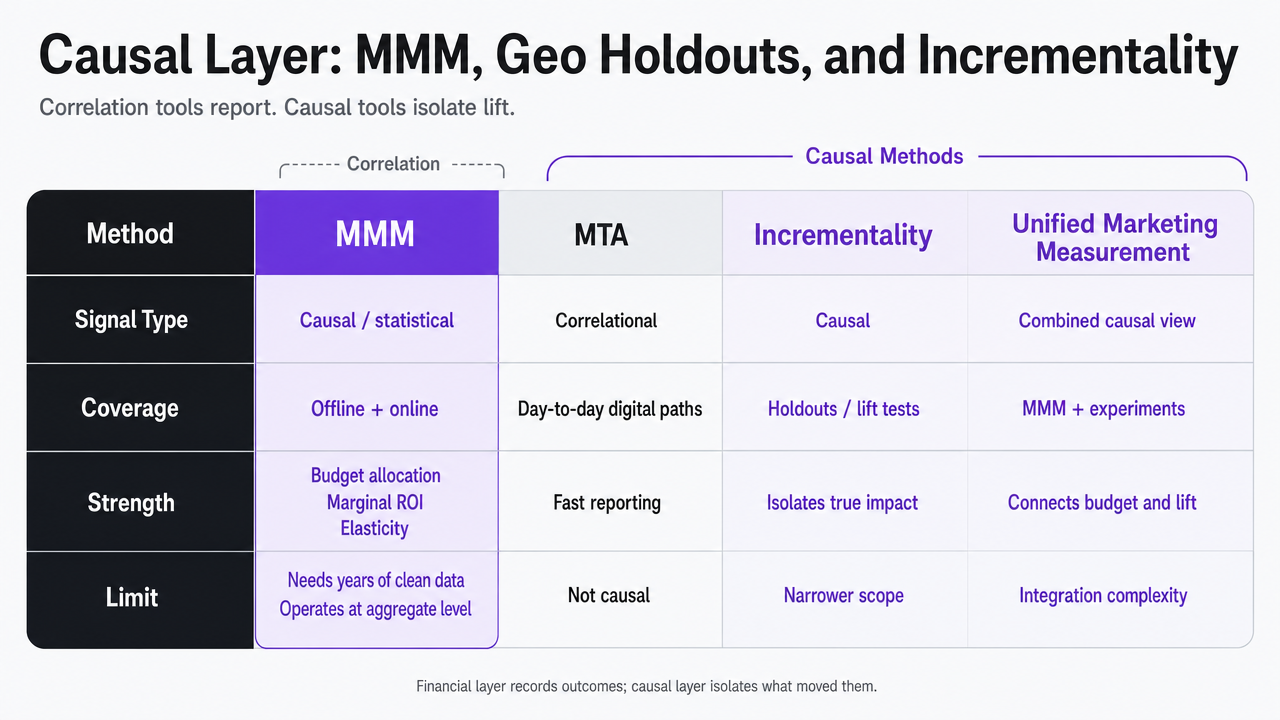 Render the comparison table from this section (MMM vs MTA vs Incrementality vs Unified Marketing Measurement) as a scannable visual matrix, directly supporting the section's cited methodology comparison
Signal Layer: First-Party Intake and AI Call Intelligence
The financial and causal layers still leave a gap in service verticals: they treat every conversion event as equivalent. A form fill, a chat submission, and an inbound phone call all count as one lead in the CRM, even though their downstream revenue behavior differs by an order of magnitude. The signal layer corrects that by grading demand at the point of intake, using first-party evidence rather than platform-reported conversions.
For phone-driven verticals — law firms, dental groups, behavioral health, senior living, home services — the highest-value intake channel is the call. Standard analytics see the call as a single conversion event. AI call intelligence reads the recording, tags whether the caller was a qualified prospect or a wrong-number spam call, identifies the service line requested, and flags whether the intake team booked, missed, or mishandled the opportunity. That output feeds two places the other layers cannot reach: the causal model gets cleaner conversion inputs, and the financial layer gets a defensible qualified-lead-to-revenue ratio per channel.
The scope of this shift is documented. Deloitte's technology value survey reports that 74% of surveyed organizations invested in AI and generative AI over the past year, with more than half allocating between 21% and 50% of digital initiative budgets to AI 3. That budget flow means AI-influenced marketing output — including the signals extracted from calls, chats, and forms — is now large enough that measuring it explicitly, rather than assuming it, is a governance requirement.
Three signal-layer inputs deserve standing dashboards:
- Qualified inquiry rate by channel, source, and campaign — not raw call volume.
- Intake conversion rate — qualified inquiries that convert to booked appointments or contracts.
- Missed opportunity rate — qualified callers who did not book, tagged by reason.
Fed back into MMM, these signals sharpen channel elasticity estimates. Fed into CLV:CAC, they replace generic lead counts with revenue-weighted acquisition volumes. That is how the last-mile between marketing spend and booked revenue actually gets closed.
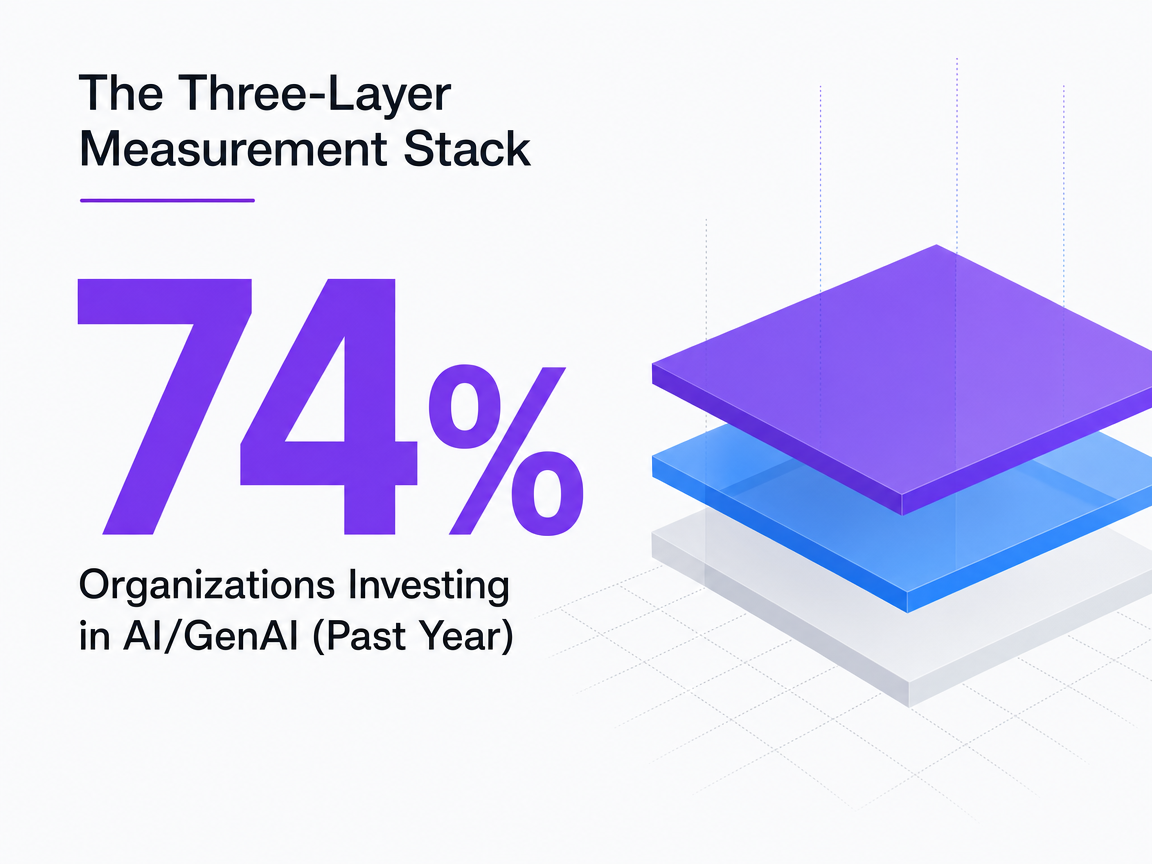 Organizations Investing in AI/GenAI (Past Year)
Organizations Investing in AI/GenAI (Past Year)
Data Foundation: The Precondition Most Stacks Skip
None of the three layers work on dirty data. VPs building measurement programs routinely spend six months arguing about attribution windows before discovering their CRM has three duplicate records per patient, no consistent location tag on paid leads, and a call-tracking system that fires conversion events for hang-ups. The stack collapses at the foundation, not the model.
A Forrester Total Economic Impact study of unified data management quantified what clean infrastructure actually returns: a 2% uplift in revenue tied directly to data consolidation, with higher-margin deals coming in 10% more profitable in 50% of observed cases 4. The study measured B2B customers of a single data management provider, so the exact percentages are contextual — but the direction and mechanism generalize. Cleaner segmentation and consistent hierarchy mapping change which customers get pursued, which offers they see, and how downstream revenue is credited. That is a marketing outcome, not an IT one.
Four foundational elements have to sit under the stack before any measurement method returns a defensible number:
- A single customer identity spine that reconciles CRM, ad platforms, call logs, and booking systems to one record per person or account.
- Consistent taxonomy for channel, campaign, service line, and location — enforced at ingestion, not patched in the warehouse.
- First-party conversion definitions that separate raw events (form fills, calls) from qualified events (booked appointments, signed contracts).
- Cost data at the same grain as revenue data — spend attributable to campaign, geography, and service line, not blended monthly totals.
Without those four, MMM produces confident nonsense, CLV:CAC drifts by cohort definition, and the signal layer feeds noise upstream. Fund the foundation before funding the models.
Test ROI measurement on your live campaigns
See how real-time analytics validate your marketing impact before you commit.
The Last-Mile Gap: Where Attribution Breaks in Service Verticals
Attribution models were built for e-commerce. A user clicks an ad, lands on a product page, adds to cart, checks out. Every step is a digital event with a timestamp, and the revenue is booked in the same session that started the journey. Service verticals do not work that way.
The path in a law firm, dental group, or senior living community runs longer and detours offline: paid search click → landing page → form fill or phone call → intake conversation → qualification → scheduled consultation → signed agreement → booked revenue. The clickstream ends at step two or three. Everything that determines actual ROI happens after the browser closes.
That is the last-mile gap. Standard multi-touch attribution credits the digital touchpoints it can see and goes silent on the intake conversation that decides whether the lead was qualified, whether the caller was routed correctly, and whether the booking actually happened. A campaign that generates 200 form fills and 50 booked cases looks identical, in most dashboards, to a campaign that generates 200 form fills and 8 booked cases. The CFO sees the second campaign on the P&L. The VP defends both with the same acquisition-cost report.
Three intake failure modes account for most of the gap:
- Unqualified volume credited as conversions — spam calls, wrong-service inquiries, and out-of-market leads counted the same as booked prospects.
- Missed calls and abandoned handoffs — qualified demand that never reaches an intake specialist, invisible to the ad platform reporting the conversion.
- Service-line misrouting — a caller requesting a high-margin service tagged generically, distorting channel-level CLV.
Closing the gap is a data problem, not a modeling problem. AI-read call intelligence — transcription, qualification tagging, missed-opportunity flagging — converts the intake conversation into structured signal that MMM and CLV:CAC can actually consume. Forrester's guidance against treating ROI as a single catch-all metric applies here directly: without last-mile signal, every upstream number is estimating something the business never observed 7.
Governance: A Reconciliation Cadence the CFO Will Sign Off On
A measurement stack without a reconciliation rhythm produces the same problem as no stack at all: numbers that arrive in different meetings, contradict each other, and never resolve into a single decision. Governance is what turns three parallel layers into one defensible reporting practice.
The cadence has three tempos, matched to what each layer can honestly answer.
Weekly: the signal layer. : Qualified inquiry rate, intake conversion rate, missed-opportunity rate, and channel-level cost per qualified inquiry get reviewed weekly against a rolling four-week baseline. This is the pacing meeting — no budget shifts larger than a pre-agreed threshold, no strategy changes. The signal layer moves fast enough to catch a broken landing page or a misrouted call queue before the month closes. It is not fast enough, or causal enough, to justify reallocating a quarter's spend.
Monthly: the financial layer. : ROMI decomposed into revenue growth, efficiency gains, and cost avoidance — the three benefit categories Forrester's Total Economic Impact framework recommends when quantifying business value 8— plus CLV:CAC by cohort and margin contribution by service line. Marketing and finance sign the same numbers before they leave the room. Any variance from plan gets attributed to a specific driver, not a blended assumption. This is the meeting where the CFO stops asking whether the marketing report reconciles to the general ledger.
Quarterly: the causal layer. : MMM refresh, geo-holdout readouts, incrementality test results, and any planned reallocation across channels. Budget shifts of consequence happen here, on evidence the CFO can see the math behind, not on last week's platform-reported ROAS.
Two governance rules hold the cadence together. First, standardize the metric set. Forrester's warning applies directly: ROI misapplied as a single catch-all metric produces the wrong decisions, so definitions, formulas, and cohort boundaries have to be locked and versioned 7. Second, name an owner for each layer — usually marketing operations for signal, FP&A partnered with marketing for financial, and an internal or external analytics lead for causal. Ownership without arbitration is where measurement programs quietly die.
Run this cadence for two full quarters and the conversation with finance changes shape. The question stops being can you prove marketing worked and becomes which layer are we deciding from this week.
See How Leading Brands Quantify Marketing ROI with AI-Driven Precision
Request an in-depth walkthrough of current best practices for measuring marketing impact, including real benchmarks and actionable frameworks for pipeline attribution, conversion analysis, and channel optimization.
If You Manage Multiple Locations: Measurement Operating Models Compared
The stack described so far applies to any marketing organization. The economics of running it change sharply once the business operates across multiple locations — a regional dental group, a multi-state law firm, a home services franchise network, a senior living portfolio. This section is written for those operators.
Multi-location measurement fails in a specific way. Each location generates its own call volume, its own paid spend, its own intake staff, and often its own CRM instance. Rolling that up into a defensible ROMI figure means reconciling not one measurement stack but ten, thirty, or a hundred variants of it. Three operating models dominate how in-house teams solve for that, each with different variables to weigh.
| Operating model | Team footprint | Reconciliation cadence | Time-to-signal | Primary failure mode |
|---|---|---|---|---|
| Channel-vendor reporting stack | Lean marketing team; each vendor reports independently | Ad hoc, per vendor | Fast per channel, slow to consolidate | Numbers never reconcile to booked revenue |
| In-house analyst plus BI | Marketing ops, data analyst, BI engineer | Monthly and quarterly | Delayed by data engineering backlog | Headcount cost outpaces measurement gains |
| Unified AI-assisted measurement with approval workflow | Lean marketing team plus governed automation | Weekly signal, monthly financial, quarterly causal | Near real-time signal layer | Requires disciplined data taxonomy upfront |
The channel-vendor model is the default most multi-location operators inherit. It scales spend before it scales measurement, which is why the quarterly reconciliation with finance turns into an argument about which vendor's dashboard to believe. The in-house analyst model solves the reconciliation problem by centralizing data, but Forrester's guidance on decomposing marketing impact into revenue growth, efficiency gains, and cost avoidance becomes hard to honor when a meaningful share of the efficiency gain is consumed by the analyst headcount funding it 8.
The third model treats measurement as an operating layer rather than a reporting function. Signals from every location — calls, forms, bookings, spend — flow into a common taxonomy, get graded automatically, and surface as ranked recommendations that a human approves before anything ships or shifts. The variable that changes for multi-location operators is not accuracy; MMM and CLV:CAC are as valid at ten locations as at one. The variable is the marginal cost of running the stack across N locations without adding N analysts. That is the decision to make before the next fiscal year's marketing plan is drafted.
What to Build in the Next Two Quarters
Two quarters is enough time to stand up the stack, not to perfect it. The goal is a defensible baseline the CFO signs, not a finished measurement science.
- Quarter one. Fix the data foundation first — single customer identity spine, locked taxonomy, first-party conversion definitions that separate raw events from qualified ones, and cost data at the same grain as revenue data. In parallel, stand up the signal layer: qualified inquiry rate, intake conversion rate, and missed-opportunity rate reported weekly, with AI-read call intelligence feeding the qualification tags. By the end of the quarter, marketing and finance should be reading the same qualified-lead-to-revenue ratio.
- Quarter two. Build the financial layer on that clean input. ROMI decomposed into revenue growth, efficiency gains, and cost avoidance per Forrester's TEI structure, plus CLV:CAC by cohort, reviewed monthly with FP&A 6. Commission the first MMM refresh and one geo-holdout test against the highest-spend channel. Lock the reconciliation cadence — weekly, monthly, quarterly — with a named owner for each layer.
Two operator decisions gate the plan. First, name the metric set before the models get built; a small, standardized set beats a comprehensive one that nobody signs. Second, decide whether the stack runs on added analyst headcount or on governed automation with human approval — Vectoron is one option built for the second path. The next board meeting is where the choice shows up.
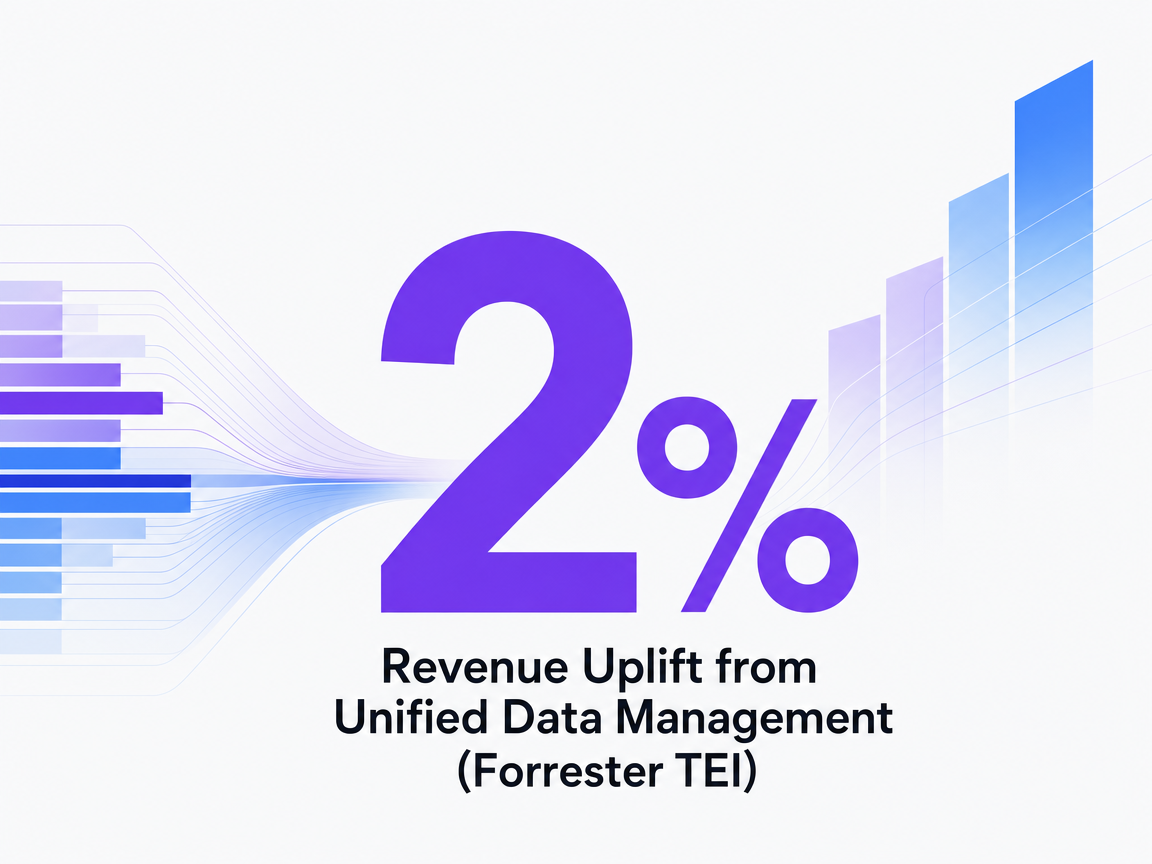 Revenue Uplift from Unified Data Management (Forrester TEI)
Revenue Uplift from Unified Data Management (Forrester TEI)
Frequently Asked Questions
References
- 1.Maximize ROI with Marketing Mix Modeling for Advertising Success.
- 2.2026 CMO Survey | Deloitte US.
- 3.AI and tech investment ROI | Deloitte Insights.
- 4.The Total Economic Impact™ Of Dun & Bradstreet's Data Management Solutions.
- 5.Customer Lifetime Value: What It Is and Why It Matters.
- 6.Five Simple Steps to Demonstrate the Full Value of Marketing.
- 7.How To Measure Marketing ROI.
- 8.Measuring Business Value Is Within Your Reach.
- 9.CMOs Face Headwinds Even as Marketing Value and AI Impact Grow.