Key Takeaways
- Acquisition and retention are asymmetric financial instruments: acquisition buys a first visit, while retention compounds margin, revenue mix, and utilization efficiency across the patient's lifetime.
- Retention-adjusted CAC reveals true ROI by dividing acquisition cost by revenue across the continuity window, exposing why identical CAC figures produce very different financial outcomes by site.
- Value-based payment contracts tilt the math toward retention, because three of four CMS Hospital VBP domains respond to experience and continuity rather than acquisition spend 4.
- Acquisition wins decisively in three scenarios: new location launches with no panel to defend, capacity fill at sites with absorbed fixed costs, and exogenous panel churn from insurance or demographic shifts.
- Allocation decisions belong at the site level, not the system level, because panel design, HCAHPS scores, and payer mix determine whether the next dollar clears more from acquisition or retention.
The financial case is no longer symmetric
For most of the past two decades, healthcare marketing budgets treated patient acquisition and retention as parallel lines on the same spreadsheet. That symmetry no longer holds. The financial machinery underneath a multi-location operator has been rewired by value-based payment scoring, experience-linked margin data, and continuity research that ties clinical performance directly to revenue mix.
Acquisition still buys something real: a first visit, a filled appointment slot, a foothold in a new geography. However, the dollar that wins a new patient does not, by itself, produce lifetime value. It creates an opportunity that the rest of the operation must convert. Retention is the conversion engine, and the evidence supporting its financial weight has thickened considerably. Patient-reported experience now correlates with higher future revenue, a richer elective mix, and lower costs in hospital data 10. Continuity of care is associated with lower mortality, fewer hospital visits, and stronger adherence 1, 6. Hospital Value-Based Purchasing ties Medicare reimbursement directly to experience and outcome measures that retention systems are built to move 4.
The question for a CMO accountable to a CFO is no longer whether to fund both, but how to weight them given that one feeds the other. The sections that follow treat acquisition and retention as asymmetric financial instruments with different ROI profiles, different time horizons, and different exposure to value-based contracts.
What each lever actually buys a multi-location operator
Acquisition: capacity fill, market entry, and panel churn replacement
Acquisition spend buys three discrete operational outcomes, and conflating them is the first place ROI analysis breaks down:
- The first is capacity fill: paid demand generation that converts unused chair time, OR blocks, or appointment slots into billable encounters.
- The second is market entry, where a new location or service line needs a patient base built from zero because there is no existing panel to draw from.
- The third is panel churn replacement, the steady-state requirement of replacing patients lost to relocation, insurance changes, life events, or dissatisfaction.
Each of these has a different ROI profile. Capacity fill produces the fastest payback because the fixed cost base is already absorbed; every incremental visit contributes near-marginal revenue. Market entry has the longest payback horizon and the highest unit acquisition cost, because the operator is buying both a patient and a brand presence in a market that does not yet recognize the practice. Churn replacement is the most operationally diagnostic of the three: a location burning through acquisition spend just to hold panel size flat is signaling a retention failure, not a marketing success.
At the system level, the acquisition budget should be decomposed into these three buckets before any comparison to retention spend is meaningful. A consolidated CAC figure averaged across 20+ locations hides which sites are using paid demand to grow and which are using it to compensate for leaks. The panel size and continuity literature reinforces this: workflow design at the location level determines whether new patients stay long enough to repay their acquisition cost 2.
Retention: three financial levers pulled at once
Retention does not produce a single ROI number because it is not a single instrument. It pulls three financial levers in parallel, and the compounding effect is what separates it from acquisition on the spreadsheet.
The first lever is margin. Deloitte's analysis of U.S. hospital data found that facilities with "excellent" HCAHPS ratings averaged 4.7% net margin compared with 1.8% at hospitals rated "low," and that a 10-point increase in top-box ratings was associated with a 1.4 percentage point lift in net margin 11. The study is correlational and the authors flag unmeasured confounders, but the association held across model specifications and the directional signal is the operative point for budget defense: experience scores, which retention systems are built to move, sit on the same line item as net margin.
The second lever is revenue mix. A 2023 hospital-data analysis found that better patient-reported experience was associated with a higher proportion of elective patients, higher revenue, and lower costs in the periods that followed 10. Elective volume is the highest-contribution revenue most multi-location operators have access to, and it responds to the same loyalty and reputation dynamics retention programs are designed to produce.
The third lever is utilization. Interpersonal continuity in primary care is associated with lower total healthcare costs, fewer emergency visits, and more appropriate use of services 8. For operators carrying value-based or capitated contracts, that reduction in inappropriate utilization flows directly to the bottom of the P&L. For fee-for-service lines, it shows up as better adherence, fewer no-shows, and a healthier panel that supports higher-acuity case mix.
None of these levers operates in isolation. Margin lift from experience improvement feeds the budget that funds continuity infrastructure; continuity reduces utilization waste, which improves cost-side performance on value-based contracts; better contract performance funds more retention investment. Acquisition spend does not produce this loop on its own. It produces the patient, and the retention system decides whether that patient becomes lifetime value or a one-visit cost center. AHRQ's synthesis of the experience-to-outcomes evidence makes the same point in clinical terms: experience drives adherence, preventive uptake, and lower malpractice exposure, all of which carry direct financial weight 5.
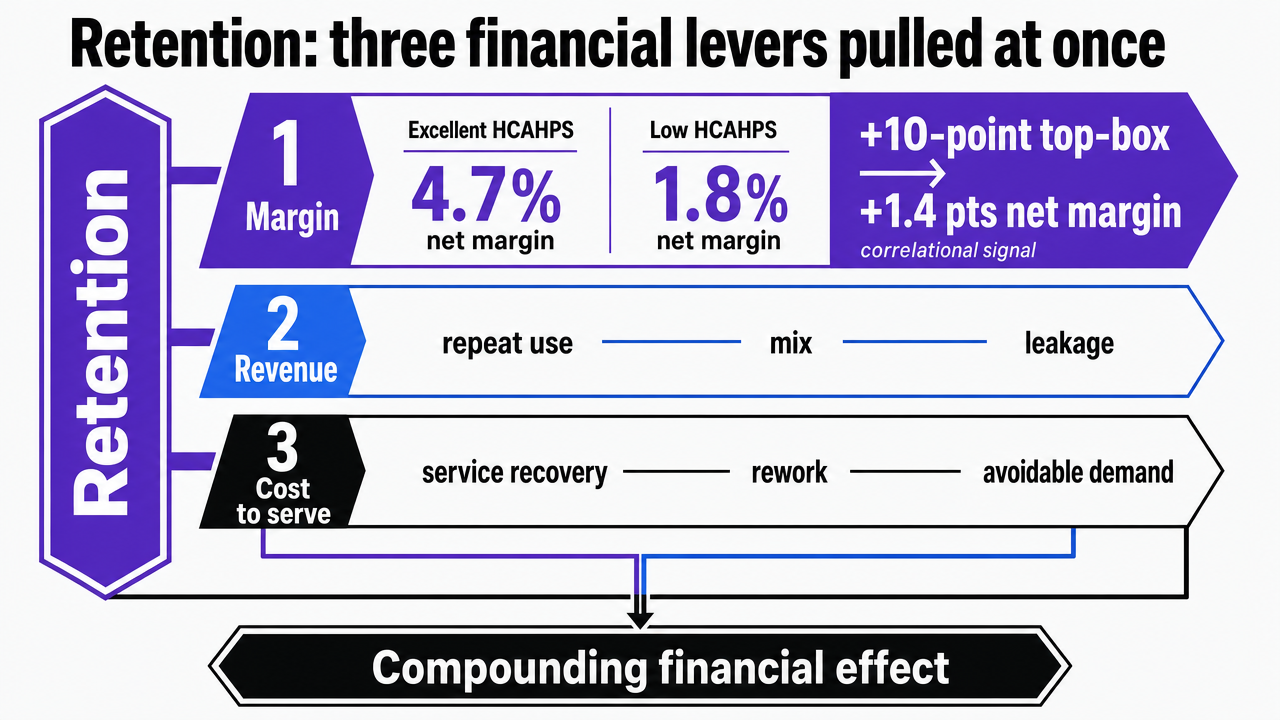 Visualize the three parallel financial levers retention pulls, anchored to the Deloitte HCAHPS-to-margin figures cited in the prose so the numbers in the visual match the article text
Retention-adjusted CAC: why acquisition ROI cannot stand alone
Acquisition cost figures reported in isolation describe what an operator paid to produce a first visit. They do not describe what that first visit was worth. The gap between those two numbers is the retention system, and any CAC reported without it is closer to a unit-cost metric than an ROI metric.
Consider what happens after the booked appointment. Interpersonal continuity in primary care is associated with lower total healthcare costs, fewer emergency visits and hospitalizations, and more appropriate use of services 8. The same body of evidence ties higher continuity to greater adherence to medical advice, higher uptake of health promotion, and higher patient satisfaction 6. Those three operational metrics are the difference between a patient who returns for follow-up care, refers a family member, and shows up on the elective schedule, and a patient who absorbed an acquisition cost and produced one billable encounter.
A retention-adjusted CAC pulls those continuity effects into the same calculation. The arithmetic is straightforward: divide reported acquisition cost not by first-visit revenue, but by the expected revenue across the continuity window the operator is actually delivering at that location. Two practices reporting an identical $180 CAC produce very different ROI when one converts 70% of new patients into a returning panel and the other converts 30%. The CAC line item looks identical on the marketing dashboard. The financial reality is not.
For multi-location operators, this reframing has a specific operational consequence. Acquisition reporting at the system level should be paired with continuity and return-visit data at the location level, because the variance lives there. A site with weak continuity inflates its effective CAC even when its paid media performance looks efficient, because each acquired patient produces a shorter revenue tail. The panel size and continuity literature reinforces the point: retention is a function of workflow, scheduling, and clinician assignment, not advertising creative 2.
The implication for budget defense is direct. Acquisition ROI presented to a CFO without the retention multiplier overstates marketing efficiency at high-continuity sites and understates the cost of weak continuity at struggling ones. Reporting CAC alongside a continuity-adjusted lifetime estimate, drawn from actual return-visit rates and the cost and utilization patterns documented in the continuity research 8, gives the finance team a number that reflects what the acquired patient is worth, not just what the click cost.
Measure Acquisition and Retention ROI With Live Data
Test real-world strategies for balancing patient acquisition and retention to see measurable impact across your locations.
Value-based payment exposure shifts the math
Once a portion of revenue is tied to Medicare's Hospital Value-Based Purchasing program or any downstream commercial contract built on similar mechanics, the acquisition-versus-retention comparison stops being a marketing question and becomes a payer-mix question. CMS adjusts hospital payments based on Clinical Outcomes, Safety, Person and Community Engagement (which carries HCAHPS experience measures), and Efficiency and Cost Reduction 4. Three of those four domains move primarily on the retention side of the ledger. Acquisition spend does not, by itself, change a single VBP score.
That asymmetry compounds across contract structures. The systematic review of U.S. Medicare value-based programs documents how Hospital VBP, the Hospital Readmissions Reduction Program, and the Hospital-Acquired Condition Reduction Program each tie payment to quality, safety, and experience measures that respond to continuity, follow-up, and longitudinal engagement 3. An operator with meaningful VBP exposure is being paid, in part, for the things retention infrastructure produces: experience scores, appropriate utilization, and reduced readmissions. The same operator is being penalized for the gaps a weak retention system leaves behind.
Chronic care lines sharpen the point further. Simulation modeling of chronic disease management programs shows that sustained engagement and adherence generate positive ROI over time through reduced complications and avoided healthcare use, with the size of the return depending on behavioral effectiveness and program design 9. Those returns are unavailable to an operator whose chronic patients churn before the engagement program has time to work.
The same systematic review flags a caution worth holding: VBP adjustments can disadvantage hospitals serving populations with higher social risk, which means the ROI on experience and retention investment is not uniform across a multi-location footprint 3. Sites with payer mixes more exposed to VBP penalties have a higher marginal return on retention spend than sites operating predominantly on commercial fee-for-service. Allocation decisions made at the system level without that location-by-location exposure data will systematically over-fund acquisition where retention would clear more dollars per marketing budget.
Panel economics at the location level
At the individual location level, retention either compounds or collapses, and the unit of analysis is the panel. A 2025 meta-narrative review of primary care panel size found that smaller panels were associated with improved patient satisfaction, better continuity of care, and more health promotion activity, while evidence on clinical outcomes and costs remained mixed 2. The same review flagged a constraint that matters for any operator weighing acquisition spend against retention investment: shrinking panel size without redesigning workflow is not financially sustainable. Continuity is a workflow output, not a marketing output.
That distinction reframes where retention dollars actually do their work. A panel sized to allow each clinician time for follow-up, message response, and longitudinal management produces the continuity that drives the utilization patterns documented elsewhere in the literature: fewer emergency visits, lower total cost of care, and stronger adherence 8. A panel sized purely for access throughput produces the opposite, regardless of how much is spent on patient communication tools or experience surveys layered on top.
For a CMO running 20+ locations, the operational consequence is that retention ROI varies more by site-level panel design than by system-level marketing program. Two locations with identical patient experience platforms and identical acquisition budgets will produce different lifetime values if one has clinicians carrying panels engineered for continuity and the other has clinicians carrying panels engineered for volume. The marketing line item cannot fix the second case. Continuity-aware scheduling, clinician-patient assignment logic, and workload calibration can.
This is also where the panel review's caution about workflow redesign becomes a budget allocation question. Reducing panel size to improve satisfaction and continuity raises per-patient cost unless paired with care team restructuring, asynchronous visit capacity, or scope redistribution to non-physician roles 2. Operators who treat retention as a marketing investment alone tend to fund the visible layer (reputation management, patient portals, experience surveys) while leaving the panel mechanics that actually move continuity scores untouched. The result is retention spend that produces survey activity without producing the longitudinal revenue the spend was meant to defend.
The practical takeaway for system-level allocation is that retention budgets should be evaluated against panel-level continuity metrics, not against system-wide CAC averages. A location producing strong continuity numbers can absorb more acquisition spend efficiently, because new patients arrive into a system engineered to keep them. A location producing weak continuity numbers needs panel and workflow investment before incremental acquisition spend will clear its cost.
See How Leading Healthcare Marketers Quantify ROI from Patient Acquisition and Retention
Request a data-driven analysis tailored to your organization’s patient acquisition and retention mix—benchmark your ROI against multi-location healthcare leaders using advanced marketing automation insights.
Where acquisition still wins decisively
Retention dominates the long-horizon math, but three operational situations flip the comparison and make acquisition the higher-return use of the next marketing dollar.
The first is new location launch. A site opening without an established panel has no continuity to defend and no experience scores to move. Until base volume exists, the financial levers that retention pulls (margin lift tied to HCAHPS performance, elective mix expansion, utilization efficiency) have nothing to act on 10, 11. Acquisition spend at this phase is not competing with retention; it is building the substrate retention will later operate on. The same logic applies to a new service line within an existing footprint, where referral patterns and clinician awareness need to be built before a longitudinal relationship is possible.
The second is capacity fill at sites with absorbed fixed costs. When a location has unused appointment blocks, OR time, or chair hours, the incremental visit carries near-marginal contribution. Acquisition spend that converts that unused capacity clears its cost faster than any retention intervention can, because retention compounds across time while capacity fill cashes in the same week. Operators carrying chronic disease management programs should still weigh that fast payback against the longer ROI tail that sustained engagement produces in those populations 9.
The third is panel churn replacement driven by exogenous factors: employer insurance changes, regional relocation patterns, or demographic shifts the practice did not cause and cannot fix through experience improvement. Continuity workflow redesign will not retain a patient whose employer dropped the network 2. Acquisition spend at these sites is defensive maintenance of panel size, and underfunding it produces revenue decline that no retention program can offset.
An allocation framework for system-level CMOs
If you manage multiple locations: a variable spend model
System-level allocation cannot be set as a fixed acquisition-to-retention ratio because the variables that move ROI sit at the location level. A more defensible model strips the decision down to inputs a CMO already has and applies them per site, then rolls the result up to a budget.
The variables are operator-supplied where the operator owns the data, and sourced where the literature provides the directional weight. Operator inputs: site-level new-patient acquisition cost, return-visit rate, panel size, HCAHPS top-box score, payer mix, and VBP exposure. The financial weights attached to changes in those variables come from the evidence base:
- A 10-point HCAHPS top-box improvement is associated with roughly a 1.4 percentage point lift in net margin 11.
- Higher experience scores correlate with a richer elective mix and lower costs 10.
- Higher interpersonal continuity is tied to lower total cost of care and fewer emergency visits 8.
The framework below holds dollar figures as variables rather than fabricating benchmarks. CMOs plug in the operator inputs; the sourced weights determine direction and relative magnitude.
| Allocation input | Source of value | Directional weight on ROI |
|---|---|---|
| Site-level new-patient CAC | Operator-supplied (paid media, intake costs) | Defines floor for acquisition payback math |
| Return-visit rate per site | Operator-supplied (EHR, scheduling) | Converts CAC into retention-adjusted CAC |
| HCAHPS top-box score | Operator-supplied (CAHPS results) | ~1.4pp margin lift per 10-point improvement 11 |
| Elective mix shift | Operator-supplied (case-mix data) | Higher experience tied to higher elective share 10 |
| Continuity index per panel | Operator-supplied (visit attribution) | Lower utilization waste, fewer ED visits 8 |
| VBP exposure by payer mix | Operator-supplied (contract data) | Three of four VBP domains move on retention side 4 |
The output is not a single percentage split. It is a per-site recommendation that funds acquisition where capacity, market entry, or churn replacement clears the cost, and funds retention infrastructure where margin lift, elective mix, and utilization savings produce a larger return per marketing dollar. Rolled up across 20+ locations, the system-level ratio is an artifact of the location-level math, not an input to it.
Scenario calls: mature footprint, new launch, declining panel
Three operator scenarios sharpen the framework into concrete calls.
Mature footprint. : At a site with stable panel size, established referral patterns, and meaningful VBP exposure, retention spend produces the higher return. The financial levers are already loaded: experience scores move margin 11, continuity moves utilization 8, and chronic care engagement programs accumulate ROI across the panel's longitudinal revenue 9. Acquisition spend at these sites should be calibrated to churn replacement, not growth.
New location launch or new service line. : The scenario inverts. No panel exists to defend, no HCAHPS history exists to improve, and no continuity has accrued. Acquisition spend builds the substrate that retention will later operate on, and underfunding it delays the point at which the retention levers can produce any return at all. The allocation here is acquisition-heavy until base volume crosses the threshold where experience and continuity infrastructure has a panel to act on.
Declining panel. : The diagnostic question comes first: is the decline exogenous (employer insurance shifts, regional demographics) or endogenous (weak continuity, poor experience scores, workflow gaps)? Exogenous declines call for defensive acquisition spend to hold panel size. Endogenous declines call for retention and workflow investment, because additional acquisition spend at a site with weak continuity inflates effective CAC without producing lifetime value 2. Misreading the cause is the most expensive allocation error in this scenario, because the wrong lever produces motion without return.
Across all three, the call is made at the site, not the system. The system-level budget is what those calls add up to.
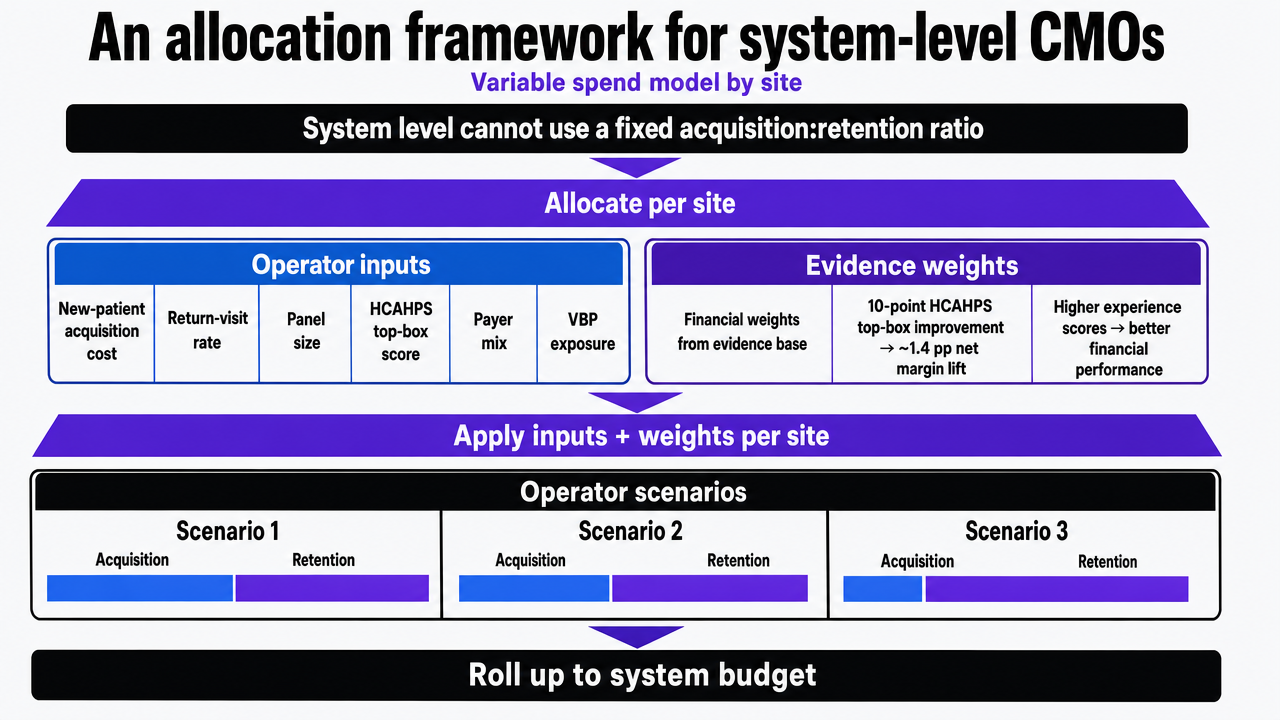 Translate the article's per-site allocation framework into a decision flow infographic that mirrors the table inputs and the three operator scenarios, since this section explicitly describes an operating model
Frequently Asked Questions
References
- 1.Primary medical care continuity and patient mortality: a systematic review.
- 2.Determining Patient Panel Size in Primary Care: A Meta-Narrative Review.
- 3.Hospital value-based payment programs and disparity in the United States: a systematic review.
- 4.Hospital Value-Based Purchasing.
- 5.Section 2: Why Improve Patient Experience?.
- 6.Continuity of care with doctors—a matter of life and death? A systematic review of continuity of care and mortality.
- 7.Explaining the Service-Profit Chain: How Quality Drives Profit.
- 8.The Impact of Interpersonal Continuity of Primary Care on Health Outcomes and Healthcare Use.
- 9.Modeling ROI in chronic disease management: a simulation-based approach.
- 10.Patient-reported experience is associated with higher future revenue and lower costs in hospitals.
- 11.The value of patient experience: Hospitals with better patient-reported experience perform better financially.