
Key Takeaways
- Agencies that optimize toward platform-reported conversions often scale spend on traffic that would have converted anyway; rolling geographic or audience holdouts produce an incrementality coefficient to recalibrate bidding against real pipeline.
- Relying on Google's audience controls as quality filters lets Smart Bidding chase free-tier seekers, competitors, and unqualified leads; advertiser-side suppression and stage-weighted value signals force the loop to learn the right audience.
- Pixels, consent strings, and remarketing pools drift silently after onboarding, exposing programs to FTC penalties of $43,792 per violation per day 4; treat tracking as live infrastructure with monthly tag, consent, and lineage audits.
- Bold creative claims that win on CTR become liabilities when substantiation is requested; gate every variant on a documented evidence record before the bidding system scales it, per FTC Health Products Compliance Guidance 6.
- Budget pacing graphs, impression share, and utilization charts are account hygiene, not optimization; an agency that never underspends to reallocate toward a productive test is administering the account rather than learning from it.
- Default agency decks omit CRM-stage reconciliation, disqualified-lead scoring, and creative substantiation status; if platform-performance slides outnumber pipeline-performance slides two to one, build the joined ad-and-CRM report yourself.
- Test cadences fail when too many variants run against thin traffic or a single quarterly refresh lacks a holdout; replace the calendar with a queue requiring pre-registered hypotheses, effect sizes, and exposure windows before launch.
Where Paid Search Budgets Actually Leak
Most paid search waste does not originate where teams typically look. Bid inefficiency and weak ad copy are visible and easy to audit, but rarely represent the largest leaks. The most expensive failures are upstream, embedded in the measurement architecture that defines a conversion, assesses its incrementality, and dictates how that signal informs the bidding system an agency operates.
A Wharton/LDI study on hospital advertising highlights this issue: a 10% increase in regional hospital ads led to approximately nine additional admissions per 100,000 Medicare beneficiaries and about $3.3 million in extra annual Medicare spending in an average market 1. While paid media increased volume, the marginal acquisitions were not necessarily high-quality or incremental. This pattern is also observed in SaaS pipelines, where reported conversions may rise, but pipeline efficiency remains stagnant.
The following seven mistakes are framed as measurement failures, each with a detection signature a demand generation manager can identify using tools like GA4, Search Console, or ad platforms. These are then matched with continuous testing strategies required to neutralize them.
Optimizing Toward Platform-Reported Conversions Instead of Incremental Pipeline
The most costly mistake in paid search is often the least visible: agencies optimize bidding algorithms based on the conversion column reported by the platform, then treat the resulting CPA as a performance metric. Google Ads counts a conversion when a user who saw or clicked an ad completes a tracked action. It does not determine if that action would have occurred organically, through direct navigation, or via an existing sales-led touch. Smart Bidding then prioritizes audience segments that generate the most of these claimed conversions, irrespective of whether the underlying pipeline was incremental.
The Wharton/LDI hospital advertising study exemplifies this discrepancy. A 10% increase in regional hospital ads, representing about 150 additional impressions, resulted in roughly nine additional admissions per 100,000 Medicare beneficiaries and an estimated $3.3 million in extra annual Medicare spending in an average market 1. While paid media drove volume, the additional admissions were not always the most appropriate patients. A similar dynamic occurs in SaaS funnels when reported conversions increase for branded and bottom-funnel queries that would have converted without paid intervention.
Detection involves looking for three specific patterns:
- Branded search conversions that scale linearly with branded impression share even as organic branded clicks decline by a similar volume.
- Target CPA campaigns that concentrate spend into a shrinking set of audiences while overall pipeline-sourced revenue remains flat quarter-over-quarter.
- A widening gap between platform-reported conversions in Google Ads and pipeline-stage progression in the CRM, filtered to paid-search first touch.
The continuous-test response involves running geographic or audience holdouts on an ongoing basis, rather than as one-off experiments. By holding out 10% to 15% of eligible inventory and comparing pipeline creation in the held-out cohort against the exposed cohort, an incrementality coefficient can be generated. This coefficient then calibrates the bidding system. Without it, the optimization loop pursues a metric that may not reflect true business growth.
Letting Platform Targeting Substitute for Audience-Quality Controls
Platform targeting determines who sees an ad, but not necessarily who should. When agencies rely solely on Google Ads audience controls, in-market segments, and keyword match types as sufficient quality filters, the bidding system will spend on any traffic that converts on the configured event, even if the advertiser would deem those audiences unsuitable upon closer inspection.
The Harvard Misinformation Review documented an extreme instance of this failure, estimating that alternative cancer clinics spent approximately $15,839,504 on Google Ads targeting sensitive cancer-related queries, often promoting treatments lacking scientific evidence 3. For a demand generation manager, the lesson is not that SaaS campaigns face identical ethical risks, but that platform-native targeting alone allowed significant spend on a vulnerable, low-quality audience without advertiser intervention. The same permissiveness applies to any account that delegates audience suitability to the platform.
In SaaS paid search, this waste manifests as spend concentrated on job titles, intent signals, or query clusters that convert at the configured event but fail to produce qualified pipeline. Individuals such as free-tier seekers, competitor researchers, students, and offshore agencies can register as conversions for events like demo requests or content downloads. Smart Bidding then scales these segments.
The detection signature is found in the search terms report and the CRM. Demand generation managers should look for:
- Search terms that consistently generate form fills but never advance past the SQL stage.
- Geographic clusters where conversion volume increases without a corresponding rise in opportunity creation.
- A growing share of impressions from broad match expansions not authorized by the keyword list.
Cross-referencing the platform's conversion leaders against CRM-stage progression (filtered by paid-search first touch) typically reveals these mismatches quickly.
The continuous-test response involves advertiser-side suppression and intent-grading, rather than just improved keyword research. Negative audience lists derived from disqualified-lead exports, value-based bidding informed by stage-weighted revenue signals instead of just form fills, and regular search-term audits that remove converting-but-unqualified queries each week compel the optimization loop to learn based on the audience the business truly desires. Without these controls, agencies acquire whatever audience the platform identifies as a converter.
Treating Tracking and Consent as Setup Tasks, Not Live Infrastructure
Conversion pixels, consent banners, and remarketing audiences are often configured once during onboarding and then left to drift. Agencies assume stability because no errors are reported, and platforms continue optimizing based on the incoming signal. Neither party may notice tag version changes, consent strings failing on certain pages, or remarketing pools inadvertently capturing visitors who haven't authorized their use.
The financial exposure is real. The FTC has stated that violations of the Health Breach Notification Rule can incur penalties of $43,792 per violation per day, and unauthorized disclosures of health-related data to advertisers may qualify 4. SaaS programs handling sensitive user information (e.g., health, financial, workforce data) are often closer to this rule's scope than many demand generation teams realize. The FTC's guidance on consumer health information explicitly states advertiser obligations: consent must be "meaningful, informed, and not the product of deceit or coercion," with clear disclosure of data usage and any financial benefits from sharing it 5.
Detection is mechanical. Demand generation managers should perform three monthly checks:
- A tag-version differential against the last known-good configuration.
- A consent-string sampling audit to confirm the recorded consent state matches what was transmitted downstream.
- A remarketing-list lineage report detailing which page templates and event triggers populated each audience.
Drift in any of these indicates that the optimization signal feeding bids no longer aligns with the disclosure the user actually received.
The continuous-test response is to manage tracking as live infrastructure, with the same monitoring rigor as a production database. This includes scheduled synthetic conversion events, automated alerts for significant shifts in consent-acceptance rates, and quarterly lineage reviews for all remarketing pools to ensure signal integrity. A "setup-and-forget" approach is a source of waste.
Eliminate Wasted Ad Spend With Autonomous Optimization
Test real campaigns risk-free and see measurable improvement in PPC efficiency before making any commitment.
Scaling Claim-Driven Creative That Cannot Survive Substantiation
Creative testing often leads to a trap: the ad variant with the boldest claim achieves high CTR and conversion rates, the bidding system scales it, and the resulting volume becomes legally indefensible when evidence is requested. The waste isn't that the ad fails, but that it succeeds, attracts significant spend, and then either must be pulled mid-campaign or carries enforcement risk that retroactively renders the entire campaign's CPA a sunk cost.
The FTC's Health Products Compliance Guidance (2022) mandates that advertisers possess "competent and reliable scientific evidence" for health-related claims, and qualified claims require "clear and conspicuous" disclosures 6. This principle extends beyond healthcare. Any SaaS category involving outcomes, savings figures, performance improvements, security postures, or workforce results faces a similar substantiation standard under the FTC Act. An ad promising a quantified result that the product cannot reliably demonstrate with evidence is not a creative win; it's a contingent liability treated as a success.
The detection signature is a divergence between creative performance and substantiation depth. Demand generation managers should flag any ad variant where the headline or description includes a numeric outcome, comparative claim, or category superlative that lacks a documented evidence file from product marketing or legal. Another sign is a creative refresh cadence that introduces new claims faster than the substantiation review process can clear them, often resulting in a backlog of paused ads or last-minute copy rewrites before launch.
The continuous-test response is to gate creative tests based on substantiation status, not just platform approval. Variants should only enter rotation with a linked evidence record. The optimization loop should measure not only conversion lift but also claim durability across geographies and segments. Scaling a winning ad without this gate can generate volume that the program may later have to forfeit.
Confusing Budget Pacing With Optimization
Budget pacing is a hygiene factor, not optimization. The two are often conflated in agency reporting because pacing is easily charted, explained in monthly calls, and claimed as an achievement. Spending the full monthly budget evenly, hitting target impression share without overspending, and avoiding end-of-month dark periods are all aspects of account management. None of these actions inherently determine whether the budget generated incremental pipeline.
The basic mechanics are straightforward. A peer-reviewed guide for private practice illustrates this with a $900 monthly budget equating to roughly a $30 daily cap 2. This is simple arithmetic an in-house coordinator can manage. When an agency highlights pacing graphs in a quarterly review, the demand generation manager is paying retainer fees for basic calculations.
The detection signature is a reporting deck where pacing variance, impression share, and budget utilization are more prominent than incrementality tests, search-term quality, or CRM-stage progression. Another sign is the absence of deliberate underspending. An optimization loop that never pauses a campaign to reallocate budget to a successful test is not learning; it is merely administering.
The continuous-test response is to treat pacing as a constraint the system respects, not a goal it optimizes toward. The optimization layer should have the flexibility to underspend a budget if no productive test is ready to absorb the funds.
Accepting Agency Reporting Templates as the Source of Truth
Agency reporting decks are not neutral. They offer a curated view of the account, built from default platform columns and shaped by what the agency wants to discuss in quarterly reviews. When a demand generation manager treats this deck as the ultimate source of truth, the conversation narrows to what the template emphasizes: impression share, average CPC, conversion volume, and a CPA derived from platform-reported conversions. The columns omitted from the template are typically those that would reveal waste.
Three key omissions are common:
- A lack of reconciliation between platform-reported conversions and CRM-stage progression filtered by paid-search first touch. Without this, the deck reports demand the platform claims to create, not pipeline the business recognizes.
- Search-term quality is often scored against click-through rate instead of disqualified-lead exports. A converting search term that only produces unqualified leads still appears healthy in the default view.
- Creative-level substantiation status is frequently absent, despite the FTC's Health Products Compliance Guidance treating it as a prerequisite for claim-driven ads 6. A reporting template that scales a winning headline without flagging its evidence record is selling volume that the program may later have to retract.
The detection signature is the deck itself. A demand generation manager should count how many slides discuss platform performance versus pipeline performance. If the ratio exceeds two to one, the template is dictating the truth, and that truth is likely incomplete. The continuous-test response is to create the report the agency doesn't, joining ad-platform data with CRM-stage data weekly, and making this combined view the primary artifact for quarterly reviews.
Stop Letting Agency Oversights Drain Your PPC Budget
See how autonomous PPC management detects wasted spend and runs continuous optimization—eliminating the manual gaps that cost enterprise brands and agencies thousands in missed ROI.
Running a Test Cadence the Optimization Loop Cannot Learn From
A test cadence is the learning unit in a paid search program. An incorrect cadence leads to motion without information, with agencies reporting activity instead of insight. Two common patterns emerge:
- Too many tests run in parallel against insufficient traffic, preventing any variant from reaching statistical significance before the next round begins.
- A single quarterly creative refresh is treated as the sole test event, lacking a holdout structure to attribute changes effectively.
Both patterns share a fundamental flaw: the optimization loop cannot link a measured outcome to a specific change, leading the bidding system to interpret noise as signal. Demand generation managers should look for tests that lack a pre-registered hypothesis, a defined exposure window, and a holdout cohort large enough to detect the intended effect size. If these three elements are not specified in the test brief before a variant goes live, the results will be uninterpretable.
The continuous-test response is to implement a queue, not a calendar. Hypotheses enter the queue with a target effect size and estimated traffic requirements; tests launch when the next item in the queue has sufficient inventory to resolve. This discipline, more than any individual creative win, is what drives cumulative learning.
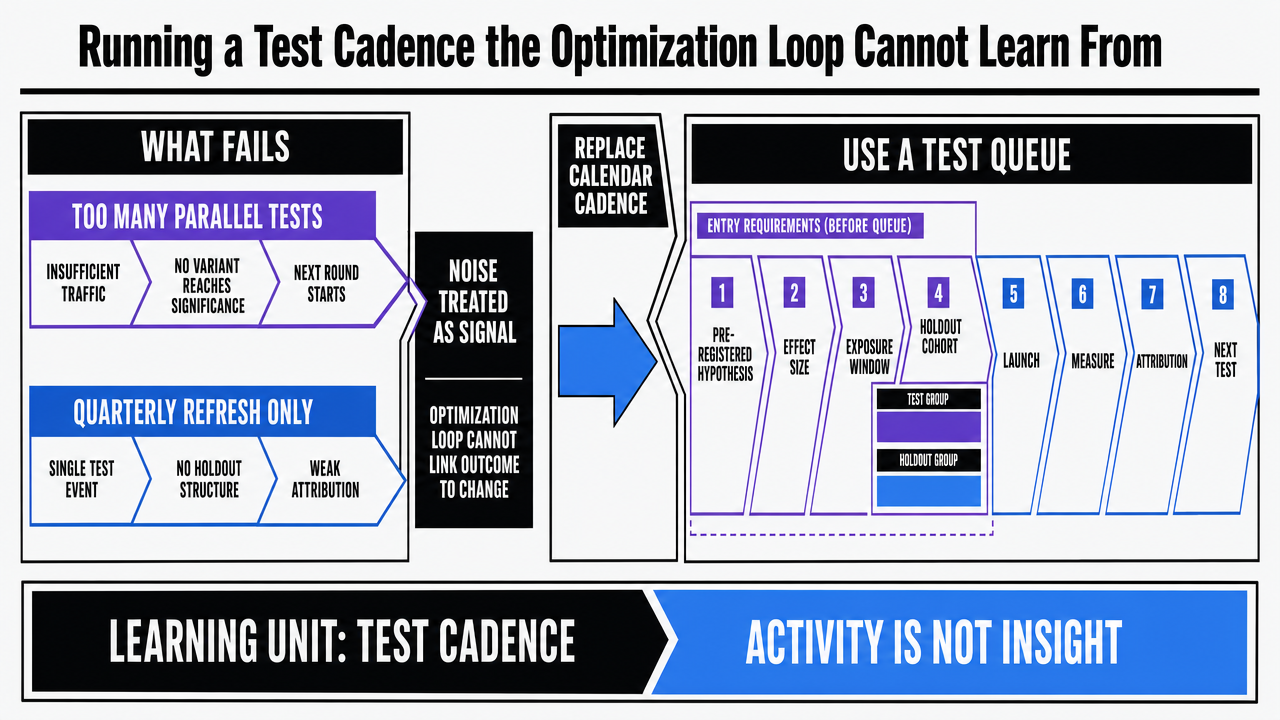 Translate the section's prescription (replace a calendar cadence with a queue requiring pre-registered hypothesis, effect size, exposure window, and holdout cohort) into a visual workflow so readers can see the operating model the article advocates
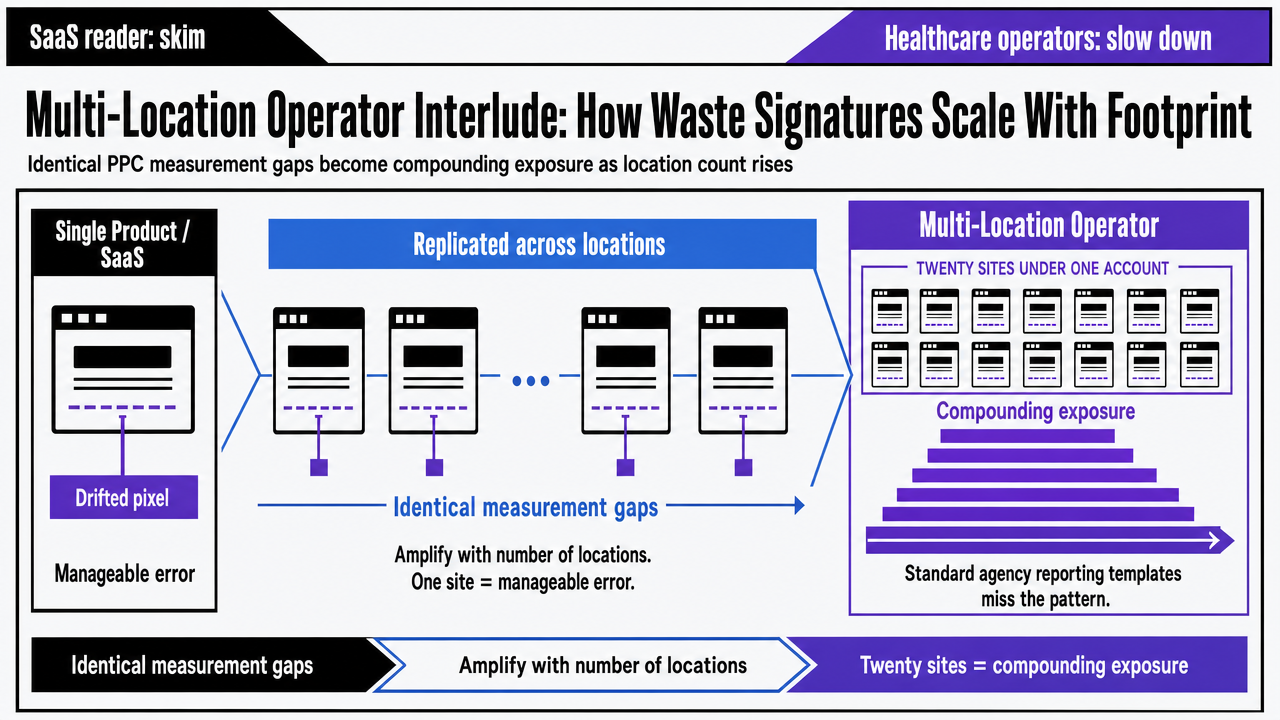
Multi-Location Operator Interlude: How Waste Signatures Scale With Footprint
When the SaaS Reader Should Skim and Healthcare Operators Should Slow Down
The next three sections are tailored to different audiences. A SaaS demand generation manager overseeing paid search for a single product can skim this interlude and rejoin in the closing section. However, operators managing paid acquisition across multiple locations—typically multi-location healthcare groups, but also franchises or practice portfolios—should pay close attention.
The reason for this distinction is structural. Every measurement gap discussed previously in this article amplifies with the number of locations linked to an account. A drifted pixel on one site is a manageable error. The same drift replicated across twenty sites becomes a compounding exposure that standard agency reporting templates are not designed to detect.
Waste Exposure at 1, 5, and 20 Locations
Two variables help quantify footprint exposure without needing new benchmarks. First, the per-location daily PPC baseline: a peer-reviewed digital marketing guide for private practice suggests a $900 monthly budget translates to roughly $30 per day 2. This isn't a recommendation, but a floor for minimal management at a single site. Second, regulatory exposure: the FTC states that Health Breach Notification Rule violations carry penalties of $43,792 per violation per day, which can apply to unauthorized health data disclosures to advertisers 4.
Combining these variables across different footprint sizes reveals how identical measurement gaps escalate into vastly different financial scenarios:
| Footprint | Baseline Daily PPC Spend | Annualized Baseline PPC | Per-Day Fine Exposure if Tracking Drifts |
|---|---|---|---|
| 1 location | $30 | $10,950 | $43,792 |
| 5 locations | $150 | $54,750 | $218,960 |
| 20 locations | $600 | $219,000 | $875,840 |
This table is not a forecast, but a scope translator. For a single location, a misfiring consent string is a fixable bug, with a worst-case daily exposure still below an entry-level annual ad budget. At twenty locations, the same bug creates a per-day exposure that exceeds the entire annual baseline PPC spend for the footprint, compounding daily until detected. The same scaling applies to other non-regulatory waste signatures. A 2-point conversion-rate drift from a broken pixel, an unauthorized remarketing pool, or unsubstantiated creative all multiply with the number of locations. While agency reports may treat each site as a row in a rollup, the actual exposure aggregates far less politely.
Why System-Wide Healthcare Waste Context Matters Here, and Where It Stops Applying
One crucial piece of context belongs specifically in this interlude. Aggregate estimates for wasteful U.S. medical care spending range from $600 billion to over $1.9 trillion annually, or roughly $1,800 to $5,700 per person 8. This figure represents system-wide medical waste, not PPC waste, and conflating the two would misinterpret the source. It's mentioned here because healthcare operators acquire patients into a delivery system already burdened by waste at this scale. PPC waste at the acquisition stage compounds into utilization waste downstream, a dynamic hinted at by the Wharton/LDI hospital advertising findings earlier in the article.
This logic does not directly apply to standard B2B SaaS pipelines. SaaS readers rejoining in the next section should view this interlude as a stress test of the article's measurement thesis, rather than evidence that PPC waste in their own programs reaches trillion-dollar scales.
 Visualize how identical PPC measurement gaps scale into dramatically different financial exposure as the number of locations increases, directly supporting the comparison table cited in this section
Returning to the SaaS Demand Gen Manager: What the Optimization Loop Must Continuously Test
For the demand generation manager running paid search across multiple products, segments, or geographies, the seven mistakes previously identified share a common structural property: they persist in accounts where the optimization loop tests the wrong variables at an inappropriate cadence. A bidding system that learns from platform-reported conversions, platform-scoped audience signals, and pacing reports designed for monthly reviews will inevitably converge on whatever metric it measures, even if that metric deviates from true pipeline value.
The optimization loop must continuously test four critical areas, not just quarterly:
- First, incrementality, through rolling geographic or audience holdouts that generate a fresh coefficient to calibrate the bidding system.
- Second, audience suitability, via stage-weighted revenue signals and disqualified-lead suppression that retrain Smart Bidding to target the pipeline the business truly desires.
- Third, tracking integrity, using synthetic events, consent-string sampling, and remarketing-lineage reviews treated as production monitoring, not one-time onboarding tasks.
- Fourth, claim durability, enforced by a substantiation gate that prevents the optimization loop from scaling creative that the program may later have to retract.
None of these critical functions operate effectively on a monthly retainer cadence. The detection signatures highlighted throughout this article emerge within days, not quarters, and they compound while agency reporting templates prioritize pacing and impression share. The key question is whether a program has a dedicated layer that monitors for these signatures at the frequency they actually appear.
Vectoron provides this layer as a continuous strategy and execution program at the account level, offering an alternative to the traditional retainer-and-account-manager model that often perpetuates these mistakes.
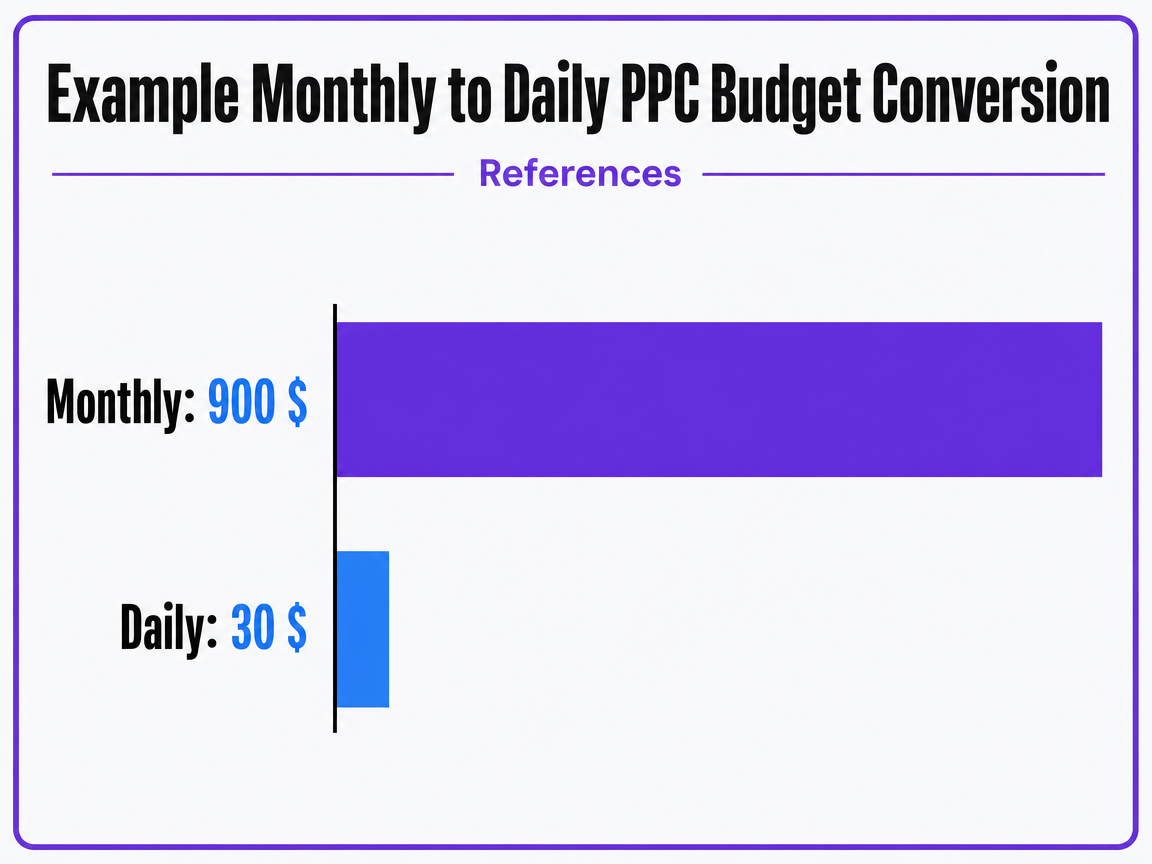 Example Monthly to Daily PPC Budget Conversion
An illustrative example of how a monthly advertising budget for a medical practice is broken down into a daily spending cap.
Frequently Asked Questions
References
- 1.Hospital Ads Increased ER Visits and Medicare Spending, Innovative LDI Study Says.
- 2.Digital Marketing for Private Practice: How to Attract New Patients.
- 3.Google allows advertisers to target the sensitive informational queries of cancer patients.
- 4.FTC warns health apps to comply with health data-breach rules.
- 5.Collecting, Using, or Sharing Consumer Health Information? Look to HIPAA, the FTC Act, and the Health Breach Notification Rule.
- 6.Health Products Compliance Guidance.
- 7.Advertising in health and medicine: using mass media to marketing health services.
- 8.Excess Medical Care Spending: The Categories, Magnitude, and Opportunities for Reallocation.
- 9.A Guide to Advanced Digital Strategies.
- 10.Promoting Research on Marketing in the Healthcare Sector.