
Key Takeaways
- Define a clear pre-intervention baseline tied to a specific metric, measurement window, and data source, because finance committees reject extrapolated quarters or blended system-wide numbers that hide site-level variance 5.
- Build a full intervention cost stack covering licenses, implementation labor, ongoing operating costs, and diverted internal capacity, since understated denominators are the most common reason cases collapse under review 11.
- Construct a monetized benefit chain that links the operational metric, conversion rule, and attribution factor, so each dollar in the numerator can be traced and stress-tested rather than asserted 5.
- Specify a multi-year horizon with year-by-year net benefit and a discount rate for inflation and capital cost, because judging long-payback initiatives at twelve months produces the wrong verdict 11.
- Run sensitivity ranges on the three to five most influential inputs and report breakeven thresholds, since single-point ROI estimates read as advocacy and invite committee pushback 5.
- Separate ROI from cost-effectiveness analysis and use a parallel ledger for non-monetizable outcomes like experience scores or retention, preserving analytical integrity instead of inflating the ratio 6, 8.
- Compare linear per-site retainer scaling against shared-capacity scaling inside the calculator, because the denominator structure—not the gross benefit—drives ROI divergence as the footprint grows 11.
- Present the operational change before the headline ratio, show the low/base/high band, and disclose what sits outside the numerator to shorten the finance review cycle 7.
Why operator-built ROI models lose budget battles
Most operator-built ROI models fail to secure budget approval because they lack the analytical rigor finance committees expect. While the presentation may appear polished and the math reconciles, proposals are often deferred due to structural deficiencies in the ROI analysis.
The core issue is that these models frequently present a single ROI ratio, based on a single baseline and time horizon, without accounting for sensitivity or comparing alternatives. This approach is often perceived as advocacy rather than objective analysis. AHRQ's quality improvement toolkit emphasizes that planning-phase estimates rely on assumptions that require testing, not mere assertion.11
The broader healthcare quality literature supports this, indicating that disciplined ROI work is rare. An integrative review of 68 large-scale quality improvement publications found that only a minority explicitly calculated ROI, and that monetizable returns often capture only a fraction of the total value generated.6 This leads to two common pitfalls: overclaiming cases collapse under scrutiny, while underclaiming cases are dismissed as insignificant.
A finance-grade ROI calculator addresses these problems by enforcing a consistent structure: a clearly defined baseline, a comprehensive intervention cost stack, a monetized benefit chain with clear attribution, a multi-year horizon with discounting, and an explicit sensitivity range. CMS guidelines reinforce this by framing the business case as documentation of all potential impacts, not just selected favorable ones.8 The following sections detail how to construct such an instrument.
The five components a finance-grade ROI calculator must contain
Baseline: the number the intervention is supposed to move
A baseline is the pre-intervention value of the specific metric an initiative aims to change. Without a clearly defined baseline, all subsequent calculations in the ROI model lack credibility. AHRQ's ROI guidance specifies that a credible estimate requires a before/after structure, a defined comparison group or period, and clear documentation of the data source, measurement window, and unit.5 Examples include patient acquisition cost per site, no-show rate by service line, or marketing-attributed new-patient revenue per location. Each must be observable in the source system before the model is run.
Common errors in operator-built cases include baselines derived from a single quarter and then extrapolated, or blended system-wide baselines that obscure significant variance across different sites. Finance committees routinely scrutinize both. The AHRQ facilitator guide also advises anchoring statistics to the operator's own data rather than relying on national averages, as these often fail to withstand a CFO's detailed questioning.7
Intervention cost stack: every dollar that touches the initiative
The investment denominator is a frequent point of failure, as most cases understate costs, leading to rejection. AHRQ defines ROI as net financial returns divided by financial investment in improvement actions, explicitly stating that the denominator must capture all development and operating costs, not just visible vendor line items.11
A complete cost stack comprises four layers:
- Direct purchase or license costs
- Implementation labor (clinical, operations, IT, and analyst hours for configuration, training, and migration)
- Ongoing operating costs (subscription renewals, support, and marginal staff time)
- Opportunity cost on internal capacity diverted during the build period
For horizons extending beyond one year, depreciation, inflation, and capital cost treatment must also be included.11 Soft costs, such as governance time and vendor management, are often omitted but are routinely identified during finance reviews.
CMS reinforces this principle, requiring business cases to document all potential impacts, including resource needs that are harder to quantify but unavoidable.8 A cost stack that omits known categories signals advocacy, whereas one that names them and provides defensible estimates signals thorough analysis.
Monetized benefit chain: from operational metric to dollar
A benefit chain explicitly links a changed operational metric to an auditable dollar value. Every link in this chain must be transparent; skipping links can lead to inflated numerators. The chain requires three nodes:
- The operational metric shifted by the intervention (in its native unit)
- The conversion rule translating this unit into a financial quantity (e.g., contribution margin per new patient)
- The attribution assumption, specifying the intervention's causal share of the change, distinct from seasonality, market shifts, or concurrent initiatives
AHRQ's QI instructions treat attribution as a planning-phase decision that must be explicitly stated.5
Consider workforce inputs: the AMA reports physician burnout costs ranging from $500,000 to over $1 million per physician, covering recruitment, sign-on bonuses, lost billings, and onboarding.10 An intervention reducing turnover risk for two physicians should not be entered as "$1M to $2M saved." Instead, it should be modeled as: baseline turnover rate, projected reduction in attrition probability, per-physician replacement cost from the cited range, and an attribution factor against concurrent retention programs. This approach yields the same dollar value but provides a transparent chain for CFOs to follow and stress-test.
The integrative QI review highlights that only a fraction of healthcare benefits are cleanly monetizable, underscoring the need for each item in the numerator to have a documented chain.6
Time horizon and discounting: why year one is the wrong verdict
Most operator-built models are evaluated on a twelve-month payback period, yet many healthcare initiatives that warrant a business case do not achieve net positive returns within this timeframe. This mismatch often leads to the rejection of sound investments.
AHRQ's Tool F.1 provides a compelling example: a computerized provider order entry (CPOE) implementation cost $11.8 million over ten years, generating $28.5 million in cumulative savings (approximately $2.2 million in net benefit annually), but required over five years to become net positive.11 Judged at year one, it's a loss; at year ten, the ROI is approximately 1.4 to 1, with substantial ongoing value. The verdict is entirely dependent on the chosen horizon.
Therefore, a calculator must specify three elements:
- The horizon length, justified by the investment's useful life and the operator's planning cycle
- The discount rate applied to future cash flows, which AHRQ recommends adjusting for inflation and the cost of capital11
- The year-by-year net benefit curve, not just a single multi-year aggregate
The NCD investment case literature uses a similar structure for policy-scale analyses, involving multi-year projections, scenario-based modeling, and discounted productivity gains over the intervention's full economic life.9 At the operator scale, cash outflows typically cluster early, while operational gains compound later. A calculator that flattens this curve into a single-year ratio provides finance committees with an incomplete picture.
Sensitivity range: the test most business cases skip
A single-point ROI estimate is a forecast, not a robust analysis, and finance committees recognize this. A model lacking a sensitivity range is often perceived as advocacy rather than objective analysis. AHRQ explicitly states that planning-phase ROI estimates are based on assumptions and best estimates, which require explicit testing before being presented as actionable.5
The process is straightforward: identify the three to five inputs most critical to the ROI, typically including the baseline value, attribution factor, per-unit benefit conversion, time horizon, and discount rate. Vary each across a defensible low/base/high range and report the resulting ROI band, not just the midpoint. Two key outputs are crucial for the committee: the breakeven threshold (at what value of each input does ROI fall below one?) and cross-input scenarios (what happens when two adverse assumptions occur simultaneously?). An initiative that collapses if attribution drops from 70% to 55% is fundamentally different from one that remains viable at 40%. Addressing these questions proactively shortens the review cycle.
A systematic review of public health ROI highlights methodological heterogeneity and assumption-dependence as primary reasons for wide variations in ROI numbers across comparable studies.1 Incorporating a sensitivity range allows operators to preempt this critique.
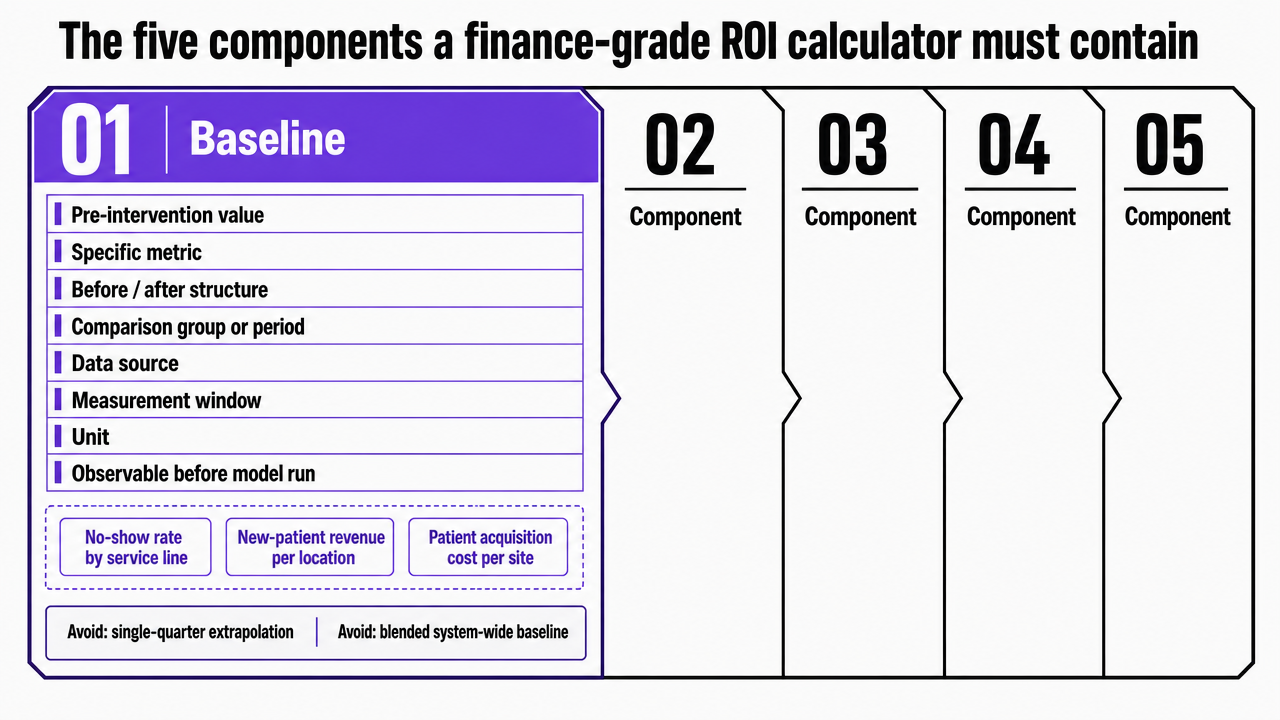 Visualize the five-component framework that structures the entire section, giving readers a scannable reference for the calculator architecture
ROI is not cost-effectiveness: getting the instrument right
ROI and cost-effectiveness analysis serve different purposes, and finance committees quickly identify when one is substituted for the other. Presenting a cost-per-quality-adjusted-life-year as ROI will lead to immediate rejection.
ROI is a financial ratio, defined by AHRQ as net financial returns from improvement actions divided by financial investment in those actions, expressed as a dollar-on-dollar comparison.11 In contrast, cost-effectiveness analysis compares the cost of an intervention to a non-monetary outcome unit, such as cases averted or life-years gained. This method is appropriate when benefits resist credible monetization. CDC's POLARIS guidance distinguishes between programmatic cost analysis, cost-effectiveness, cost-utility, and benefit-cost analysis, emphasizing that the method should be chosen based on the specific decision at hand, not as interchangeable framings.3 The CDC primer advises selecting the method based on what the comparison actually needs to demonstrate.4
For operators, the practical filter is whether the dominant benefits can be priced without inflation. Marketing program economics, technology platform consolidation, coordination labor reduction, and turnover avoidance can all be converted into defensible dollar values through documented chains, making ROI the correct instrument. Clinical outcome improvements, where dollar conversion would require heroic assumptions, are better suited for cost-effectiveness analysis, with ROI reserved for the operational components surrounding them. Correctly naming the analytical instrument ensures the discussion remains within the finance domain rather than shifting to a clinical one.
Test ROI Scenarios With Real-Time Data Modeling
Build and validate your business case using live data and publishable outputs during your free trial period.
The parallel ledger: benefits that belong in the case but not in the numerator
Benefits such as patient experience scores, staff retention signals, brand equity, referral network strength, and clinician satisfaction are all influenced by operational investments. However, none of these should be included in the ROI numerator.
The temptation to include them is strong, as programs improving Net Promoter Score or reducing clinician disengagement clearly generate value, and monetizing them can make the ROI ratio appear stronger. However, the integrative QI review directly cautions against this, noting that only a small fraction of healthcare quality benefits are cleanly monetizable, and forcing others into dollar figures transforms analysis into advocacy.6 CMS reinforces this by stating that harder-to-quantify impacts must be documented as they are, not repackaged as cash.8
The operational solution is to use a parallel ledger. The primary ledger contains items with a defensible monetization chain, such as incremental margin from new patient volume, recovered FTE hours at fully loaded cost, avoided turnover based on per-physician replacement costs, and vendor consolidation savings. The parallel ledger lists directionally measurable but non-monetized outcomes like experience scores, retention signals, brand strength, and referral momentum. Both ledgers are presented in the business case, but only the first feeds the ROI ratio. Finance committees perceive this separation as a sign of analytical integrity.
Calibrating expectations: what 'good' ROI looks like in healthcare
Finance committees often begin by asking what return a proposal is being compared against. Without a calibration anchor, a 3:1 projection might seem ambitious, while a 9:1 projection could appear suspect, both based on mere speculation.
The most useful external anchor comes from population-level studies, not individual operator case studies. A systematic review of 52 public health interventions reported a median ROI of 14.3:1 across the sample, and 27.2:1 for national-level programs.1 These figures represent upstream and preventive interventions measured over long horizons with broad, society-wide benefit definitions. They are not directly transferable to a single-site marketing program or a platform consolidation case, as the scope significantly impacts the ROI.
The calibration value is directional. Population-level work demonstrates that rigorous economic evaluation often yields double-digit ratios when the benefit definition is broad and the horizon is long. Operator initiatives with a narrower benefit set—such as revenue per site, recovered FTE hours, or avoided turnover—will naturally produce smaller ratios. This is an accurate reflection of their scope, not a weakness in the model. A 2.5:1 or 4:1 result for a tightly scoped, multi-year operational investment is a credible number. The 2023 update on ROI methodology reinforces this, stating that while ratios are increasingly used in resource allocation, their interpretation depends on the scope of included costs and benefits.2 A calculator that clearly defines its scope before presenting its ratio gains credibility.
Quantify Marketing ROI for Multi-Site Healthcare Expansion
Get a custom ROI analysis that models cost, efficiency, and projected returns from marketing automation—purpose-built for complex healthcare and multi-location operations.
Worked example: scaling marketing across sites without scaling headcount linearly
Framing the decision for multi-location operators
This example focuses on multi-location operators—such as DSOs, MSOs, urgent care, dermatology, ortho, and behavioral health groups—managing growth programs across 5 to 200+ sites. The decision is whether to fund marketing expansion across the entire footprint, and the calculator's role is to compare how the investment scales, rather than simply whether to invest.
The finance question is structural. In a traditional per-location agency model, each new site adds a retainer, account manager time, and internal coordination load, causing marketing costs to grow linearly with the site count. In contrast, a shared-capacity model pools strategy, production, and analytics at the account level, reducing the marginal cost of adding a site as the footprint expands.
Both models can generate the same gross benefit—incremental patient volume, contribution margin per new visit, or recovered referral capacity. However, the ROI verdict diverges because the denominator behaves differently. AHRQ's framework defines the investment input as the full cost of improvement actions, including ongoing operating costs and coordination labor, not just the vendor invoice.11 This definition transforms the scaling choice into an ROI question, rather than a procurement one.
Investment denominator under linear vs. shared-capacity scaling
To illustrate the difference, consider per-site marketing cost across various footprint sizes under both models, using variables:
R : annual per-site retainer (traditional agency)
C : internal coordination labor per site per year (fraction of FTE × fully loaded cost)
S : annual shared-capacity program cost (largely fixed at account level)
c : marginal coordination labor per site (shared capacity, materially lower than C)
Under linear scaling, total annual marketing investment for N sites is N × (R + C). Per-site cost remains constant at (R + C) regardless of footprint size. Under shared-capacity scaling, total investment is S + (N × c). Per-site cost is (S/N) + c, which decreases as N grows.
| Footprint (N) | Linear per-site cost | Shared-capacity per-site cost |
|---|---|---|
| 5 sites | R + C | (S/5) + c |
| 25 sites | R + C | (S/25) + c |
| 50 sites | R + C | (S/50) + c |
| 100 sites | R + C | (S/100) + c |
The shared-capacity column shows decreasing per-site costs as N increases, while the linear column remains flat. When the calculator's gross benefit input is held constant (e.g., same patient volume lift per site, same contribution margin), the ROI ratio improves under shared capacity because the denominator decreases. AHRQ's instructions explicitly state that the investment input must reflect the actual operating cost structure, not just list price.5 Operators who model both columns within the calculator provide finance committees with the necessary comparison for decision-making.
Running the full calculator on the scenario
With the denominator structure established, the five components discussed earlier are applied directly:
- Baseline: Per-site patient acquisition cost, new-patient volume per month, contribution margin per new patient, and current marketing-attributed revenue, each measured per site over a defined window using data from GA4, the EHR, and the practice management system.5 Site-level variance is reported, not averaged out.
- Intervention cost stack: Program cost at the account level, plus marginal per-site coordination labor, implementation hours during onboarding, and the opportunity cost of internal analyst and operations capacity diverted during the build.11 Soft costs, such as governance reviews and vendor management, are included as named line items with defensible estimates.
- Benefit chain: Projected lift in new-patient volume per site, multiplied by contribution margin per patient, and then by an attribution factor that accounts for seasonality and concurrent referral efforts. Avoided coordination FTE hours are converted at fully loaded cost. Any reduction in clinician turnover risk is quantified using the AMA's documented per-physician replacement range of $500,000 to over $1 million, applied to the specific number of physicians whose retention the program credibly influences.10
- Time horizon: A three-to-five-year horizon is used, with year-by-year net benefit reported separately. Cash outflows typically cluster in years one and two, while compounding benefits emerge later.
- Sensitivity range: Low/base/high bands are applied to attribution, per-site volume lift, and onboarding cost. The breakeven threshold is explicitly stated. CMS expects the business case to document all potential impacts, not just the favorable ones.8
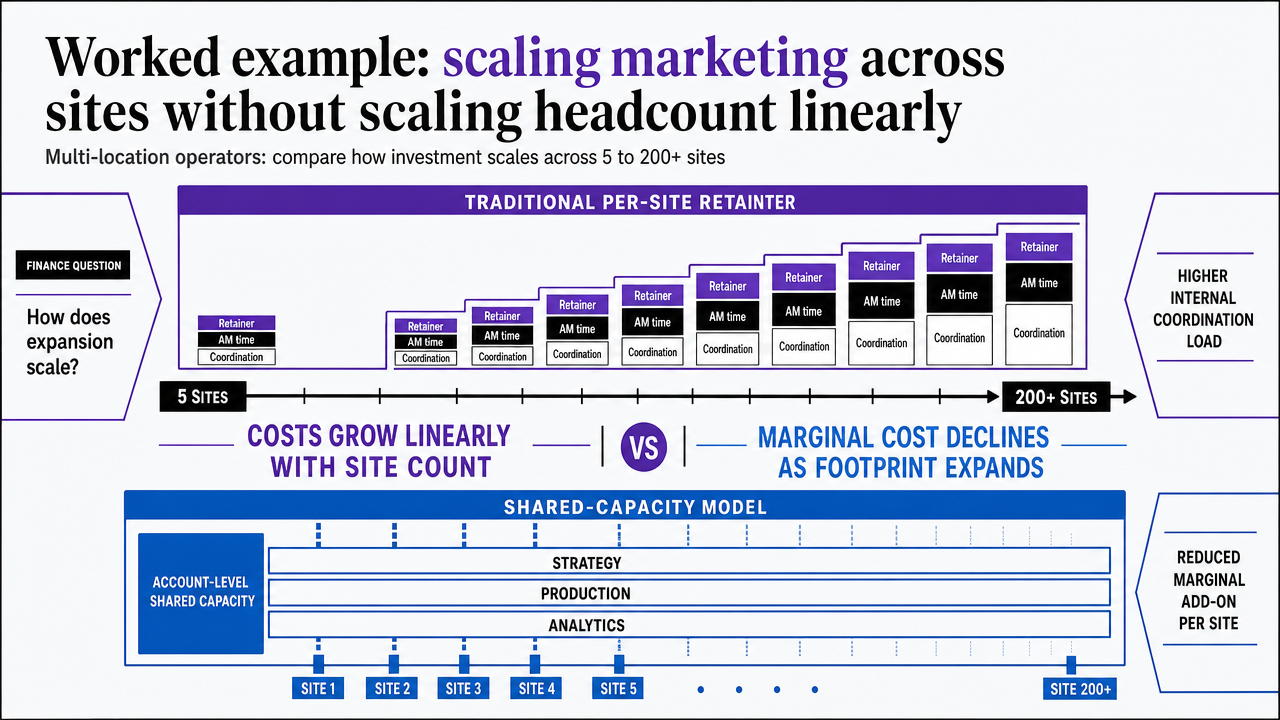 Visualize the comparison between linear per-site retainer scaling and shared-capacity scaling that the section explicitly walks through with a table
Presenting the model to a finance committee
While the calculator performs the analytical work, the presentation determines whether the finance committee acts on the proposal.
Lead with the operational question, not the ROI ratio. The AHRQ facilitator guide recommends starting with the revenue and cost movements the initiative is designed to produce, then detailing the required investment, rather than immediately presenting a headline ROI figure that invites challenge.7 This sequencing demonstrates discipline. A model that first articulates the operational change—such as per-site volume lift, recovered coordination hours, or avoided turnover risk—establishes credibility before the financial calculations are introduced.
Present the ROI as a range, not a single point. While the midpoint ratio should be included, the low/base/high range must be presented alongside it, with the breakeven threshold for each sensitive input clearly identified.5 A presenter who transparently outlines the conditions under which the case might fail is more credible than one who only highlights success scenarios.
Clearly state what is excluded from the numerator. Non-monetized benefits like patient experience improvements, retention signals, and brand strength should be presented on a parallel slide as documented outcomes.6, 8 This separation signals to the committee that the presenter has avoided inflating the ratio, a move that enhances credibility, shortens the review cycle, and facilitates decision-making.
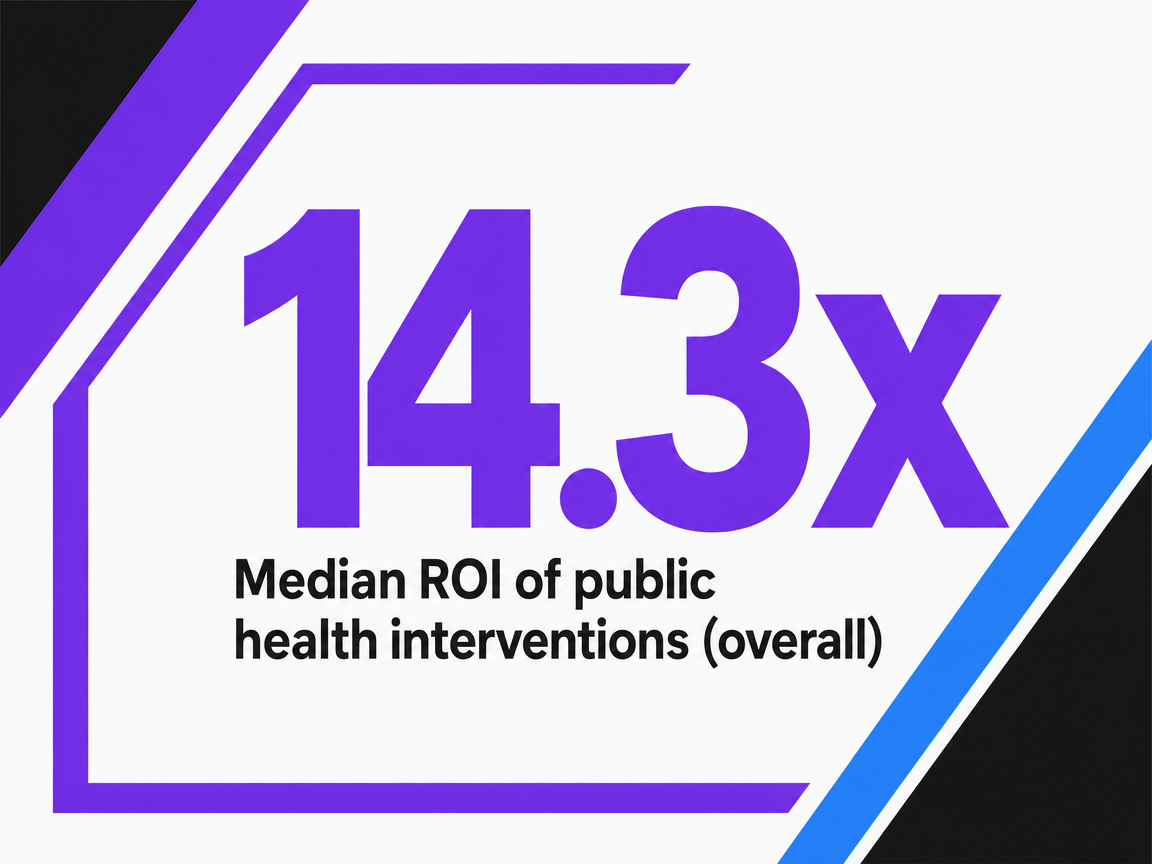 Median ROI of public health interventions (overall)
Median ROI of public health interventions (overall)
Frequently Asked Questions
References
- 1.Return on investment of public health interventions: a systematic review.
- 2.Analyses of the return on investment of public health interventions: a systematic review.
- 3.Economic Evaluation | POLARIS.
- 4.Part 1: Introduction to Economic Evaluation.
- 5.INSTRUCTIONS: Return on Investment Estimation.
- 6.The development of the concept of return‑on‑investment from large‑scale quality improvement programmes in healthcare: an integrative systematic literature review.
- 7.Build a Business Case for Quality Improvement: Facilitator Guide.
- 8.The Business Case: What It Is, Why It Helps, and How to Get Started.
- 9.The reported impact of non-communicable disease investment cases in low- and middle-income countries: a systematic review.
- 10.How much physician burnout is costing your organization.
- 11.Return on Investment Estimation (Tool F.1) – Toolkit for Using the AHRQ Quality Indicators.