
Key Takeaways
- Channel-level ROI reports conflict because B2B buyers touch an average of 2.8 channels before converting, so single-touch attribution systematically misrepresents which channels actually generate demand 5.
- A defensible ROI model requires four coordinated layers: collection in a first-party warehouse, identity resolution to CRM accounts, a frozen attribution rule, and a decision cadence that reallocates budget.
- W-shaped attribution suits most Series B–D SaaS teams since it credits first touch, lead creation, and closed-won; data-driven attribution becomes viable once channel conversion volume exceeds GA4 thresholds 2.
- Pair attribution with geo or audience holdouts to separate correlation from causation, then present finance an LTV:CAC anchor, disclosed model, and incrementality-adjusted channel contribution 310.
Why Channel-Level ROI Reports Mislead SaaS Finance Teams
Most SaaS marketing dashboards present ROI in ways that often conflict, leading to skepticism from finance. For instance, Google Ads might claim credit for closed deals based on last-click, while an SEO platform reports organic traffic value using its own metrics. This disparity means finance receives multiple, unreconcilable numbers, correctly concluding that marketing's ROI calculations are unreliable.
This discrepancy stems from a structural issue, not a mathematical error. B2B buyers typically interact with an average of 2.8 channels before converting5. This means any single-touch attribution model misrepresents the value of channels that contribute to the middle of the buyer's journey. For example, SEO content and backlinks often drive early discovery and assist conversions, while paid search captures the final branded query. When last-click attribution dictates budget allocation, the channel that closes the deal receives all the credit, while channels that generate initial demand are often undervalued and subsequently cut.
 Position-Based (U-Shaped) Attribution Model
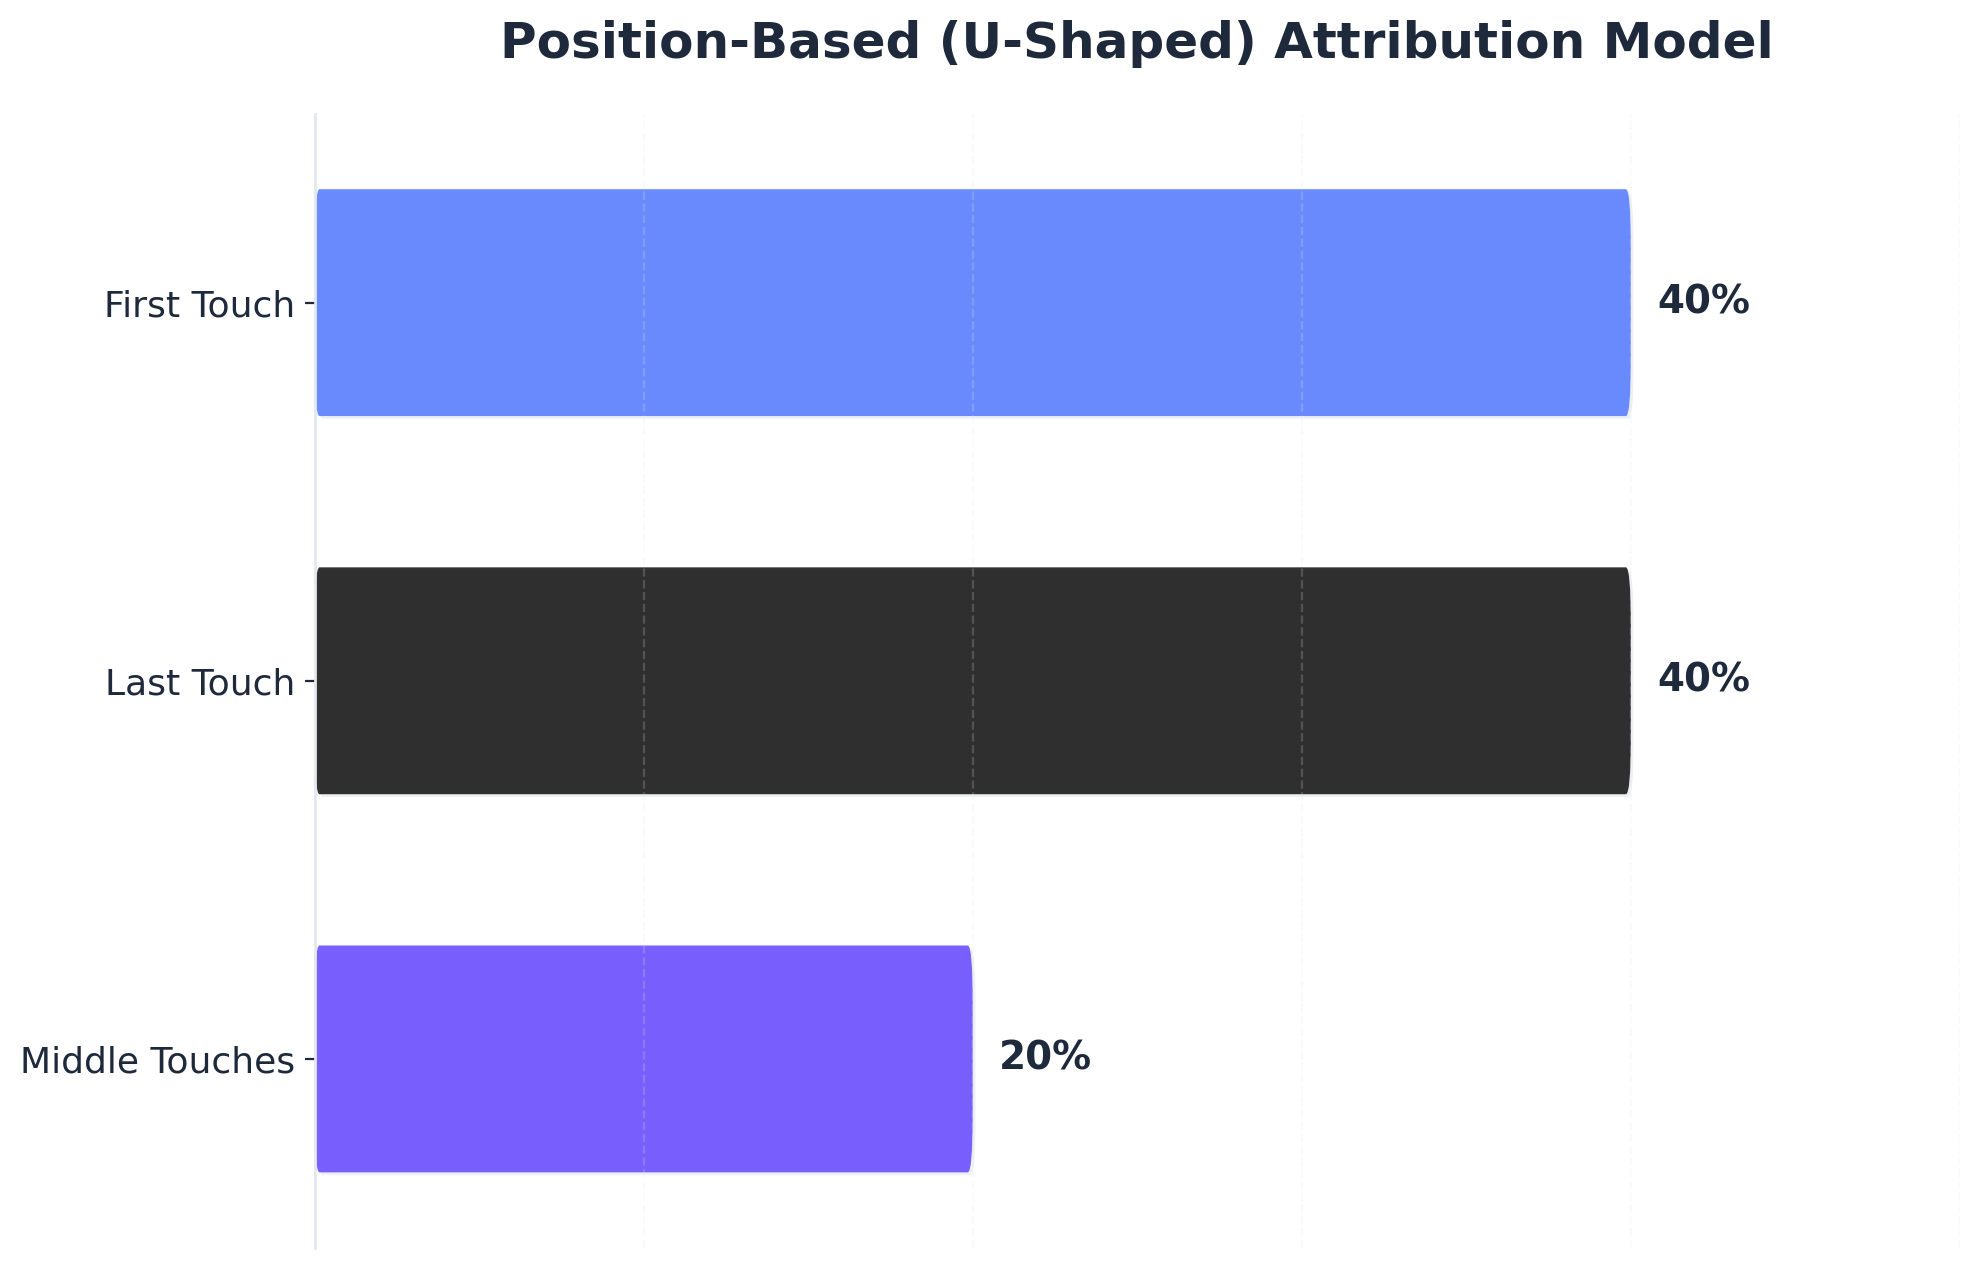
Position-Based (U-Shaped) Attribution Model: First Touch: 40%, Last Touch: 40%, Middle Touches: 20%. A position-based or U-shaped attribution model assigns 40% of conversion credit to the first touchpoint, 40% to the last touchpoint,.
The solution isn't just a better dashboard, but a clearly defined ROI model. This model must pre-determine how revenue is collected, how identities are resolved, how credit is assigned, and how these numbers inform budget decisions. Without such an architecture, quarterly business reviews often devolve into debates over attribution, with CFOs defaulting to channels that offer the most straightforward direct-response metrics. The four-layer model described below aims to replace this debate with a unified, finance-defensible equation.
The Four-Layer ROI Model Architecture
Layer 1 — Collection: Source Systems and the First-Party Mandate
The collection layer establishes the foundation for all subsequent analysis. Any touchpoint not captured here cannot be recovered by downstream attribution logic. For SaaS teams managing SEO, paid, and backlink strategies, this typically involves at least six source systems:
- GA4 for site behavior
- Google Ads (and other paid platforms) for spend and click data
- Search Console for organic query and impression data
- A link-building tool (e.g., Ahrefs, SEMrush) for referring domain history
- A marketing automation platform (e.g., HubSpot, Marketo) for form fills and email engagement
- The CRM (e.g., Salesforce, HubSpot CRM) for opportunity and revenue data
Each system generates data in its own format and cadence. Google Ads provides granular hourly cost data, while Search Console aggregates impressions over a 16-month period. CRM stages update based on sales activity. Attempting to reconcile these disparate data sources in a BI tool after the fact often leads to delays and data loss. The standard solution is a marketing data warehouse, such as BigQuery or Snowflake, which ingests raw event data from each source on a scheduled basis and stores it in a queryable, joinable schema8.
The shift to first-party data collection is now essential. As third-party cookies are phased out, models relying on cross-site tracking are losing accuracy7. Teams that haven't adopted first-party event collection—like server-side GA4 tagging, authenticated user IDs from product usage, and consent-based email capture—are basing their measurements on diminishing sample sizes. It's crucial to capture more data than currently used, including every UTM parameter, referrer, landing page, and session identifier, as this flexibility makes future attribution model changes more cost-effective.
Layer 2 — Identity: Stitching Anonymous Sessions to CRM Records
While the collection layer gathers events, the identity layer transforms these events into profiles of individuals. Without it, a prospect who engages with multiple pieces of content anonymously, fills out a form, books a demo, and eventually closes a deal, might appear as several disconnected records in the data warehouse. The ability to accurately track pipeline to revenue depends on resolving these disparate records into a single account.
Conceptually, identity resolution is straightforward: a persistent first-party cookie or device identifier links anonymous sessions, and a deterministic match (typically an email address from a form fill) connects the anonymous session data to the CRM contact. However, operational complexities arise. Mobile-to-desktop journeys can break cookie chains, and privacy-focused browsers like Safari limit first-party cookie lifetimes. Buyers often research on personal devices but convert on corporate ones. Furthermore, B2B deals involve multiple stakeholders, only one of whom might have completed the initial form.
Effective identity resolution employs a two-tiered approach:
- Deterministic matching handles high-confidence cases, such as identical email addresses or authenticated user IDs.
- Probabilistic stitching, using factors like IP range, company domain enrichment (via tools like Clearbit or 6sense), and timing patterns, addresses the remaining cases, assigning a confidence score to each match.
The outcome of this layer is a unified person and account graph within the data warehouse, with every marketing touchpoint linked to a CRM opportunity ID. Without this crucial connection, the attribution layer cannot assign revenue, and the ROI model reverts to channel-specific vanity metrics1.
Layer 3 — Attribution: Where Most Models Break
The attribution layer determines how credit for revenue is assigned. This is often where teams default to whatever their ad platform provides, rather than making a deliberate choice. This layer takes the unified touchpoint graph from Layer 2 and applies a credit-assignment rule, such as last-click, first-click, linear, position-based, W-shaped, or data-driven. Each rule yields a different revenue figure for each channel, and these differences can be substantial. Given that a B2B journey involves an average of 2.8 channels, last-click attribution inherently favors the channel closest to the conversion event, typically branded paid search or direct traffic5.
Two key principles distinguish effective attribution layers from superficial ones. First, the chosen model must be applied consistently across all channels and reporting views. Using last-click for paid media and first-click for SEO to make each team look good is a common form of self-deception in marketing analytics. Second, the model must be documented and fixed for the reporting period. Changing attribution mid-quarter to achieve more favorable numbers undermines the comparability essential for a defensible ROI equation.
The architectural point is that attribution is a singular, deliberate decision, not a setting managed across multiple dashboards.
Layer 4 — Decision: From Dashboard to Budget Reallocation
An ROI model that merely produces a dashboard is incomplete. The decision layer translates attributed revenue figures into concrete budget actions. This includes:
- Increasing spend on high-performing paid campaigns
- Cutting underperforming content clusters
- Reallocating link-building budgets to topic clusters with high conversion rates
The primary challenge at this layer is speed. Manually analyzing cross-channel performance, identifying reallocation opportunities, and gaining stakeholder alignment typically consumes 16 to 25 hours per cycle for mid-sized SaaS marketing teams. AI-assisted decision tools can reduce this to 2 to 4 hours by automating data integration, highlighting underperforming and overperforming segments, and proposing reallocation scenarios with projected pipeline impact6.
BCG's framework for data-driven budget allocation emphasizes that the most impactful decisions are not weekly bid adjustments but quarterly portfolio shifts, moving 5% to 15% of the total budget across channels based on incremental return rather than reported return9. This distinction is only relevant if the decision layer prioritizes incremental return as a key metric, which necessitates the testing protocols discussed in the next section. The decision layer requires a defined cadence and a clear owner. A monthly reallocation review involving the VP Marketing, head of demand gen, and a finance partner drives actual budget changes, whereas an ad-hoc dashboard merely generates opinions. Vectoron's approach to coordinating SEO, PPC, and backlink strategy at the account level exemplifies this principle: a single operating layer making unified decisions, preventing channel teams from optimizing in isolation.
Test Your Digital Marketing ROI Model Instantly
Validate real campaign impact with live data and measurable results before any commitment.
Picking an Attribution Model Without Misleading Finance
Where Last-Click and First-Click Quietly Fail
Last-click attribution persists largely because it's the default. Google Ads uses it, GA4's legacy reports often default to a last-non-direct variant, and most CRM revenue reports inherit the last UTM parameter. This often results in SaaS marketing organizations attributing 60% to 80% of pipeline credit to branded paid search and direct traffic—channels closest to the form fill. Meanwhile, SEO clusters and referring domains, which are crucial for demand generation, appear as zero-revenue line items.
First-click attribution makes the opposite error. It assigns all credit to the initial touchpoint, such as a blog post or display ad, ignoring all subsequent nurturing interactions. For a Series B SaaS company with a 90-to-180-day sales cycle, first-click systematically overvalues top-of-funnel content and undervalues middle-funnel activities like webinars, retargeting, and outbound sequences that actually drive opportunities to closed-won status5.
Both single-touch models share a fundamental flaw: they assume a single touch causes conversion, despite the average B2B journey involving 2.8 channels, often more for enterprise deals5. Defending either model to a CFO requires either ignoring this reality or pretending it doesn't apply to the specific company.
Linear, Position-Based, and W-Shaped: B2B Tradeoffs
Multi-touch models distribute credit across various touchpoints. Linear attribution divides revenue equally among all touchpoints. For example, a six-touch journey would assign 16.7% credit to each. While transparent about its lack of judgment regarding touchpoint importance, this is also its weakness; a minor display impression receives the same credit as a demo request that leads to a closed deal. For SaaS teams with extensive top-of-funnel content, linear attribution can inflate the perceived contribution of low-intent assets and obscure which content truly drives pipeline.
Position-based attribution, also known as U-shaped, allocates 40% of the credit to the first touch, 40% to the last touch, and distributes the remaining 20% across the middle interactions. This model reflects a defensible belief that discovery and conversion are the most impactful moments, with intermediate touches playing a supporting role.
W-shaped attribution introduces a third anchor point. It assigns 30% to the first touch, 30% to the lead-creation event (e.g., form fill or demo request), 30% to the closed-won touch, and the remaining 10% to other interactions. For B2B SaaS companies with a defined MQL-to-SQL-to-Closed pipeline, W-shaped attribution aligns well with the funnel stages that finance teams already track.
In practice, linear attribution is the easiest to explain but the least useful for budget decisions. Position-based attribution is suitable for shorter sales cycles where the middle interactions are less critical. W-shaped attribution is often the most defensible for SaaS, as it credits the three key moments that directly correspond to revenue events in the CRM.
Data-Driven Attribution: When the Black Box Earns Trust
Data-driven attribution (DDA) replaces fixed credit rules with a model trained on an account's specific conversion data. GA4's implementation, for instance, uses Shapley-value-derived logic to compare conversion paths of converters and non-converters, assigning credit based on each touchpoint's marginal contribution to conversion probability2. This results in channel revenue numbers determined by the algorithm, not human bias.
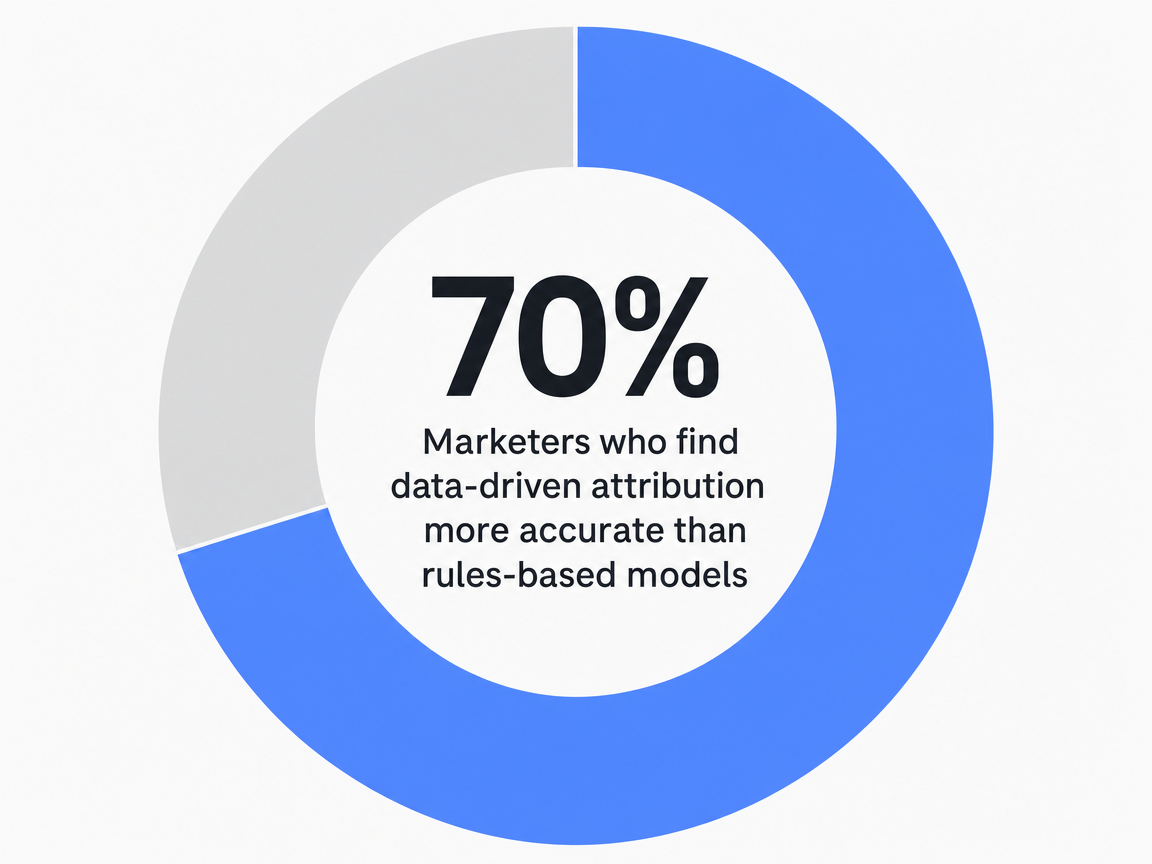 Marketers who find data-driven attribution more accurate than rules-based models: 70%
DDA adoption shows promising results: 50% of marketers report ROI improvement after switching, and 70% find it more accurate than rules-based models2. However, DDA requires significant data volume. GA4 specifies minimum conversion thresholds, typically over 300 conversions per channel within 30 days, for stable output. Series B SaaS companies with only 50 monthly demo requests may not meet this threshold at the channel level, causing DDA to silently revert to a rules-based default.
The "black-box" nature of DDA can be a challenge. A CFO asking why paid social received $340K in pipeline credit cannot be satisfied with "the model decided." To maintain defensibility, two practices are key:
- Run DDA in parallel with a W-shaped model for at least one full sales cycle to identify and investigate significant divergences.
- Expose the top conversion paths that the model heavily weights, making the credit assignment auditable even if the underlying math is complex.
DDA is an excellent destination for SaaS teams with sufficient data volume and a willingness to trust algorithms, but it's not the ideal starting point for teams still aligning on simpler models.
Channel Contribution Reconciliation: $1M Quarterly Spend Across Four Models
The financial implications of attribution model choice are best illustrated with an example. Consider a SaaS company spending $1,000,000 in a quarter: $400K on Google Ads, $350K on SEO content, $150K on backlink acquisition, and $100K on paid social. This spend generates $4,200,000 in attributed pipeline during the same period. Different attribution models yield vastly different conclusions about each channel's return.
The following table demonstrates how the same underlying revenue is reallocated under various attribution rules:
| Channel | Spend | Last-Click Revenue | Linear Revenue | Position-Based Revenue | W-Shaped Revenue |
|---|---|---|---|---|---|
| Google Ads | $400K | $2,310K | $1,260K | $1,470K | $1,386K |
| SEO Content | $350K | $420K | $1,176K | $1,344K | $1,260K |
| Backlinks | $150K | $84K | $840K | $672K | $756K |
| Paid Social | $100K | $1,386K | $924K | $714K | $798K |
Under last-click, SEO shows a 1.2x return, making it a candidate for budget cuts. However, under a W-shaped model, the same SEO program yields a 3.6x return, suggesting it's a channel to invest in. Backlinks fluctuate from 0.56x (last-click) to 5.6x (linear). The actual spend and pipeline remain constant; only the credit assignment changes.
The key takeaway is not that one model is inherently "correct," but that the choice of model must precede budget decisions. Allowing last-click defaults to drive reallocation can systematically defund demand-generating channels in SaaS marketing. Selecting the model in advance, freezing it for the reporting period, and applying it consistently across all channels is the only approach that will withstand a finance review.
Incrementality Testing: The Layer That Validates Causality
Designing a Geo or Audience Holdout for Paid Media
Attribution assigns credit, while incrementality measures causation. These two concepts are distinct. This difference becomes clear when pausing a paid search campaign doesn't impact revenue. The brand search clicks that the campaign was "converting" would have converted anyway; the attribution model simply credited the ad as the last touch.
A geo holdout is the most straightforward method for paid media. This involves dividing the addressable market into matched test and control regions, typically by DMA for North American SaaS, ensuring regions are comparable in baseline conversion rate, account density, and existing pipeline volume. The campaign runs in the test geos but is entirely suppressed in the control geos. The difference in conversion rate between the two groups is then measured over a period long enough to cover the sales cycle.
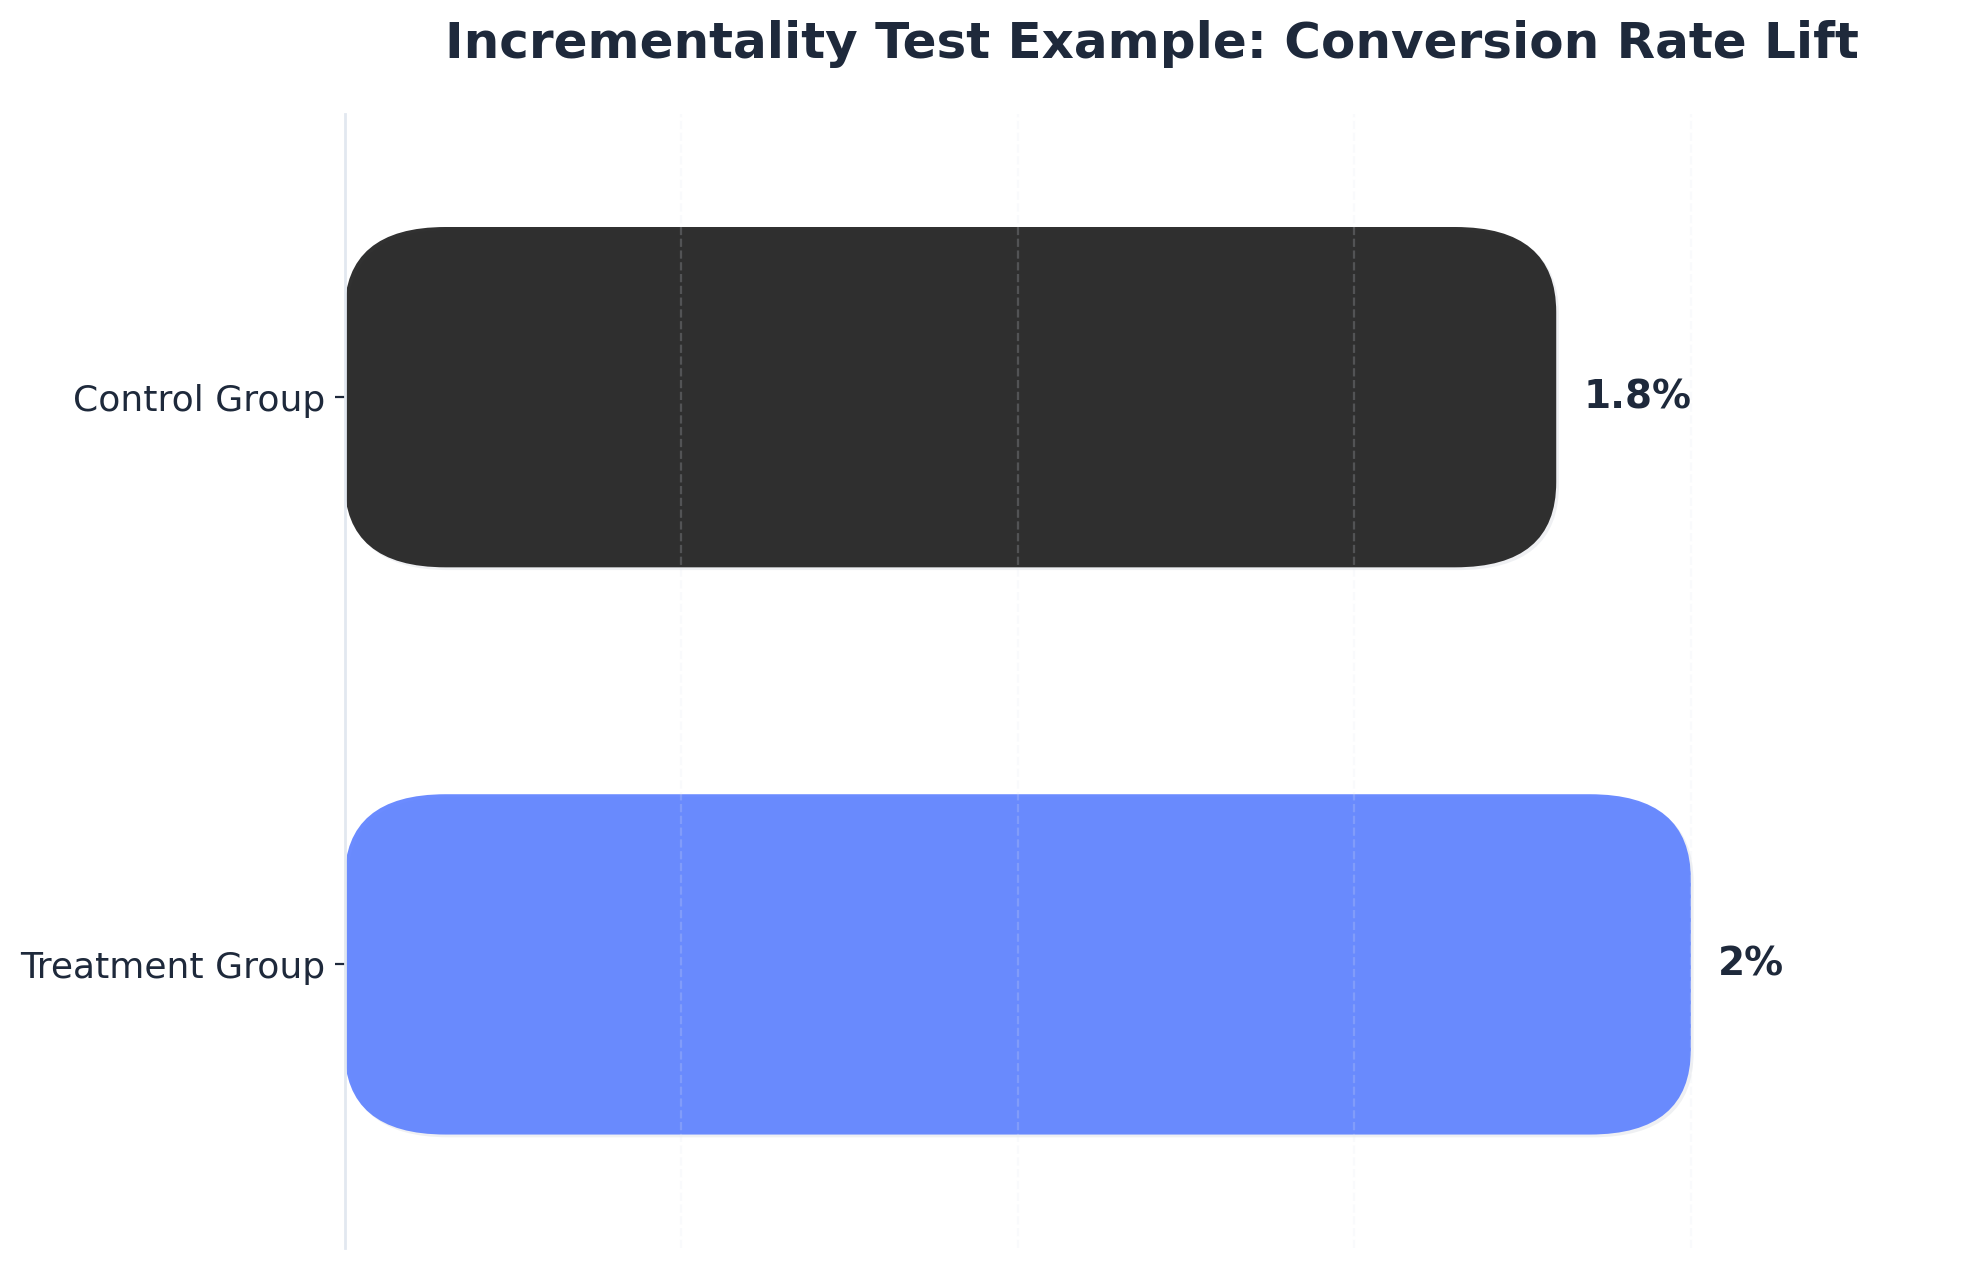
For example, if a paid social campaign yields a 2.0% conversion rate in test geos and 1.8% in control geos over 30 days, the 0.2 percentage point gap represents the incremental lift10. The remaining 1.8% of conversions in the test group would have occurred without the ad spend, even though they might appear as paid social wins in an attribution dashboard.
 Incrementality Test Example: Conversion Rate Lift
Incrementality Test Example: Conversion Rate Lift: Treatment Group: 2.0%, Control Group: 1.8%. An example of an incrementality test where the group exposed to a campaign (treatment) had a 2% conversion rate versus 1.8% for the unexposed group (control), showing a 0.2 percentage point causal lift.
Audience holdouts function similarly on platforms that support them. Meta's conversion lift studies, Google's geo experiments, and LinkedIn's brand lift tests all randomize exposure within an audience to report the causal delta. The results are fed into the decision layer as a multiplier for attributed revenue. If attribution credits paid social with $800K and a holdout shows 60% incrementality, the channel's true contribution is $480K, guiding budget adjustments accordingly.
Testing SEO and Backlink Lift Without Killing Traffic
Incrementality testing for SEO and backlinks is more challenging because the standard approach—disabling the channel to measure the impact—can be destructive. Pausing a paid campaign for two weeks only costs two weeks of clicks. However, pausing a content cluster means de-indexing pages that took months to rank, and recovery is not symmetrical4.
Two non-destructive test designs are effective:
- Page-level holdout: Identify a cohort of comparable URLs based on topic, search volume, and current ranking. Apply the desired change—a content refresh, internal link build-out, or new backlink push—to half of these URLs. Then, compare the organic conversion rate and pipeline contribution between the test and control cohorts over a full quarter. The control group maintains its ranking, while the test group reveals the marginal lift of the intervention.
- Staggered launch for topic clusters: Instead of publishing 20 pieces in a cluster simultaneously, publish ten in month one and the remaining ten in month three. This two-month gap creates a natural before-and-after comparison for the cluster's pipeline contribution. The staggered cohort also helps control for seasonal demand shifts that a simple year-over-year comparison might miss.
Backlink incrementality follows a similar logic at the referring-domain level: acquire links to a defined set of target pages during a test window, hold back a comparable set of pages, and measure the resulting ranking and pipeline delta. The output from these tests informs the decision layer, providing a causal multiplier to correct attributed numbers before any budget adjustments are made.
Unlock Predictable ROI With Data-Driven Digital Marketing Models
Get a personalized consultation on building unified ROI frameworks across SEO, PPC, and content—designed for agencies and enterprise marketing teams seeking measurable, scalable growth.
Presenting the Model to Finance
Finance teams approve marketing budgets based on a clear, defensible answer to one question: what is the return on the next dollar invested, and how confident is the team in that projection? They are not swayed by attribution diagrams alone.
A presentation that successfully navigates a CFO review typically has three core components:
- Anchor to the LTV:CAC ratio with an attached payback period. Mature SaaS organizations benchmark marketing performance against a 3:1 ratio of customer lifetime value to customer acquisition cost, with payback occurring within 12 to 18 months3. This single ratio shifts the conversation from channel-specific ROI debates to portfolio-level efficiency, aligning with the unit economics finance already models for the board.
- Transparent disclosure of the attribution decision. The deck explicitly names the chosen model—be it W-shaped, DDA, or another model frozen for the period—explains the rationale behind its selection, and highlights any reconciliation gap between attributed revenue and CRM-recognized revenue. Hiding the model invites suspicion, whereas openly discussing it fosters a conversation about tradeoffs, which builds credibility.
- Incorporate incrementality corrections. Attributed channel revenue is presented alongside the most recent holdout results, with the causal multiplier applied. For example, a line item stating "$800K attributed, 60% incrementality validated, $480K incremental contribution" for paid social demonstrates to finance that the team has distinguished correlation from causation10.
The presentation should conclude with a single slide outlining the next reallocation move, its projected pipeline impact, and the test designed to validate it. This is the ultimate output of a defensible ROI model: not just a dashboard, but a budget decision that finance can confidently approve.
Frequently Asked Questions
References
- 1.The Ultimate Guide to Digital Marketing ROI - Search Engine Journal.
- 2.Data-driven attribution - Google Analytics Help.
- 3.The Only Metric That Matters Now - HBR.org.
- 4.How Long Does SEO Take to See Results? - ahrefs Blog.
- 5.First-Touch vs. Last-Touch Attribution: Which Is Better? - MarketingProfs.
- 6.AI in Marketing: The New Frontier of ROI - McKinsey & Company.
- 7.The death of the third-party cookie: What marketers need to know - TechCrunch.
- 8.Building a Marketing Data Warehouse with BigQuery - Google Cloud Blog.
- 9.A Framework for Data-Driven Marketing Budget Allocation - BCG.
- 10.How to Measure Incrementality in Marketing - AdExchanger.