
Key Takeaways
- Syndication ROI holds up under CFO scrutiny only when measured across four separate tiers: cost per raw lead, ICP-to-SQL yield, cost per opportunity, and cost per closed-won on weighted attribution.
- A vendor's headline CPL rarely reflects true acquisition cost; a $45 CPL routinely decays into a four- or five-figure cost per closed-won once ICP fit, SQL conversion, and close rates are applied.
- Assign syndication a fixed 10% to 20% share of deal credit under a custom-weighted multi-touch model, applied only when the touch precedes opportunity creation, and hold the policy constant across every channel.
- Report four figures to the CRO: cost per opportunity, ICP-to-SQL yield, velocity delta from matched cohorts, and net revenue ROI on weighted attribution. Downloads and vendor CPLs belong in the working file.
Why syndication ROI keeps failing the CFO test
The math most demand gen teams present for content syndication holds up until a CFO asks two questions: what did this contribute to closed revenue, and how do you know? At that point, the download counts, MQL volumes, and vendor-quoted CPLs stop functioning as proof and start functioning as a liability.
Forrester's 2024 survey of B2B marketing leaders found that 64% don't trust their organization's marketing measurement, 61% say measurement isn't aligned to growth objectives, and 59% of CMO dashboards still track some form of sourcing metric 4. Those are self-reported views from marketing leaders about their own instrumentation, not an outside audit, and they cover B2B measurement broadly rather than syndication specifically. But syndication programs inherit the problem wholesale. When a program is measured by lead volume, its ROI story lives on the layer of the funnel where trust is lowest and correlation to revenue is weakest.
The fix is not a better CPL. It is a measurement stack that separates cost, quality, pipeline, and revenue into four distinct tiers, each answering a different question a finance partner will actually ask.
The four-tier measurement stack
Tier 1 — Cost: what the vendor's CPL actually tells you
The cost tier answers one question: how much did the program spend to acquire a raw lead record? That is all a vendor-quoted CPL measures, and it is the only layer where the vendor controls the number.
A $45 CPL on a whitepaper campaign is a description of the transaction between the buyer and the syndicator. It is not a description of pipeline economics. Two campaigns with identical CPLs can differ by an order of magnitude in every tier below. The right way to hold Tier 1 accountable is to track four inputs per source:
- total spend
- gross lead count
- blended CPL
- the CPL variance across audience segments and content offers
High-ROI syndication programs are defined by lead quality, time-to-conversion, and cost efficiency tied to pipeline and revenue rather than headline CPL 2. That framing matters at Tier 1 because it sets the expectation early: this number is a cost input for later math, not a performance verdict. Nothing gets celebrated at this layer.
Tier 2 — Quality: the ICP and SQL filter before anything counts
Before a syndicated lead enters any ROI calculation, it passes two gates. The first is an ICP filter applied on ingestion: firmographic fit, role seniority, geography, and any disqualifiers the sales team has already flagged. The second is a sales-qualification gate applied after human or automated review, which converts an ICP-fit lead into an SQL.
The metric that lives here is the ICP-to-SQL yield, expressed as a percentage of gross leads. A program delivering 1,000 leads a quarter at a 22% ICP-fit rate and a 35% SQL conversion on the ICP-fit subset is producing 77 SQLs, not 1,000 leads. That is the number every downstream tier uses.
Forrester's research on sales efficiency argues that content marketing budgets have to prove they contribute to business outcomes and better sales execution, not just lead counts 3. Tier 2 operationalizes that argument. The quality filter is where the program stops rewarding volume and starts rewarding fit. Vendors who resist providing the raw data needed to run this filter are, in effect, refusing to be measured.
Tier 3 — Pipeline: cost per opportunity and syndication-influenced velocity
Tier 3 is where syndication either earns its budget or exposes itself. Two metrics matter: cost per opportunity and syndication-influenced pipeline velocity.
Cost per opportunity is the total program spend divided by the number of opportunities where a syndication touch appears in the account's attribution timeline. If a $60,000 quarterly program produces 30 opportunities with a syndication touch, the cost per opportunity is $2,000. That number is directly comparable across channels. It is the first ROI figure that a CRO will accept as legitimate, because it maps to a pipeline object rather than a marketing event.
Pipeline velocity captures whether syndication-touched accounts move through stages faster than untouched accounts. The measurement requires cohort matching: pull a set of syndication-touched opportunities and a control set with similar firmographic profiles, then compare median days from stage 1 to stage 3. The 2025 Content Attribution Report frames this as the halo effect content has on close rates and velocity that marketers want to quantify 9. At Tier 3, that halo becomes a specific delta in days, not a claim.
Tier 4 — Revenue: cost per closed-won and net revenue ROI
The revenue tier is the layer a CFO will actually read. Two figures belong here: cost per closed-won and net revenue ROI.
Cost per closed-won divides total program spend by the number of closed-won deals with a syndication touch inside the attributed weighting window. Net revenue ROI takes the attributed revenue from those deals, subtracts program spend, and divides by spend. A program that generated $480,000 in attributed revenue on $60,000 spend produces a 700% net revenue ROI, or $8 back for every $1 in.
The critical word is attributed. Full-credit revenue accounting inflates the number and destroys credibility the first time finance audits it. Syndication rarely deserves 100% of a deal's revenue; it deserves its weighted share under whatever multi-touch model the organization has agreed to use. Forrester's measurement work reinforces that traffic-based or single-touch accountability is eroding, and downstream business impact is what carries weight 8. Tier 4 is where the program either survives its next budget review or gets reallocated. The number is defensible only because Tiers 1 through 3 are.
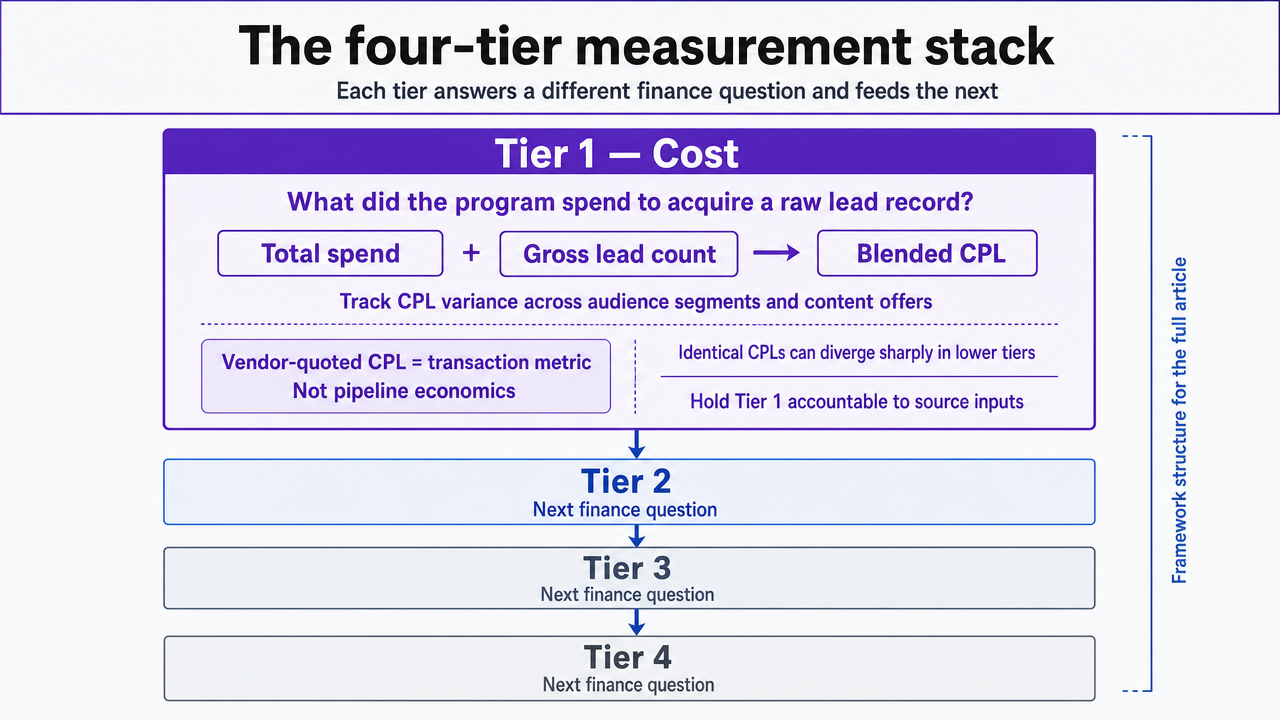 Visualize the four-tier measurement framework that structures the entire article, showing how each tier answers a distinct finance question and feeds the next
The lead-to-revenue decay curve
The CPL a vendor prints on an invoice and the CPL a CFO should evaluate are almost never the same number. The gap between them is the lead-to-revenue decay curve, and running the arithmetic once, in front of finance, tends to reset the conversation.
Consider a syndication program with a $45 blended CPL delivering 1,000 leads per quarter for $45,000 in spend. Applying a 22% ICP-fit rate cuts the pool to 220 leads. A 35% SQL conversion on that subset yields 77 SQLs. Effective cost per SQL: $584. If 25% of those SQLs become opportunities, the program produces 19 opportunities at $2,368 each. At a 20% close rate on those opportunities, 4 deals close. Cost per closed-won: roughly $11,250. The vendor's $45 CPL becomes an $11,250 acquisition cost by the time it reaches the revenue line.
That decay is not a defect. It is how syndication actually behaves, and it is why high-ROI programs are defined by lead quality, time-to-conversion, and cost efficiency tied to pipeline and revenue rather than the headline CPL a vendor quotes on the sales call 2. Two implications follow. First, no ROI defense should start at Tier 1; the number that matters lives four stages down. Second, small improvements at the ICP and SQL gates compound harder than large improvements at the top. Lifting ICP-fit from 22% to 30% moves cost per closed-won more than negotiating the vendor CPL down by 20%. The leverage is inside the funnel, not on the invoice.
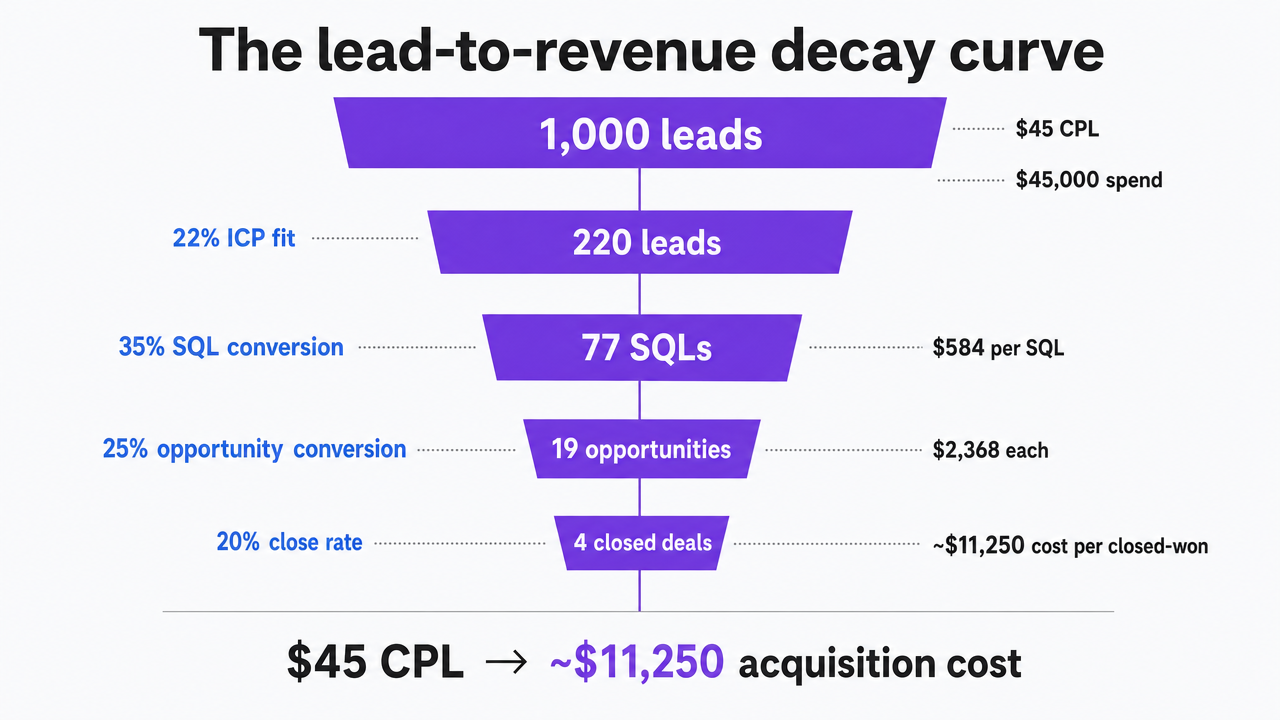 Show the worked decay example from the section, illustrating how a $45 CPL and 1,000 leads compresses to 4 closed deals at ~$11,250 cost per closed-won
Run a Live Content Syndication ROI Test
Measure actual pipeline impact from published content before committing to a long-term solution.
Attribution: giving syndication its correct weight, not its full credit
Why last-click and first-touch both distort the number
Syndication almost never earns a deal by itself. It shows up early, sometimes twice, and then hands the account off to sales enablement, webinars, direct outreach, or a paid search touch weeks later. Attribution models that assign 100% credit to a single moment misrepresent that reality in opposite directions.
First-touch overpays syndication. Any account that first appeared through a syndicated download gets full credit, including deals where every subsequent conversion driver came from another channel. Last-click underpays it. A syndication touch that seeded interest six months before close vanishes from the record entirely. Both models produce a number, and neither number is defensible in front of finance.
Last-click attribution is dead for long B2B journeys, and multi-touch or custom-weighted models are the working alternative 1. Syndication belongs inside that model as a weighted contributor, not as the hero of the deal or the invisible cost line.
A custom-weighted model that fits syndication's role
A workable weighting scheme starts by naming what syndication actually does: it delivers a top-of-funnel introduction to an ICP-fit account that would not otherwise be in the CRM. That role earns a fixed share of deal credit, typically in the 10% to 20% range, applied when a syndication touch appears in the attribution timeline before opportunity creation. The exact percentage is a policy decision the marketing and finance teams agree on once and hold constant.
The remaining credit distributes across the touches that carried the account through consideration and into a closed deal: sales-led conversations, product marketing content, demos, and any late-stage nurture. Tools like HubSpot, Marketo, Google Analytics 360, and Bizible can operationalize the model once the weighting rules are set 1.
Two constraints keep the model honest. Credit only counts if the syndication touch occurred before the opportunity was created; retroactive attribution to any download that happened to appear in the account's history inflates the number. And the weighting policy applies to every channel, not just syndication. Custom weights that flatter one program while penalizing another are not a model, they are advocacy.
Stage-matched scoring across the buyer journey
Not every syndicated asset should earn the same credit. A buyer's-guide download from an awareness-stage prospect and a vendor-comparison download from an in-market account signal different intent, and the weighting model should reflect that.
Forrester's guidance on buyer-journey content is to build a variety of assets for each stage of the journey and customer lifecycle 5. The attribution counterpart is stage-tagging every syndicated offer at the point of distribution: awareness, consideration, or decision. Consideration and decision-stage downloads earn a larger share of the syndication credit pool than awareness-stage assets, because they correlate more tightly with near-term opportunity creation.
The payoff is diagnostic. When one content offer consistently pulls its weight and another does not, the program has evidence, not opinion, for what to promote next quarter.
Quantifying the halo effect without overclaiming it
The halo effect is where syndication ROI stories tend to break. Marketers sense that syndicated content shortens sales cycles and lifts close rates on the accounts it touches, but the evidence is usually a hunch dressed up as a chart. The 2025 Content Attribution Report captures the tension directly: marketers want to quantify the halo effect content has on close rates and velocity, but most lack a defensible method 9. Without one, the halo becomes a rhetorical device rather than a line on the dashboard.
A workable method uses matched cohorts. Pull every opportunity created in the past four quarters where a syndication touch appears in the account's timeline before opportunity creation. Build a control cohort of opportunities from accounts with similar firmographic profiles, similar deal sizes, and similar entry channels, but no syndication touch. Then compare two figures across the cohorts: median sales-cycle length in days, and close rate from opportunity to closed-won.
If the syndication-touched cohort closes at 24% versus 19% for the control, and moves from opportunity to close in a median of 71 days versus 89, the halo is a specific delta rather than a claim. Both numbers plug back into Tier 3 and Tier 4 of the measurement stack: faster velocity reduces the working capital tied up in pipeline, and a higher close rate lowers the effective cost per closed-won.
Two cautions keep the method honest. The cohorts have to match on the variables that actually drive close rates, or the delta measures selection bias instead of syndication impact. And the analysis needs enough deal volume per quarter to reach statistical meaning; small samples produce large swings that flatter or damn the program at random. When the volume is thin, report the delta as directional and pool multiple quarters before treating it as evidence.
Sales feedback loops as a qualification input
Every ROI framework built without sales input eventually gets overruled by sales opinion. The way to avoid that outcome is to make sales feedback a structured input at Tier 2, not a hallway conversation after the quarterly review. Forrester's guidance on content marketing is direct on this point: sales has to be involved across content operations, and impact has to be measured with them, not at them 6.
The mechanism is a weekly disposition pass. Every syndicated lead that clears the ICP filter gets routed to an SDR or AE with three required fields: qualified, disqualified, or hold, plus a reason code and a free-text note. Reason codes stay short and stable across quarters:
- wrong role
- wrong timing
- wrong fit
- competitor evaluation
- active project
- no response after defined outreach
That coded feedback becomes structured data on the vendor scorecard.
Two patterns emerge quickly. Sources that produce high wrong-role or wrong-fit rates fail the ICP filter systematically and belong on a renewal watch list. Sources that produce high wrong-timing rates are delivering fit accounts too early in the buying cycle, which is a nurture problem rather than a vendor problem. The distinction matters at reallocation time.
Quantify Content Syndication ROI with Data-Driven Precision
Request a walkthrough of how leading teams benchmark, attribute, and forecast pipeline impact from syndicated content—using unified analytics tailored for enterprise-scale marketing operations.
Reallocation heuristics: when to renew, churn, or fix the content
Thresholds that justify continued spend
A syndication program earns its next quarter of budget when three numbers hold together at once. Cost per opportunity sits at or below the blended cost per opportunity of the next-best paid channel in the mix. ICP-to-SQL yield holds above the floor the sales team agreed to during program design, typically in the 25% to 40% band depending on offer maturity. And the halo delta measured through matched cohorts shows either a faster median sales cycle or a higher close rate on syndication-touched accounts, with enough deal volume behind the number to treat it as directional rather than noise.
Miss one of the three and the program is still defensible with a corrective plan. Miss two and the renewal conversation should include a spend reduction, not a flat rollover. The thresholds have to be written into the vendor scorecard before the quarter starts, because retroactive goalposts are how syndication programs quietly outlive their contribution.
Signals that the vendor, not the content, is the problem
The vendor is the failure point when the same content offer performs materially better through a different distribution source, or when the disposition data from Tier 2 clusters around wrong-role and wrong-fit codes rather than wrong-timing. Both patterns point at audience delivery, not asset quality.
A second signal is deteriorating list hygiene: duplicate records against the CRM, contacts who have already been through the funnel, or leads with unreachable email domains. A third is opacity. Vendors who cannot supply the segment-level breakdowns needed to run the ICP filter are refusing to be measured, and Forrester's argument that content marketing has to prove contribution to sales efficiency applies to the channels carrying that content as much as to the content itself 3.
Signals that the content, not the channel, is failing
The content is the failure point when performance is uniformly weak across two or more distribution sources with different audience compositions. If ICP-fit accounts are downloading the asset and then never engaging again, the offer is not carrying its stage weight. Stage-tagged attribution surfaces this quickly: awareness-stage assets that never touch consideration or decision-stage opportunities in the timeline are producing records, not progression.
A second tell is sales feedback that skews toward wrong-timing across sources. Fit accounts are arriving too early because the offer is pulling awareness-stage curiosity rather than in-market intent, which is a content and stage-matching problem 5. The fix is a new asset built for a later stage, not a new vendor.
If you manage syndication across multiple locations or portfolio companies
A note on audience before this section develops: the math above assumes a single P&L. Operators running syndication across a portfolio — an agency serving multiple clients, a DSO with dozens of practices, a senior living group across metros, a multi-office law firm — inherit a different problem. One program feeds many revenue lines, and the ROI story has to hold at both the program level and the location level, or the CFO conversation splinters into arguments about allocation.
The practical move is to run the four-tier stack once for the aggregate program and then again with spend and outcomes allocated per location or per portfolio entity. Allocation follows the variables the operator already tracks. Below is the shape of the worked example, using placeholder inputs rather than fabricated benchmarks.
| Variable | Program-level | Location A | Location B ||---|---|---|---|| Syndication spend | $S total | $S × share | $S × share || Gross leads | L | L_A | L_B || ICP-fit rate | % | %_A | %_B || SQL conversion | % | %_A | %_B || Opportunity conversion | % | %_A | %_B || Average contract value | $ACV | $ACV_A | $ACV_B || Sales cycle (median days) | D | D_A | D_B |
Two patterns show up once the allocation is honest. Some locations pull ICP-fit rates well above the program mean because their local sales team disposition leads faster, feeding cleaner signal back into Tier 2. Others carry the program's cost per opportunity while contributing a fraction of the closed-won. That is a reallocation signal, not a vendor signal — the syndication is working, the destination is not.
The four numbers to put on the CRO's dashboard
Strip the reporting down to what a CRO will read on a phone between meetings. Four figures carry the program:
- Cost per opportunity
- ICP-to-SQL yield
- Syndication-influenced velocity delta
- Net revenue ROI on a weighted-attribution basis
Every other syndication metric feeds one of them.
Cost per opportunity gives the channel a comparable price against paid search, events, and outbound. ICP-to-SQL yield tells the CRO whether the vendor is delivering the right accounts or just filling the top of the funnel. The velocity delta, measured through matched cohorts, quantifies the halo instead of asserting it. Net revenue ROI, calculated on the weighted share syndication actually earned, is the number finance will audit.
Report those four together, updated per quarter, with the underlying variables visible one click down. Downloads, MQL counts, and vendor-quoted CPLs belong in the working file, not the executive view. That discipline is what shifts syndication from a marketing expense in search of justification into a pipeline input with defensible economics.
Frequently Asked Questions
References
- 1.Data-Driven B2B SaaS Revenue Attribution Models - Mouseflow.
- 2.Best B2B Content Syndication Services for ROI in 2026 - LeadSpot.
- 3.Make Sales Efficiency A Key Addition To Your B2B Content Marketing Metrics.
- 4.B2B Marketing Leaders Don’t Trust Their Measurement.
- 5.The B2B Content Guide: High-Performing Campaigns Succeed Across the Buyer Journey.
- 6.The B2B Content Guide: Make Sales Your Ally In Content Marketing.
- 7.B2B Content: Experimentation Means Bold Bets And Cold Sweats.
- 8.AI Search Will Crack The Foundation Of B2B Marketing's Accountability Model.
- 9.The 2025 Content Attribution Report.
- 10.The State of B2B Marketing Measurement In 2023.