
Key Takeaways
- A blended site-wide organic conversion rate averages brand, informational, and commercial queries into one figure that hides whether content investment is producing incremental pipeline 10.
- A defensible metric has four fixed components: commercial-intent sessions in the denominator, scored qualified inquiries (forms and calls) in the numerator, landing-page attribution, and monthly CRM reconciliation 13.
- GA4, Search Console, and call tracking will never fully agree, so consistency of definition beats accuracy of any single tool, and last-click should be paired with an assisted-conversion view 2.
- Focus next on segmenting by query intent, treating calls as first-class conversions, and reporting on-page conversion rate independently of session volume as AI Overviews suppress clicks 8.
Why the Blended Number on Your Dashboard Is Wrong
The organic conversion rate most VPs report to their CRO is an average of averages. It combines a prospect searching a competitor comparison query, a returning customer typing the brand name into Google, and a student pulling a definition off a glossary page — then divides the whole thing by total organic sessions. The resulting percentage looks precise. It is almost never useful.
The peer-reviewed inbound marketing literature is clear on this point: conversion rate as a standalone KPI is insufficient without traffic source type, new versus returning visitor context, and keyword type and ranking layered on top 10. A single site-wide figure collapses all of those dimensions into one line item, which is why the number rarely moves in ways that correlate with pipeline. Brand queries convert at rates that have almost nothing to do with the content team's work. Informational queries convert at near-zero and drag the denominator. Commercial queries — the ones that actually fund the P&L — get buried in the mix.
Federal analytics guidance frames the discipline more bluntly: analytics should produce a clearer view of the cause-and-effect of online activity on sales and ROI, not just volume 1. A blended organic conversion rate fails that test. It reports volume dressed as outcome. The rest of this piece rebuilds the metric around what a VP actually owns: qualified inquiries from commercially intended organic traffic, reconciled against downstream revenue.
What a Defensible Organic Conversion Rate Actually Measures
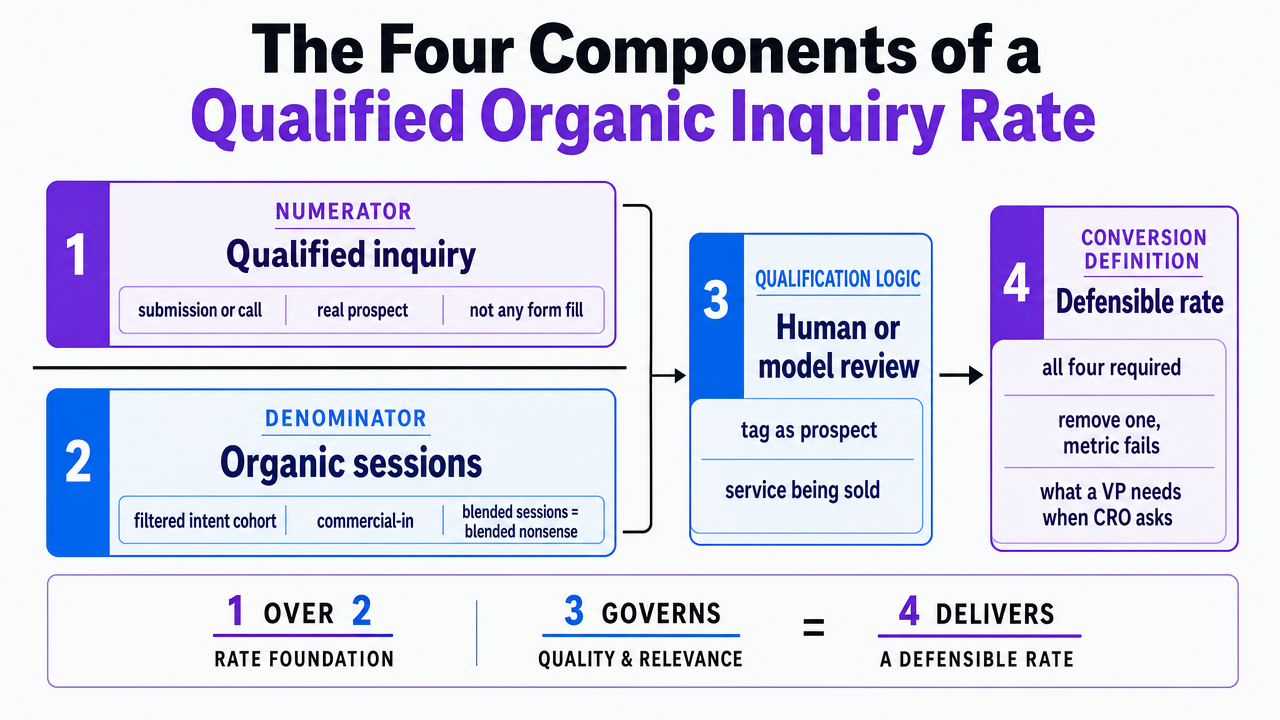
The Four Components of a Qualified Organic Inquiry Rate
A defensible organic conversion rate has four moving parts, and none of them are optional. Strip any one out and the number stops meaning what a VP needs it to mean when the CRO asks what the content team is actually producing.
- The numerator: a qualified inquiry, not any form fill. That means a submission or call that a human — or a call-scoring model — would tag as a real prospect for the service being sold. The peer-reviewed private-practice literature is direct about this in service verticals: the goal is to motivate a prospect to pick up the phone and make an appointment, and the site should be built around that specific action rather than generic engagement 13.
- The denominator: organic sessions filtered to the intent cohort being measured. Blended sessions produce blended nonsense. Commercial-intent sessions are the ones a growth team is paid to convert.
- The landing page that received the click. Attribution to the entry URL, not the site as a whole, is what makes the metric diagnostic instead of decorative. Federal analytics guidance frames this as narrowing reporting to a handful of high-level goals with SMART success metrics rather than a wall of dashboards 11.
- A reconciliation step against downstream CRM outcomes, so the inquiry rate can be trusted as a leading indicator of pipeline rather than an isolated site metric.
 Visualize the four non-negotiable components of a defensible organic conversion rate definition, directly supporting the section's framework
Segmenting by Query Intent Before Anything Else
Before a VP can defend a conversion rate, the traffic has to be split into cohorts that behave like different products. Brand queries, informational queries, and commercial queries are three different funnels wearing the same channel label.
The peer-reviewed inbound marketing work makes the operational case: the most relevant KPIs for SEO and SEM include conversion rate, new versus returning visitor differentiation, traffic source type, and keyword type and ranking — reported together, not in isolation 10. Layer on the click-behavior research and the picture sharpens. Keyword popularity is a primary determinant of consumer click behavior after a search, which means head terms and long-tail commercial terms attract structurally different visitors even when they land on the same page 6.
What that looks like on a real dashboard: a site reporting a blended 2.1% organic conversion rate might, when segmented, show brand queries converting at 8%+, commercial non-brand queries at 3%, and informational queries at under half a percent. The blended number rewards brand strength and hides whether the content team is doing anything. Split the cohorts and the diagnostic questions get sharp — is the commercial cohort growing, holding, or eroding, and is the informational cohort earning any measurable assist into commercial sessions later.
The practical move is to define at least three segments in GA4 or the warehouse: branded organic, commercial non-brand, and informational. Report conversion rate separately for each. Retire the site-wide figure from the executive deck. A single number that averages three unrelated funnels will never survive a competent CFO's follow-up question about where the growth actually came from.
Treating Calls as First-Class Conversions
Form-only measurement is a legacy of B2B SaaS reporting bleeding into verticals where it does not belong. In service categories — law firms, dental groups, home services, behavioral health, senior living — the phone remains the primary conversion event. A VP whose dashboard only counts form submissions is undercounting inquiries by whatever share of prospects still pick up the phone, which in most service verticals is not a rounding error.
The service-vertical literature is unambiguous on the mechanic: the objective is to motivate a prospect to call and book, and the site should be engineered around that specific behavior 13. That reframes the conversion event. A phone call from an organic session on a service landing page is not a supporting metric. It is the metric.
Two operational moves follow:
- Dynamic number insertion tied to the organic channel, so calls originating from organic sessions can be attributed to the query and landing page that produced them rather than lumped into a generic phone bucket.
- Qualification scoring on the call itself — a receptionist tagging outcome, or an AI transcription model classifying qualified versus non-qualified inquiries — so the numerator in the conversion rate reflects real prospects rather than wrong numbers, existing customers, and vendor solicitations.
Without both moves, form conversion rate and call conversion rate get reported in different meetings using different denominators, and nobody trusts either one.
Reconciling Sessions, Events, and Pipeline Across Three Sources of Truth
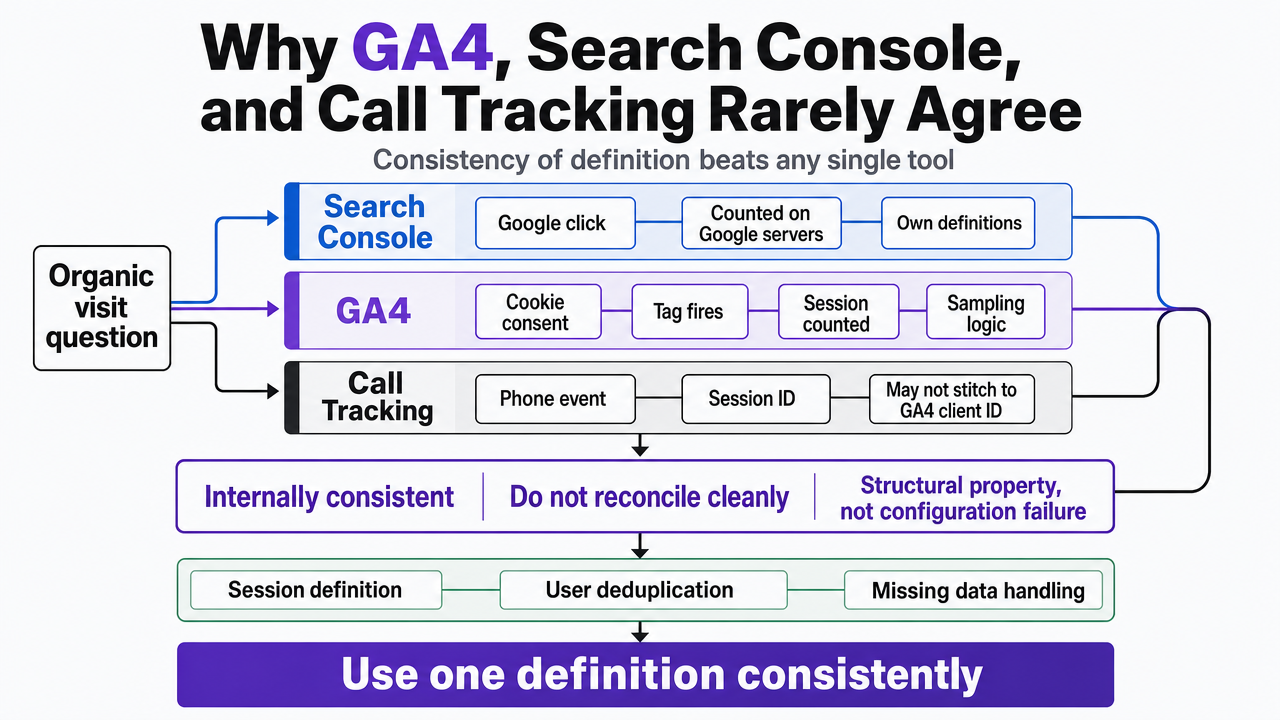
Why GA4, Search Console, and Call Tracking Rarely Agree
Ask three tools the same question about organic performance and get three different answers. Search Console counts clicks from Google's servers. GA4 counts sessions after cookie consent, tag firing, and its own sampling logic. The call tracking platform counts phone events against a session ID that may or may not stitch to the GA4 client ID. Each system is internally consistent. None of them reconciles cleanly with the others.
The peer-reviewed comparison of analytics platforms across one year of data from 86 websites found that standard interaction metrics diverge measurably between tools measuring the same site, the same visitors, and the same window 2. That is not a configuration failure. It is a structural property of how each platform defines a session, deduplicates users, and handles missing data. A VP who treats any single tool as ground truth will report a number that a competent analyst can dismantle in ten minutes.
The working reconciliation is a hierarchy, not an average. Search Console clicks anchor the top of the funnel because they measure what Google actually served. GA4 measures on-site behavior and event conversions with known sampling caveats. Call tracking measures the phone event tied back to session and source. The organic conversion rate reported to the board should pick one denominator — usually GA4 organic sessions — and one numerator — qualified inquiries from forms plus scored calls — and hold that pairing constant across reporting periods. Consistency of definition beats accuracy of any individual tool.
 Show the reconciliation hierarchy across three measurement tools, supporting the section's argument that consistency of definition beats accuracy of any single tool
Assisted Conversions and the Last-Click Understatement
Last-click attribution is the default in most executive dashboards, and it systematically undersells organic search. A prospect finds a service through an informational query, returns two weeks later via a branded search, and books through the paid ad served on their own brand name. Last-click credits paid. Organic did the work of introducing the brand and shaping the consideration set, and gets nothing on the scorecard.
The academic evidence on channel interaction is direct. Research on organic and sponsored search performance shows that organic competition decreases paid-search click performance but improves paid conversion performance and revenue — organic exposure is doing meaningful work inside sessions that get credited to paid 4. A separate analysis of the same interaction confirms that organic listings exert measurable positive effects on sponsored search outcomes rather than operating in isolation 5.
The operational fix is not to abandon last-click; it is to report two numbers. The last-click qualified organic inquiry rate, which the CFO wants because it is conservative and defensible. And a data-driven or position-based view from GA4 that shows organic's assisted contribution to conversions credited elsewhere. A VP who walks into a QBR with both numbers can defend organic investment when the paid team argues their conversion rate is higher. The assisted view usually shifts 15 to 40 percent of the credit story, and that shift is what protects budget when the board looks at channel ROI in isolation.
Adjusting for AI Overview Click Suppression
The traffic side of the equation is moving under everyone's feet. Pew Research reporting on AI summaries in Google search found that users who encounter an AI summary are less likely to click a traditional result and more likely to end the session inside Google's ecosystem 8. Impressions hold. Clicks fall. Sessions in GA4 fall. The organic conversion rate — if defined as conversions divided by sessions — often does not fall, and in some cases rises, because the sessions that still arrive are more filtered by the AI summary itself.
That reframing is the story a VP needs to tell before the CRO tells it wrong. Falling organic sessions read as a content team failure only if the metric that matters is sessions. When the metric is qualified inquiry rate on landing pages that receive commercial-intent clicks, a session decline paired with stable or rising on-page conversion rate is evidence that the traffic is qualifying itself upstream. The AI summary is doing the top-of-funnel screening that a lower-intent visitor used to do on the site.
Two reporting changes make this defensible:
- Split Search Console impressions and clicks by query cohort and track CTR decline separately for informational versus commercial queries — the suppression is not uniform.
- Report on-page conversion rate for commercial landing pages as a standalone tile, decoupled from session volume.
The board question shifts from "why is traffic down" to "is the traffic that still arrives more valuable per session," which is a question with a defensible answer instead of an apology.
Test Data-Driven SEO Conversion Tracking Now
Measure real pipeline impact from organic search using your own live campaign data before making a commitment.
Diagnostic: When the Reported Number Is Lying
Brand Contamination in the Organic Bucket
The fastest way to spot a dishonest organic conversion rate is to remove branded queries and watch what happens to the number. If the metric collapses, the content team has been taking credit for demand the sales team, the paid team, or the PR calendar generated. Branded organic sessions convert at rates that reflect intent already formed elsewhere, and folding them into the site-wide figure produces a KPI that moves with brand spend rather than with search work.
The inbound marketing evidence supports separating source type and keyword type in reporting rather than aggregating them 10. A VP who cannot answer "what is our non-brand organic conversion rate this quarter" is reporting a number that will drift with brand activity and mask whether the content investment is producing incremental pipeline. Cut the brand terms out of the denominator and the numerator, and report the two rates side by side.
Form Spam, Bot Fills, and Event Drift
A reported conversion rate that trends up without a matching move in CRM opportunities is usually not a win. It is spam, duplicate event firing, or a tag that started counting scroll depth as a lead. The numerator quietly inflates while the sales team keeps calling the same qualified pipeline volume, and the gap between marketing's dashboard and revenue's ledger widens each month.
Federal analytics guidance is direct about the discipline required here: analytics should produce a clearer view of cause and effect between site activity and revenue, not just count events 1. Two audits catch most of the damage:
- Reconcile monthly form submissions against CRM records tagged as real prospects and calculate the qualified share — if it drops, the numerator is polluted.
- Re-audit conversion event definitions in GA4 quarterly, because tag deployments drift and a "lead" event added six months ago may now fire on a newsletter subscribe.
Tool Drift Between GA4 and Search Console
Search Console reports clicks. GA4 reports sessions. The two numbers should be in the same neighborhood for organic traffic, and when they diverge by more than a modest margin, something is wrong upstream of the conversion rate — usually consent-mode dropping, cross-domain tracking broken, or a tag that stopped firing on a template refresh.
The peer-reviewed comparison of analytics platforms across 86 websites over a year documented that standard interaction metrics differ measurably between tools measuring the same site 2. Some drift is expected. Persistent, widening drift is a signal. The operational check is a monthly reconciliation: Search Console organic clicks versus GA4 organic sessions for the same date range, filtered to the same country and device split. When the ratio moves more than a few points quarter over quarter, the conversion rate downstream is being calculated on a denominator that is silently changing shape, and the trend line reported to the board is measuring instrumentation, not performance.
If You Manage Multiple Locations: Reading a Portfolio Number
How a Site-Wide Rate Hides Per-Location Performance
For VPs running organic across a portfolio — dental groups, law firm networks, home services multi-unit brands, senior living operators — the site-wide conversion rate is worse than a bad number. It is a rank-ordering problem. A blended 2.4% across forty locations masks that eight of them are converting organic traffic at 5%+ and six are converting at under 1%, and the marketing budget follows the average instead of the outliers.
The peer-reviewed inbound marketing work applies here without modification: conversion rate is only diagnostic when reported alongside traffic source type, keyword type, and — for portfolio operators — the location cohort receiving the click 10. Federal digital experience guidance frames the prioritization mechanic more explicitly, recommending that portfolios be ranked by traffic, strategic importance, and resource availability rather than treated as a uniform asset 7. A blended rate does the opposite. It flattens the portfolio into a single tile and hides the locations where content and landing-page investment would actually move the number.
The reporting move is to break the metric out by location cohort and compare the segmented rate against the blended one. Illustrative shape:
| Location Cohort | Organic Sessions | Reported Rate (Blended) | Qualified Inquiry Rate (Segmented) | Delta |
|---|---|---|---|---|
| Top quartile | X | 2.4% | Y% | +Z pts |
| Middle two quartiles | X | 2.4% | Y% | ~0 |
| Bottom quartile | X | 2.4% | Y% | −Z pts |
Once the bottom quartile is visible, the diagnostic questions get concrete: are those locations receiving commercial-intent traffic that fails to convert, or informational traffic that was never going to. The answer routes budget to landing-page work in one case and to keyword-mix correction in the other. The blended rate cannot tell the difference.
See How Leading Teams Quantify SEO Conversion—Beyond Traffic Metrics
Request a walkthrough of advanced SEO conversion measurement frameworks and see real examples of pipeline impact for enterprise marketers managing high-stakes, multi-channel campaigns.
Leading Indicators That Move Qualified Inquiry Rate
Qualified inquiry rate is a lagging number. By the time it moves on a monthly dashboard, the content, landing-page, and query-mix decisions that produced the move are two quarters old. VPs who want to manage the metric rather than report on it need a short list of leading indicators that predict where the rate is heading before the CRM catches up.
Three earn their place:
- Engagement quality on commercial landing pages — time on page, pages per session, and bounce rate — functions as a proxy for whether the traffic that arrives is finding what the query promised. The web-analytics methodology literature treats those signals as first-class KPIs rather than diagnostic afterthoughts 3. When engagement on commercial pages erodes, conversion rate follows within a reporting cycle or two.
- Landing-page content quality is the second. Peer-reviewed work on ad landing pages shows that text readability analysis can predict conversion rates, meaning the page itself carries measurable conversion signal independent of traffic source 12. A readability audit on the top twenty commercial URLs will surface pages that rank but do not convert.
- Query-mix drift in Search Console. If the share of impressions from commercial-intent queries falls quarter over quarter while informational impressions grow, the qualified inquiry rate will compress even if nothing on the site changes — because keyword popularity and query type reshape click behavior at the SERP before a visitor ever lands 6. Watch the mix, not just the totals.
A Board-Ready Definition VPs Can Adopt Verbatim
The metric that survives a CFO's follow-up question fits in a single sentence: Qualified Organic Inquiry Rate is the share of commercial-intent organic sessions on a designated landing page that produce a scored qualified inquiry — form or call — reconciled monthly against CRM opportunity records. Four components, none negotiable. Commercial-intent segmentation in the denominator, so brand and informational traffic stop distorting the number 10. A scored qualified inquiry in the numerator, so form spam and non-prospect calls do not inflate the count 13. Landing-page attribution, so the rate is diagnostic rather than decorative 11. And a CRM reconciliation cycle, so marketing's ledger and revenue's ledger cannot drift apart unnoticed 1.
Reported alongside that headline number: the assisted-conversion view, the non-brand rate, and the CTR-versus-conversion-rate split by query cohort. Four tiles. One definition. A board deck that can be defended line by line, and a call-intelligence layer — the kind that reads recorded calls and tags qualified inquiries automatically — is what makes the numerator honest at portfolio scale without adding headcount to score every call by hand.
Frequently Asked Questions
References
- 1.How to Use Website Analytics Strategically.
- 2.Measuring user interactions with websites: A comparison of two analytics platforms.
- 3.Methodological Guidelines for Systematic Assessments of Health Information Websites.
- 4.Do Organic Results Help or Hurt Sponsored Search Performance.
- 5.Analyzing the Relationship Between Organic and Sponsored Search.
- 6.Consumer Click Behavior at a Search Engine: The Role of Keyword Popularity.
- 7.21st-century IDEA implementation guidance.
- 8.Google users are less likely to click on links when an AI summary appears in search results.
- 9.Developing a conversion rate optimization framework for digital retailers.
- 10.Digital inbound marketing: Measuring the economic performance of SEO and SEM techniques.
- 11.DAP Learning Series: Site Analysis, Live! - Digital.gov.
- 12.Conversion Rate Prediction Based on Text Readability Analysis of Ad Landing Pages.
- 13.Digital Marketing for Private Practice: How to Attract New Patients.