
Key Takeaways
- Structure SEO reports in three tiers: executive (qualified pipeline, CPA, revenue contribution), marketing diagnostics for channel decisions, and operator query data placed in the appendix 11.
- Last-click organic attribution fails executive scrutiny; treat attribution as a governance problem by integrating CRM, revenue systems, and agreed funnel definitions across sales and finance 9.
- In service verticals, phone calls carry the high-intent pipeline and must enter the funnel with the same identifier, qualification standard, and checkpoint applied to digital touches 9.
- Build each report around three decisions the executive must make this period, and consolidate multi-location retainers into one portfolio dashboard with drill-down on outliers 7.
Why CFOs Stop Reading at Page Two
Deloitte's 2026 CMO Survey, drawing on more than 300 senior marketing leaders, found that board-level pressure to prove marketing's financial impact has intensified, with CMOs increasingly required to show how investments drive profitable growth in measurable ways 3. That pressure travels downstream. The CFO scanning an agency's monthly SEO report does not care that average position improved from 14.2 to 9.8. They want to know whether the retainer produced qualified pipeline this month, and whether it produced more of it per dollar than last quarter.
Most monthly SEO reports fail this test on page one. They open with traffic charts, keyword movement tables, and backlink acquisition counts, then bury revenue-adjacent metrics behind ten pages of practitioner data. McKinsey's analysis of C-suite analytics deployments is direct about why this collapses executive confidence: successful measurement strategies use metrics that are "detailed and logically connected to business outcomes," with dashboards that ladder up rather than sprawl sideways 2.
Agency owners running retainers for law firms, DSOs, behavioral health groups, and home services operators face a sharper version of this problem. The managing partner approving the invoice is not the marketing director who briefed the work. The report has to defend itself in a room the agency is not in.
The fix is not a prettier dashboard. It is a different organizing principle: build the report for the decision the executive has to make, and treat everything else as appendix.
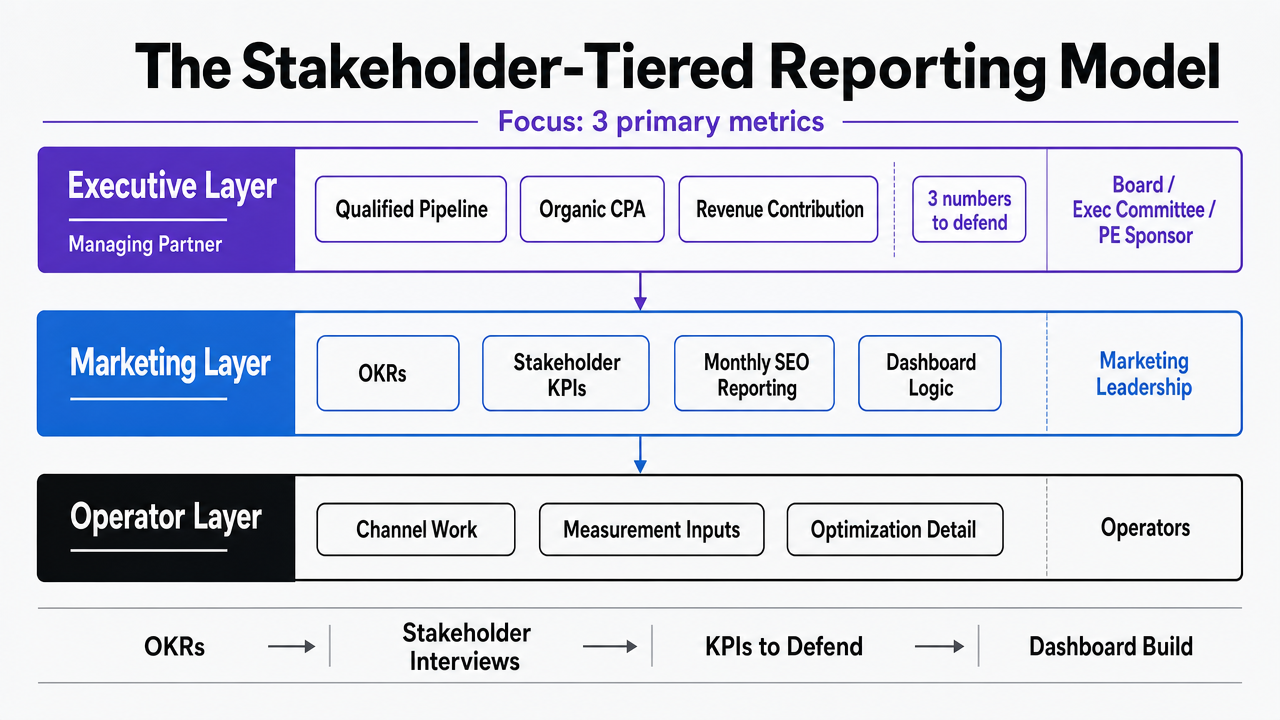
The Stakeholder-Tiered Reporting Model
Executive Layer: Three Numbers a Managing Partner Will Defend
Forrester's structured framework for marketing analytics starts with OKRs, then interviews stakeholders to identify the KPIs each one will defend in their own meetings, then builds dashboards that demonstrate marketing's contribution to growth 11. Applied to SEO monthly reporting, that sequence produces a top tier with three numbers, not thirty: qualified pipeline attributable to organic search, cost per acquisition for organic-sourced opportunities, and revenue contribution from organic-driven closed business.
The discipline matters because the managing partner reading the report is going to repeat those numbers verbatim to a board, an executive committee, or a private equity sponsor. If the agency hands them six secondary metrics alongside the three primary ones, the wrong number gets repeated, and the next conversation starts in a defensive posture.
McKinsey's C-suite analytics analysis describes successful measurement strategies as ones where "the metrics are detailed and logically connected to business outcomes," with dashboards built so each metric ladders up rather than competing for attention 2. The executive layer of an SEO report is the apex of that ladder. Qualified pipeline answers whether the retainer produced opportunities the sales team can work. CPA answers whether the channel is becoming more or less efficient relative to other acquisition sources. Revenue contribution answers whether organic search is meaningful enough to defend at all.
For a law firm's managing partner, that translates to: signed engagement letters traceable to organic, average cost per signed matter from organic, and revenue booked. For a DSO's COO, it is new patient appointments, cost per new patient, and net production from organic-sourced patients. The structure is identical. The unit changes.
Marketing Layer: What the VP of Marketing Actually Argues About
One tier down, the audience changes. The VP of marketing or marketing director is the person who briefed the retainer, owns the channel mix internally, and has to defend organic against paid, events, and outbound when budget conversations get tight. This reader does not need the executive layer's three numbers explained. They need the working metrics that diagnose whether organic is on track to hit them.
Forrester's analytics landscape guidance is explicit that measurement should be prioritized by revenue impact and bounded by clear scope across channels and tactics 12. The marketing layer is where that prioritization shows up. Channel-level conversion rate, content velocity against the editorial plan, branded versus non-branded performance, and pipeline movement by topic cluster all belong here. So does a comparison against the prior quarter, since the marketing director is the one who will be asked whether the trend is improving or stalling.
The Harvard Business School Online definition of marketing analytics frames the discipline as tracking and analyzing data to improve customer experience, increase ROI, and guide future strategy 1. The marketing layer is where that guidance happens. It is also where the retainer's strategic choices, which clusters to invest in, which intent to chase, which pages to retire, get argued and approved.
Operator Layer: Query and Page Data Belong in the Appendix
The bottom tier is where most monthly reports begin, and where most executive readers stop. Query-level impressions, click-through rate, average position, and landing page performance are the raw material of SEO work, but they are not the argument for renewing the retainer. They are the evidence that the work happened and is producing the signals it should.
Ohio University's documentation on the Google Organic Search Report describes how query-level data, impressions, URL clicks, CTR, and average position, supports decisions about content optimization and keyword targeting 14. That description is precise about what this data is for: optimization decisions. Iowa's Search Console guidance reinforces the same point, noting that high-impression, low-click queries identify content gaps and refresh opportunities 5. Both are operator-layer activities.
Putting that material in an appendix is not a demotion. It is a placement decision. The SEO lead working the account needs query-level visibility to do the job. The agency's account director needs it to defend specific tactical choices when the marketing director asks why a particular cluster moved. The CFO does not. Burying it on page two of an executive report buries the three numbers that justify the invoice.
The appendix gets read by the people who already trust the work. The executive summary gets read by the people deciding whether to keep paying for it.
 Visualize the three-tier reporting model (Executive, Marketing, Operator) which is the central framework of this section, showing what metrics belong in each layer and who consumes them
Closing the Attribution Credibility Gap
Why Last-Click Organic Fails the CFO Test
A CFO reviewing an SEO retainer is running a simple test: can this channel's contribution be defended in the same terms as paid search, outbound, or events? Last-click organic, the default attribution model in most monthly reports, fails that test on contact. It assigns full credit to the final session before conversion, ignores the touches that produced the consideration, and excludes any conversion that closed off-platform, which in service verticals is most of them.
The peer-reviewed analysis of the marketing analytics literature is direct that structural issues in measurement, not data volume, are what prevent analytics from creating executive confidence 8. Last-click is one of those structural issues. It produces a number that is mathematically defensible inside Google Analytics and indefensible the moment a managing partner asks whether the organic-attributed engagement letter started with a blog post six weeks earlier.
The BlueSnap attribution case study reaches the same conclusion from the operator side, recommending stronger data integration and governance to connect activity across the funnel rather than relying on terminal-touch reporting 9. For an agency defending a retainer, the consequence is concrete. A report that shows 47 organic conversions last-click and nothing about the assist path will lose the room to a paid channel that has built an end-to-end attribution story, even when organic is producing more pipeline.
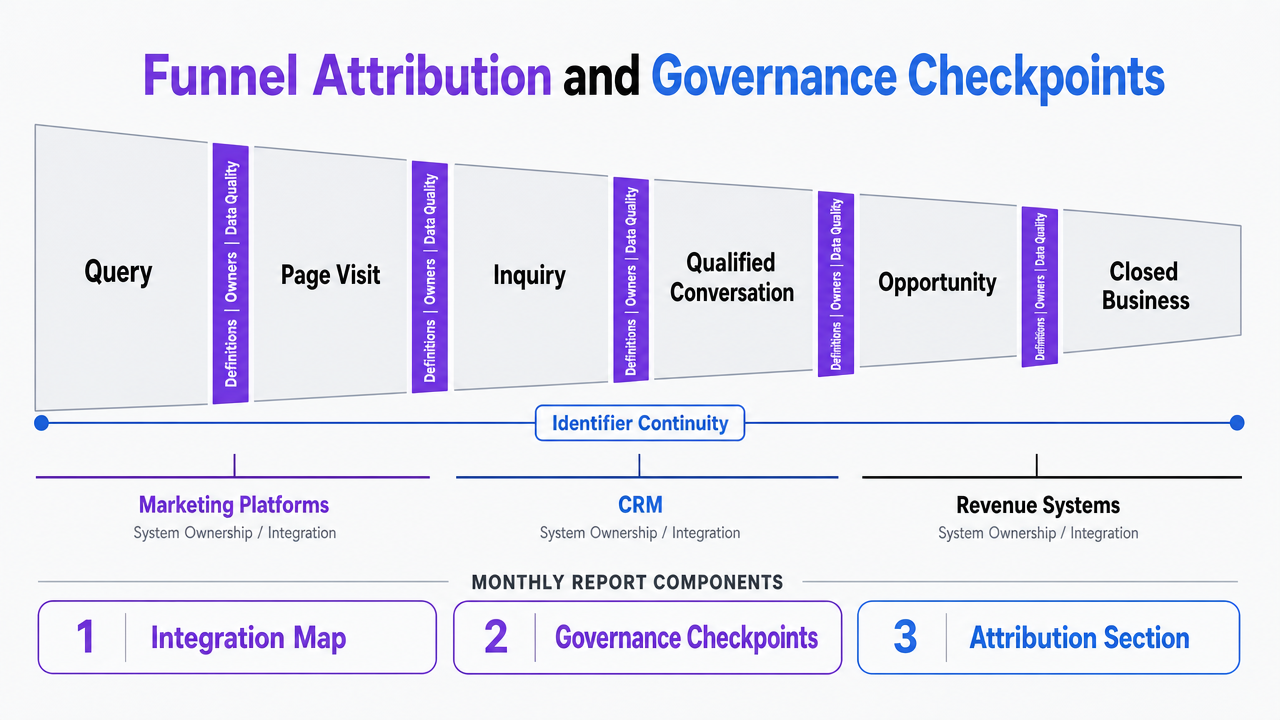
Funnel Attribution and Governance Checkpoints
The BlueSnap case study reframes attribution as a governance problem rather than a model selection problem 9. The recommendation is not to pick a better algorithm. It is to strengthen the integration between marketing platforms, CRM, and revenue systems so each organic search touch can be traced through the stages a buyer actually moves through: query, page visit, inquiry, qualified conversation, opportunity, closed business 9. Governance checkpoints sit between those stages to confirm definitions, owners, and data quality before the number reaches a report.
For an agency, that means the monthly report's attribution section has three explicit components.
- The integration map: which systems hold which stage's data, and how organic-sourced records carry an identifier from first touch through to revenue.
- The definition layer: what qualifies as an inquiry, what qualifies as an opportunity, and who signed off on those definitions.
- The checkpoint log: where data was reviewed this month, what was corrected, and what exceptions remain open.
McKinsey's C-suite analytics work reinforces the same logic from the executive side, noting that accountability for value capture should rest with the business owners of the bottom line, not just the analytics team 2. Translated into SEO reporting, that means the CFO and the head of sales need to agree the funnel definitions before the agency reports against them. Otherwise the monthly number is the agency's number, not the company's number, and it gets discounted accordingly.
Governance is unglamorous on a slide. It is also the difference between an attribution figure the CFO repeats and one they qualify.
 Visualize the governance-based attribution workflow described in this section, showing the funnel stages and governance checkpoints between them as referenced from the BlueSnap case study
Tagging the Phone Call: Qualified-Lead Signals in Service Verticals
In law, dental, behavioral health, senior living, and home services, the conversion event that matters is a phone call, not a form fill. An SEO report that counts form submissions and ignores calls is reporting on the smaller half of the pipeline. Worse, it is reporting on the half that skews toward lower-intent inquiries, since high-intent buyers in these verticals reach for the phone.
Integrating call data into the attribution funnel requires the same governance discipline the BlueSnap case applies to digital touches: a consistent identifier from organic session to call record, a definition of what qualifies, and a checkpoint where the qualification is confirmed 9. Call intelligence platforms read recorded calls, tag qualified inquiries against the agreed criteria, and flag missed opportunities where intake handling lost a viable lead. That tagging layer is what turns raw call volume into a qualified-lead metric the marketing layer of the report can defend.
The operational consequence for the agency is direct. The executive summary's qualified pipeline figure now includes calls, weighted by the same qualification standard the sales team uses. The marketing layer shows which content clusters and landing pages produced the calls. The operator layer surfaces the queries that drove the sessions before the calls happened. The three tiers connect, and the retainer's contribution stops disappearing into a phone system the report never opened.
Test SEO reporting workflows before executive review
Produce and share real monthly SEO reports to validate executive-ready insights risk-free before committing.
The Report as a Governance Artifact
Decisions the Report Should Enable This Month
An executive does not renew a retainer because a chart moved up and to the right. They renew because the report in front of them clarified a decision they were already going to make: where to put the next dollar of acquisition spend, which practice area or service line to invest behind, whether to expand or pause the engagement. Forrester's analytics framework treats this as the point of the exercise, urging marketers to build dashboards that demonstrate marketing's contribution to growth and to involve finance and other stakeholders so the numbers are credible when the budget conversation starts 11.
A monthly SEO report that functions as a governance artifact opens with the decisions it is asking the executive to make this period. Three is usually enough.
- Approve continued investment in a content cluster that is producing qualified pipeline at a lower CPA than paid.
- Reallocate budget away from a service line where organic demand has plateaued.
- Sign off on a technical fix that requires development time the marketing team does not control.
Each decision carries the supporting evidence directly underneath it, not buried twelve pages back. The peer-reviewed marketing analytics literature is blunt that structural reporting problems, not data scarcity, are what prevent analytics from creating executive confidence 8. Framing the report around decisions resolves the structural problem. The executive arrives at a page that tells them what they are being asked to approve, why, and what happens next.
The Quarterly Renewal Conversation Starts in January
Agency owners who treat the December report as the renewal conversation have already lost ground. The renewal is decided across the prior nine months of reports, each one reinforcing or eroding the case. McKinsey's C-suite analytics work makes the point from the inside of large organizations: accountability for value capture rests with the business owners of the bottom line, and the analytics layer earns standing by connecting metrics to outcomes month after month, not by producing a year-end deck 2.
That continuity changes how the January report is built. It introduces the year's three executive KPIs, the funnel definitions the CFO and head of sales have agreed to, and the governance checkpoints that will appear in every subsequent report. February through November carry those same elements forward, with the decisions and outcomes accumulating as a record. By the time the renewal discussion happens, the managing partner is not evaluating a single month. They are reviewing a documented decision history the agency authored alongside them.
Retainers survive on that record, not on the final slide.
If You Manage Multi-Location Retainers: Consolidating Fragmented Reports
Where Per-Location Reporting Erodes Executive Confidence
This section is for agency owners running retainers across portfolios of ten or more locations, where the executive audience is a multi-location COO, a director of marketing operations, or a private equity sponsor reviewing performance across a platform investment. The reporting problem at that scale is different in kind, not just in degree.
A typical multi-location SEO engagement produces one report per location, each with its own traffic chart, its own keyword movement, and its own conversion summary. The COO opens a deck that is forty pages long before the first cross-portfolio comparison appears. By location twelve, the executive has stopped reading and started skimming for outliers. By location twenty, the deck has lost the room.
The Minnesota digital marketing audit identified this fragmentation as a structural reporting failure and recommended a central dashboard that summarizes performance against the highest-priority KPIs, rather than a stack of channel- or unit-level reports competing for the same attention 7. The audit's reasoning is the same one McKinsey applies to C-suite dashboards: when metrics do not ladder up to a small number of business-outcome views, executives lose the thread and discount the underlying work 2. For a multi-location retainer, the discount lands directly on the agency's invoice.
The Consolidation Math Behind a Single Executive Dashboard
The case for consolidation is operational before it is strategic. Per-location reporting consumes agency hours that the retainer is not separately billing for, and it does so in a structure the executive audience already rejects. The Minnesota audit's recommendation for a centralized KPI dashboard reframes that effort as a single artifact with location-level drill-down available on demand, not as the default view 7.
The math is straightforward enough for an agency owner to plug into their own variables. The comparison below uses locations, hours per report, internal hourly cost, and review cycles as the operating inputs.
| Variable | Fragmented Per-Location Reporting | Consolidated Executive Dashboard |
|---|---|---|
| Reports produced monthly | 1 per location (N locations) | 1 portfolio report + drill-down views |
| Production hours | N × hours per location report | Fixed dashboard build + incremental per-location data refresh |
| Internal review cycles | Per-location marketing manager + portfolio review | Portfolio review only, with drill-down on flagged locations |
| Executive attention required | Reads decline after the first several locations | Three executive KPIs, drill-down on exceptions |
| Cost to agency | N × hours × internal hourly rate | Fixed build cost amortized across the retainer |
The dashboard does not eliminate location-level data. It demotes it to a drill-down layer the COO opens when the portfolio view surfaces an outlier. That structure mirrors the tiered model already established for single-client reporting, applied across a portfolio: three executive KPIs at the top, channel and content performance in the middle, query and page data underneath 7. The agency that consolidates first stops losing the room at location twelve, and starts having a renewal conversation grounded in portfolio outcomes rather than a stack of location decks the executive never finished.
Surface Executive-Ready SEO Insights Without Manual Reporting Overhead
See how leading agencies automate monthly SEO reporting to deliver actionable, KPI-focused updates that drive executive alignment—while reducing time spent on data prep and presentation review.
What Enterprise Executives Already Expect from SEO Leadership
The Gartner Director of SEO role is described as owning end-to-end SEO performance across the organization's digital ecosystem, setting strategy, and reporting results to senior stakeholders across the business 13. That job description is a useful mirror for agency owners. It documents what the enterprise side of the table already expects an SEO function to deliver: strategic ownership tied to business goals, cross-functional reporting, and a defensible connection between organic activity and outcomes the C-suite tracks.
An agency retainer is being measured against that bar whether or not the executive says so. When the report arrives, the managing partner or COO is implicitly comparing the deliverable to what an in-house director would produce: three executive KPIs tied to revenue, a marketing-layer view that supports channel decisions, and an operator layer the practitioner team uses to do the work. The Harvard online course on marketing analytics frames the same expectation from the leadership development side, emphasizing metrics that drive strategic decisions across product, brand, and communications functions rather than channel-isolated dashboards 10.
Agencies that report to that standard renew. Agencies that report below it spend renewal conversations explaining the gap.
Building the One-Page Executive Summary
The one-page executive summary is the only page of the monthly report that some readers will open. It has to carry the renewal argument by itself. The structure that holds up under that pressure is narrow and consistent:
- A header that names the three executive KPIs and the period.
- A results block that shows the current month against the prior month and the year-to-date trajectory.
- A decisions block that lists what the executive is being asked to approve.
- A footnote naming the funnel definitions and governance checkpoints in force.
Forrester's framework supports this compression directly, urging dashboards that demonstrate marketing's contribution to growth rather than dashboards that catalogue activity 11. The qualitative analysis of the marketing analytics literature reaches the same conclusion from the other direction, identifying structural reporting problems, not data scarcity, as the reason analytics fails to produce executive confidence 8.
Everything else in the report exists to defend the one page. Marketing-layer views answer the VP's follow-ups. Operator-layer data answers the practitioner's. The one page answers the only question that decides the retainer: is the channel working, and what should we do next.
Frequently Asked Questions
References
- 1.What Is Marketing Analytics?.
- 2.Advanced analytics: Nine insights from the C-suite.
- 3.2026 CMO Survey | Deloitte US.
- 4.Website and Social Media Analytics - CSUSM.
- 5.Work with Google Search Console | Digital Experience - Iowa.gov.
- 6.Content Plays | USDA.
- 7.DIGITAL MARKETING AUDIT.
- 8.A qualitative analysis of the marketing analytics literature - PMC.
- 9.Strengthening Marketing Attribution Across the Funnel at BlueSnap.
- 10.Marketing Analytics: Strategies for Driving Business Results.
- 11.Use Marketing Analytics To Support Your 2023 Marketing Strategy.
- 12.A Guide For Understanding The Marketing Analytics Landscape.
- 13.Director, SEO - Gartner Careers.
- 14.How to Use the Google Organic Search Report.