
Key Takeaways
- Treat content as a buyer-decompression system built around the committee, not the funnel, since roughly 68% of complex B2B journeys happen outside supplier interactions 11.
- Lock framing, vocabulary, and proof points across web, sales, and partner channels — information consistency drives a 2.8x lift in high-quality, low-regret deals 10.
- Replace marketing-sourced pipeline, still on 47% of dashboards, with an influence, velocity, and deal-quality stack that credits every committee touch, not just first-touch form fills 14.
- Spend the next quarter auditing message coherence, rebuilding measurement, and shipping the missing internal selling tools — ROI models, procurement FAQs, champion briefs — through approval-first execution.
The 17% Problem: Why More Content Isn't Producing More Pipeline
A Gartner survey of 750 B2B buyers running complex purchases found that just 17% of the total buying process is spent meeting with potential suppliers, and 77% of those buyers described their last purchase as very complex or difficult 12. The implication for marketing VPs is direct: the program is not failing because it produces too little. It is failing because most of what it produces is aimed at the thin slice of the journey where a seller is actually in the room.
The remaining 83% looks nothing like a funnel. Buying committees loop between internal debates, peer conversations, vendor research, and quiet reconsideration. Procurement loops back to security. Finance returns to ROI assumptions a third time. A champion forwards a deck to a skeptic and the deal stalls for three weeks. None of this is captured in an MQL count, and almost none of it is influenced by another top-of-funnel blog post.
Production volume has become the default response to a pipeline gap. It is also the wrong one. When buyers spend most of their time decompressing complexity on their own, content earns pipeline by making that private work easier — not by intercepting more strangers at the top.
The rest of this article treats that 83% as the actual job. It examines how committees decide, why message coherence outperforms output, why marketing-sourced metrics misread the program's contribution, and how to run the operation without adding headcount to keep up.
Reframing the Job: Content as a Buyer-Decompression System
The Committee, Not the Funnel, Is the Unit of Work
A funnel assumes one decision-maker moving through ordered stages. A committee assumes five to ten people moving through overlapping ones, often in conflict, on different timelines. The funnel model produces content for a buyer who does not exist on enterprise deals.
Gartner's analysis of complex B2B purchases puts supplier interactions at roughly 32% of the journey, with the remaining 68% spent on independent research, internal debate, and peer input 11. That two-thirds is not a passive gap waiting for retargeting. It is the active work of a committee trying to agree on whether the problem is real, whose budget pays for it, and which option will not get someone fired.
This changes what a content asset has to do. A blog post optimized for an individual researcher's keyword can drive sessions while contributing nothing to the conversation happening inside the buyer's Slack channel. The asset that moves the deal is the one a champion can forward to a finance lead without rewriting it, or the comparison framework a security reviewer can paste into a procurement doc.
The practical reframe is to stop asking what stage of the funnel a piece supports and start asking which role on the committee it equips, and what that role needs to say next to the other four people in the room.
What Buying Committees Actually Do With the 68% You Don't See
Most of the invisible 68% is spent making sense of complexity, not evaluating vendors. Gartner's survey of 750 B2B buyers found that 77% described their last purchase as very complex or difficult 12. Complexity here is not a feeling — it is rework. Specs get rewritten. Stakeholders get added. Requirements drift. The committee circles back to questions it thought were closed.
Inside that loop, buyers do four things repeatedly:
- they reframe the problem in the language of whoever joined the conversation last,
- they hunt for outside validation that their direction is defensible,
- they build internal artifacts (one-pagers, comparison grids, ROI models) to align the group,
- and they stress-test the leading option against objections from absent stakeholders.
Content earns its place by being useful inside that loop. Edelman and LinkedIn's thought leadership research shows decision-makers want material that helps them understand their challenges, with concrete guidance and proof points they can use 8. That is a description of working material, not awareness material. The content that gets cited in an internal deck is the content that did the committee's reframing work for them — naming the problem precisely, scoping it honestly, and offering a defensible way to think about trade-offs.
Committee-Stage Content Replaces Funnel-Stage Content
Funnel-stage content sorts assets by buyer awareness: top, middle, bottom. Committee-stage content sorts assets by the job the committee is trying to finish: framing the problem, justifying a vendor shortlist, and equipping a champion to sell the decision internally.
Problem framing assets define the category in terms the buyer's own leadership will accept. They include diagnostic frameworks, cost-of-inaction analyses, and benchmarks against peer programs. Their job is to make the problem worth solving this quarter rather than next year.
Vendor justification assets compare approaches, not feature lists. They explain why a buyer would choose a category of solution over its alternatives and what the trade-offs look like in operation. Harvard Business Review's argument for data-driven content applies directly here: proprietary data and original analysis differentiate these assets from the generic comparison posts that saturate search 13.
Internal selling tools are the most under-produced category and the highest-leverage one. They include ROI calculators a finance lead can run, security and procurement FAQs a reviewer can attach to a ticket, and short executive summaries a champion can forward without editing. These assets do not generate leads. They close them, by moving conversations the sales team is not invited to.
A content roadmap built on these three jobs typically produces fewer assets than a funnel-stage map. That is the point. Each piece is built to be used by a specific role in a specific conversation, not to fill a calendar slot.
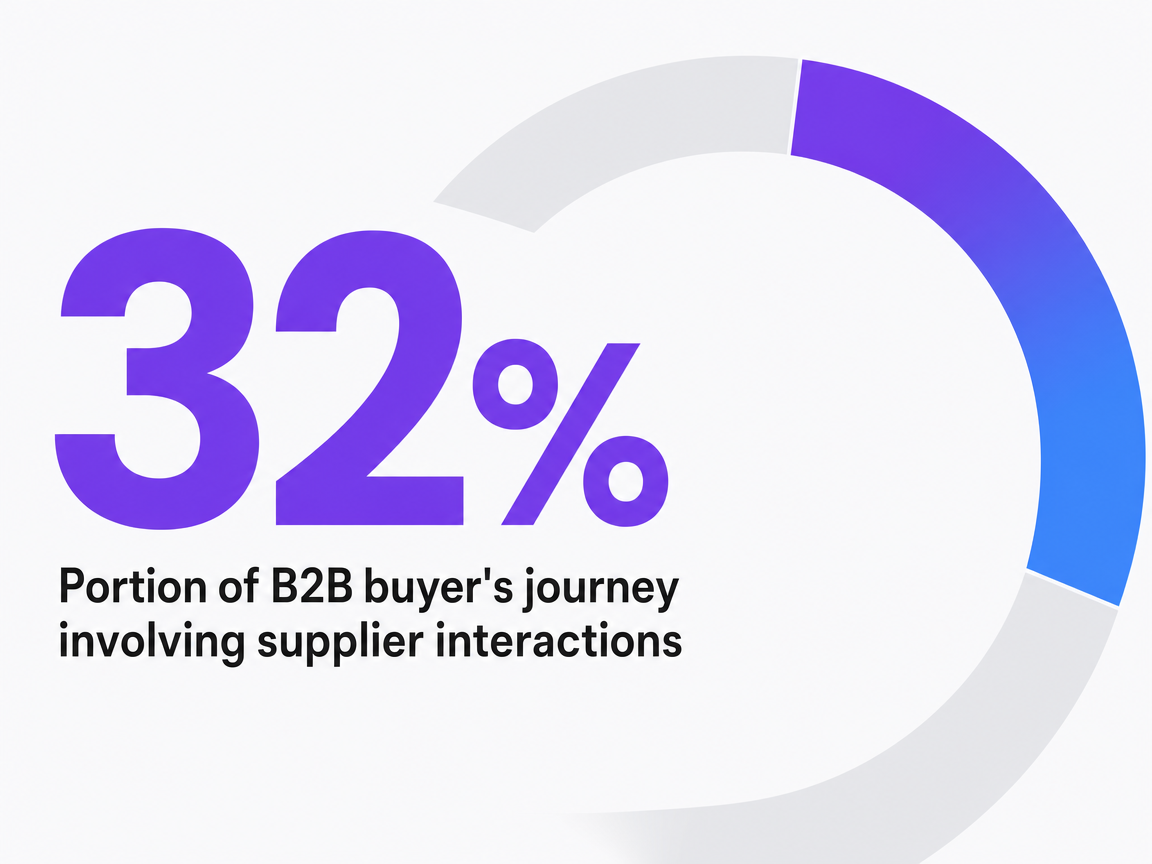 Portion of B2B buyer's journey involving supplier interactions
Portion of B2B buyer's journey involving supplier interactions
Test AI-driven B2B content execution this week
Experience full-funnel B2B content production and see measurable impact on your pipeline in one week.
Message Coherence: The 2.8x Multiplier Most Programs Miss
Why Information Consistency Outperforms Production Volume
Gartner's analysis of digital and human sales integration found that B2B buyers are 2.8 times more likely to complete a high-quality deal with low regret when the information on a supplier's website matches what its sales reps say in conversation 10. The multiplier is not a brand-trust soft metric. It is a deal-outcome metric — measured against purchase quality and post-purchase regret, the two signals that determine whether a closed deal turns into an expansion or a churn case eighteen months later.
Most content programs are not built to deliver that consistency. They are built to deliver volume. A demand team commissions a campaign landing page that frames the category one way. The blog editor commissions a thought leadership piece that frames it slightly differently. A product marketer rewrites the pitch deck for an industry event. By the time a champion forwards three of those assets to her CFO, the story has shifted three times, and the CFO's first question to the sales rep is why the website says something different from the case study.
The 2.8x lift is what coherence is worth in deal quality. The opposite — fragmented messaging across web, sales, and partner channels — is what production-volume-first programs reliably manufacture. Cutting asset count is not the goal. Locking the framing, vocabulary, and proof points across every asset that touches the committee is.
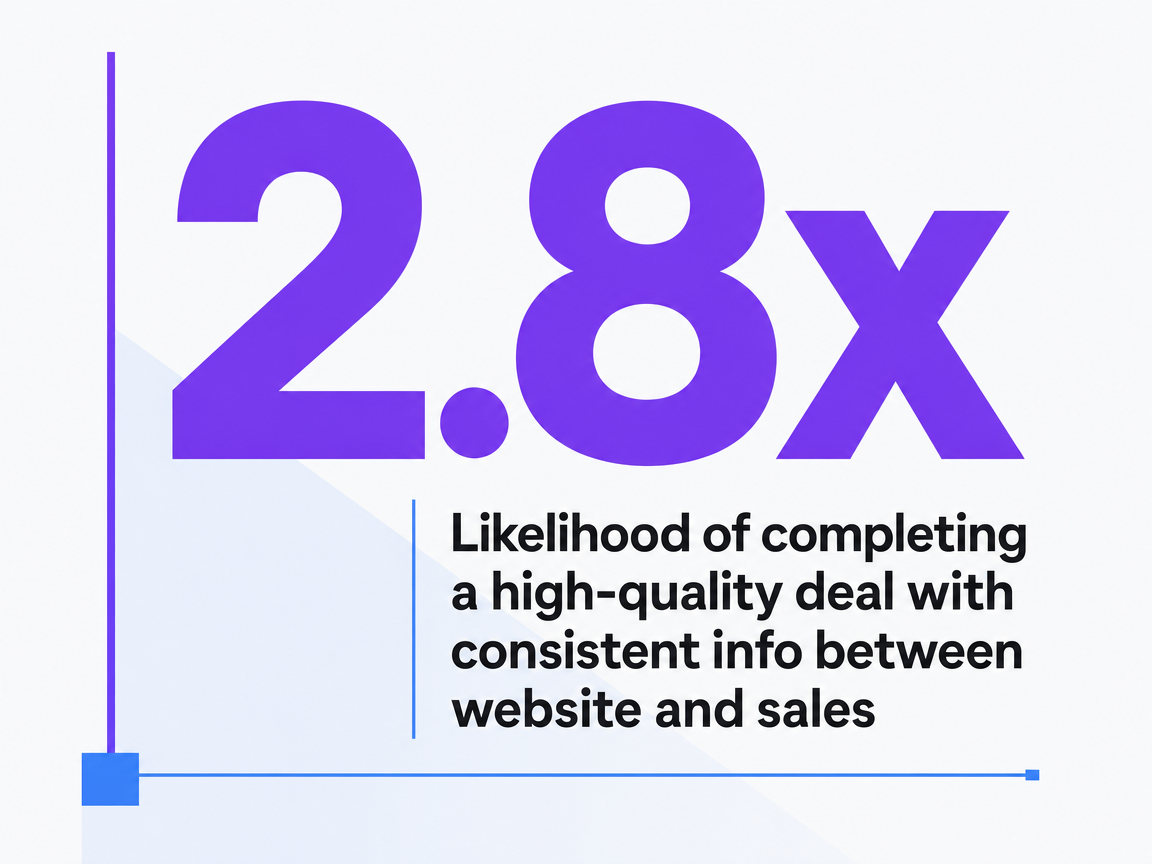 Likelihood of completing a high-quality deal with consistent info between website and sales
Likelihood of completing a high-quality deal with consistent info between website and sales
The Hybrid Path: Designing Content That Works Across Self-Serve and Seller-Led
Hybrid selling — blending digital self-serve, remote conversations, and in-person work — is now the dominant B2B model, and McKinsey reports it can drive up to 50% more revenue than traditional approaches by widening reach and deepening engagement 6. The implication for content is that a single asset has to perform two jobs: stand alone when a buyer reads it at 11 p.m. without a rep, and reinforce the same argument when a rep walks a CFO through it on a Tuesday call.
That dual-use requirement reshapes asset design. Pricing logic, ROI math, and category definitions belong in the public content, not gated behind a sales conversation, because the committee is already running the math before the first meeting. Sales decks and talk tracks then build on the same framing rather than introducing new vocabulary. A case study with one set of numbers on the website and a different set in the sales deck is the exact inconsistency that erodes the 2.8x deal-quality lift.
The operational test is simple: take any three assets a champion would forward — a landing page, a one-pager, a webinar recording — and check whether they argue the same thing in the same words. If they do not, the gap is the work.
Measurement Reform: Replacing Sourced-Lead Math with Influence, Velocity, and Deal Quality
The Dashboard Lag: Why 47% of B2B Programs Still Report the Wrong Number
Forrester's B2B Metrics Study found that marketing-sourced pipeline and revenue still appear on 47% of B2B marketing dashboards, even though the metric misreads marketing's actual contribution in committee-driven journeys 14. Sourcing credits the first hand that touches a record. It ignores the fifteen committee interactions that happened before that hand-raise and the thirty after it that determined whether the deal closed at full value or stalled in procurement.
The reporting gap shows up in three predictable ways. Programs that produce the most influential committee assets — the comparison frameworks, the ROI models, the security FAQs — get credited least, because those assets rarely carry the first-touch attribution. Programs that produce gated ebooks get credited most, because the form fill is the easiest event to count. And the CRO learns, quarter after quarter, that marketing's contribution looks flat while pipeline quality quietly improves or erodes underneath the number.
The dashboard is not just wrong. It actively redirects content investment toward whatever produces a trackable form fill, which is almost never the same asset that helps a committee finish its work. Replacing the metric is not a reporting exercise. It is a budget-defense exercise. A VP cannot argue for committee-stage assets while the scoreboard rewards lead volume — the math will lose every time, and the program will keep producing the wrong things on purpose.
An Influence-Velocity-Deal-Quality Stack VPs Can Defend to the CRO
The replacement is three metrics, each measuring a different question the CRO already asks. Together they describe what content actually does on a complex deal.
Influence : measures how many closed-won opportunities touched a given asset or asset family before signature, weighted by stage. Not first-touch. Every touch. A comparison framework that appears in 60% of closed-won deals between $100K and $500K is doing work, even if no buyer ever filled out its form. The reporting question is share of opportunity, not share of lead.
Velocity : measures days between defined stage transitions for deals exposed to an asset versus deals that were not. A pricing logic page or ROI calculator that compresses the gap between discovery and proposal by even a few days, across enough deals, is worth more than ten gated reports that source leads who never convert. Velocity also catches the assets that hurt — content that confuses the committee tends to stretch stage time, and the data will show it.
Deal quality : measures the closed deals exposed to coherent, committee-grade content against those that were not, on average contract value, discount depth, and twelve-month retention. This is where the Gartner coherence finding becomes a line on the dashboard rather than a slide in a deck.
None of these require new tools. They require the CRM to tag content exposure at the opportunity level and the data team to run the comparison. The harder work is political: agreeing with sales that influence is shared, not sourced, and that the program will be judged on deal outcomes instead of lead counts.
Thought Leadership Measurement: Behavior Change, Not Views
Thought leadership is the category most often defended with the weakest numbers — impressions, downloads, time on page. Edelman and LinkedIn's flywheel research argues for measuring it by behavior change instead: account-level lift, MQL and SQL movement inside target accounts, and meeting acceptance rates from accounts that engaged with the content 9.
The shift is practical. A thought leadership piece that earns 40,000 views from outside the ICP and zero meetings inside named accounts is a publishing success and a pipeline failure. The same piece, retargeted to a 200-account list and tied to a 12-point lift in meeting acceptance, is a different asset on the dashboard even though the content did not change.
Edelman and LinkedIn's broader research adds the editorial test: decision-makers want material that helps them understand their challenges, with concrete guidance and proof points they can use 8. Thought leadership that meets that bar tends to produce the behavior change worth measuring. Thought leadership that does not produces traffic, and traffic does not close.
See How AI-Driven Content Execution Delivers Consistent B2B Pipeline Results
Request a data-backed walkthrough of unified AI-powered workflows for B2B content marketing—eliminating bottlenecks and enabling teams to scale pipeline impact without expanding headcount or managing multiple vendors.
The Capacity Problem: Coordination Overhead Is Eating the Program
The Investment-Effectiveness Gap That Defines the Category
The Content Marketing Institute's B2B research found that 78% of marketers allocate budget to experiential marketing, yet fewer than a third rate those efforts as very effective 1. That gap is not an experiential-marketing problem. It is a category symptom. Programs across the discipline spend confidently and rate themselves poorly, because the investment goes into production while the bottleneck sits somewhere else.
The bottleneck is coordination. A typical mid-market content operation runs five to eight handoffs between the idea and the published asset: a brief from product marketing, a kickoff with the agency, a draft review, a legal pass, a design round, a stakeholder approval, a CMS push, a distribution scheduling step. Each handoff carries a status meeting, a Slack thread, and a queue. The work that actually moves the committee — the comparison framework, the ROI model, the procurement FAQ — sits in the queue behind a fourth revision of a blog post no champion will ever forward.
Endeavor's 2024 benchmark shows more than half of B2B marketers planning to raise content budgets again 2. Adding budget to a coordination-bound operation produces more handoffs, not more pipeline. The effectiveness gap widens because the team is busier without being more useful to the buying committee.
Approval-First AI Execution as the Structural Answer
The capacity answer is not more headcount or another agency. It is collapsing the handoffs while keeping the approvals. McKinsey's analysis of high-growth B2B companies finds that those combining advanced analytics, omnichannel execution, and integrated marketing and sales can grow market share by more than 10% annually — outcomes that depend on coordinated operations, not larger teams 4.
Approval-first AI execution describes a category of platform that reads live performance data, ranks the next pieces of work by expected pipeline impact, drafts them against a locked message system, and routes every output through human sign-off before anything publishes. The briefing meeting collapses into a ranked recommendation. The agency status call collapses into an approval queue. The four-week production cycle for a committee-stage asset compresses to days, because the steps between strategy and shipped work are running in one governed loop instead of across five vendors.
The control question matters more than the speed question. A VP cannot answer to a CRO for a program that ships without oversight. Approval-first execution keeps the judgment with the marketer — what gets published, what message it carries, what claims it makes — while removing the coordination tax that consumes the team's hours. That is the operating model Vectoron is built to run.
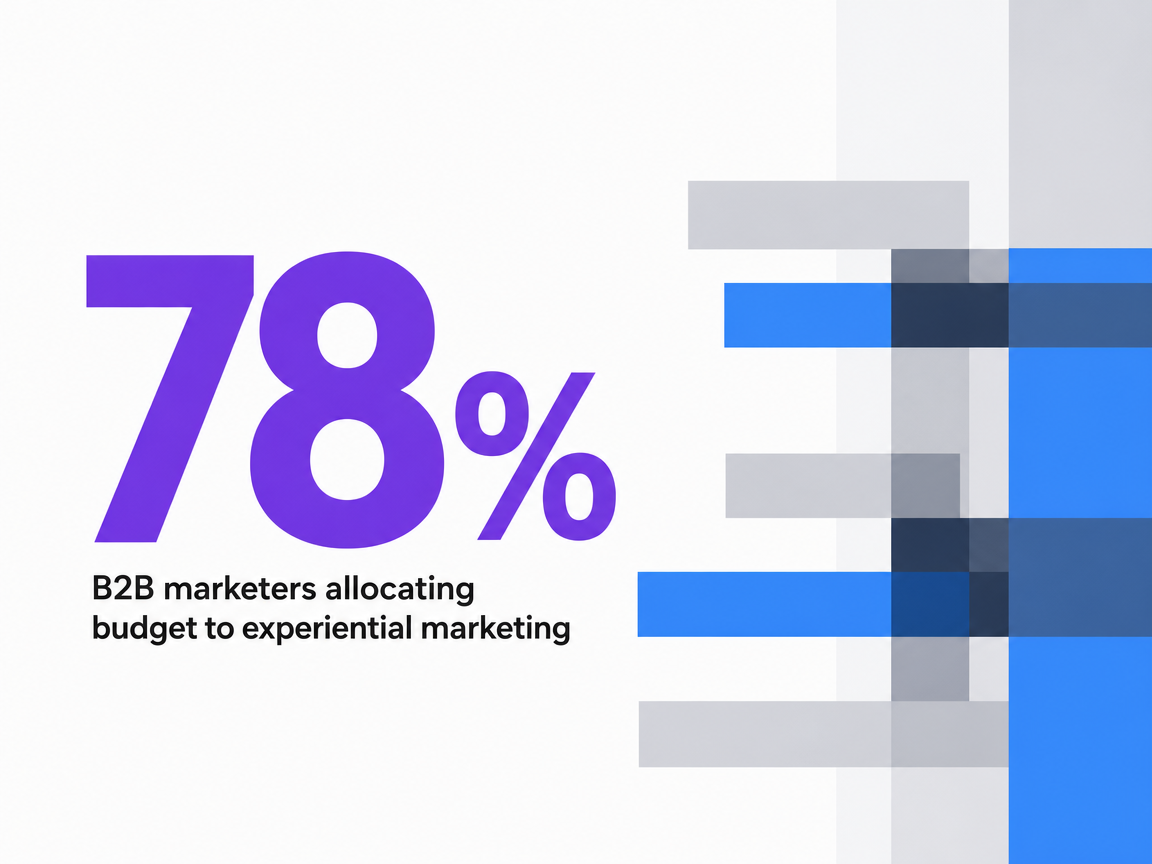 B2B marketers allocating budget to experiential marketing
B2B marketers allocating budget to experiential marketing
A 90-Day Operating Plan for VPs Who Need Pipeline Predictability This Quarter
The reset fits inside a single quarter if the work is sequenced against the dashboard, not the calendar.
- Days 1–30: Lock the message and audit the gap. Pick the three deals most likely to close in the next 60 days and ask the reps which two or three assets the committee actually circulated. Compare the framing in those assets against the current sales deck and pricing page. Where the vocabulary diverges, that is the work — and the 2.8x deal-quality lift from information consistency makes it the highest-return fix on the roadmap 10. In parallel, list every content asset shipped in the last two quarters and tag each by committee job: problem framing, vendor justification, or internal selling tool. Most programs will find 70% of output sits outside those three buckets.
- Days 31–60: Rebuild measurement before producing anything new. Add opportunity-level content exposure tagging to the CRM. Stand up the influence, velocity, and deal-quality views against a 12-month backlog of closed deals. Bring sales into the definition session so influence is shared by design, not litigated later. Forrester's finding that 47% of dashboards still lead with sourced pipeline is a useful artifact to put in front of the CRO — it reframes the conversation as catching up to peers, not abandoning rigor 14.
- Days 61–90: Ship the missing committee assets and consolidate execution. Commission the three or four internal selling tools the audit exposed — the ROI model, the procurement FAQ, the one-page champion brief — and route them through an approval-first execution workflow that compresses the briefing-to-publish cycle without removing sign-off. Platforms like Vectoron are built to run that loop; the operational point is to stop financing coordination overhead and start financing assets the committee will actually forward.
Frequently Asked Questions
References
- 1.B2B Content and Marketing Trends: Insights for 2026.
- 2.2024 B2B Marketing Benchmark Report.
- 3.B2B Content Marketing Benchmarks, Budgets, and Trends: Outlook for 2024.
- 4.The multiplier effect: How B2B winners grow.
- 5.Embracing the B2B omnichannel opportunity.
- 6.The future of B2B sales is hybrid.
- 7.How B2B decision makers are driving growth.
- 8.B2B Thought Leadership Research From LinkedIn and Edelman.
- 9.Flywheel of B2B Thought Leadership.
- 10.Integrating Digital and Human Sales (Gartner B2B Buying Report excerpt).
- 11.Gartner says: Sales and marketing influences just 32% of B2B buyers' journey.
- 12.Gartner survey reveals B2B buyers' complex journey.
- 13.Data Is the Next Big Thing in Content Marketing.
- 14.B2B Marketers: It's Time To Ditch Sourcing Metrics.