
Key Takeaways
- Treat distribution as a five-part operating system: audience and journey mapping, channel-format fit, publishing and promotion workflow, measurement wiring, and a scheduled refinement loop.
- Tag every asset to a buying-group role and a journey stage before launch, and separate the thought-leadership lane from the demand-capture lane so each gets graded on the right metric.
- Wire the measurement pipe end to end — campaign naming, UTMs, common landing pages, and CRM fields — so channel contribution survives into opportunities and closed revenue 12.
- Run a 30-60-90 refinement cadence that treats each channel-format pairing as a hypothesis, reallocates away from underperformers, and watches for engagement traps where clicks rise but conversion flattens 9.
Why Your Content Isn't Reaching the People It Was Built For
You publish an article, queue a social post, maybe send an email. Then you wait. Traffic trickles in, a few people engage, and the asset quietly ages out of the feed. Meanwhile the production calendar keeps moving, because next week has its own deliverables.
The problem usually isn't the content. It's that distribution was treated as a last step instead of a system.
Only 28% of enterprise marketers rate their content strategy as extremely or very effective, based on CMI's 2025 survey of 1,186 global respondents 1. That gap isn't a creativity problem. It's an operations problem: assets get built without a clear plan for who sees them, through which channels, at which stage of the buying decision, or how success will be measured once the post goes live.
This guide walks you through the five components that make a content distribution strategy actually function: mapping audiences to journey stages, matching formats to channels, running a publishing and promotion workflow, wiring measurement from UTM to CRM, and closing the loop with structured refinement. The goal is a system you can run on Monday, not a philosophy to admire.
Distribution as an Operating System, Not a Channel List
Most distribution plans fail the same way. Someone writes a list of channels — blog, LinkedIn, email, maybe a paid boost — and calls it a strategy. That isn't a strategy. It's a packing list. It tells you what you brought, not where you're going or how you'll know you arrived.
Treat distribution as an operating system instead. Five components, connected in order, each one feeding the next:
- Audience and journey mapping. Who you're trying to reach, and what stage of the buying decision they're in when the asset lands.2. Channel-format fit. Which content shape belongs on which surface, based on how that surface is actually used.3. Publishing and promotion workflow. Who ships the asset, who amplifies it, and what quality check happens before launch.4. Measurement wiring. The plumbing — campaign names, UTMs, landing pages, CRM fields — that lets you see what each channel contributed.5. Refinement loop. A scheduled review that moves spend and effort toward what's working and retires what isn't.
The 28% enterprise effectiveness figure from CMI's 2025 survey of 1,186 global respondents 1is useful here as a diagnostic, not a scare stat. The 72% that doesn't rate itself effective usually has some of these components in place and some missing. A team may have strong audience research but no measurement pipe. Another has UTMs wired to CRM but no refinement cadence, so the same underperforming channel keeps getting the same budget next quarter.
The sections that follow build the five components in order. If you already have one piece working, skim it and spend your time on the gap. The operating model only pays off when the components connect — audience choices shape channel choices, channel choices shape the promotion workflow, the workflow produces data the measurement pipe can read, and that data drives the next refinement cycle.
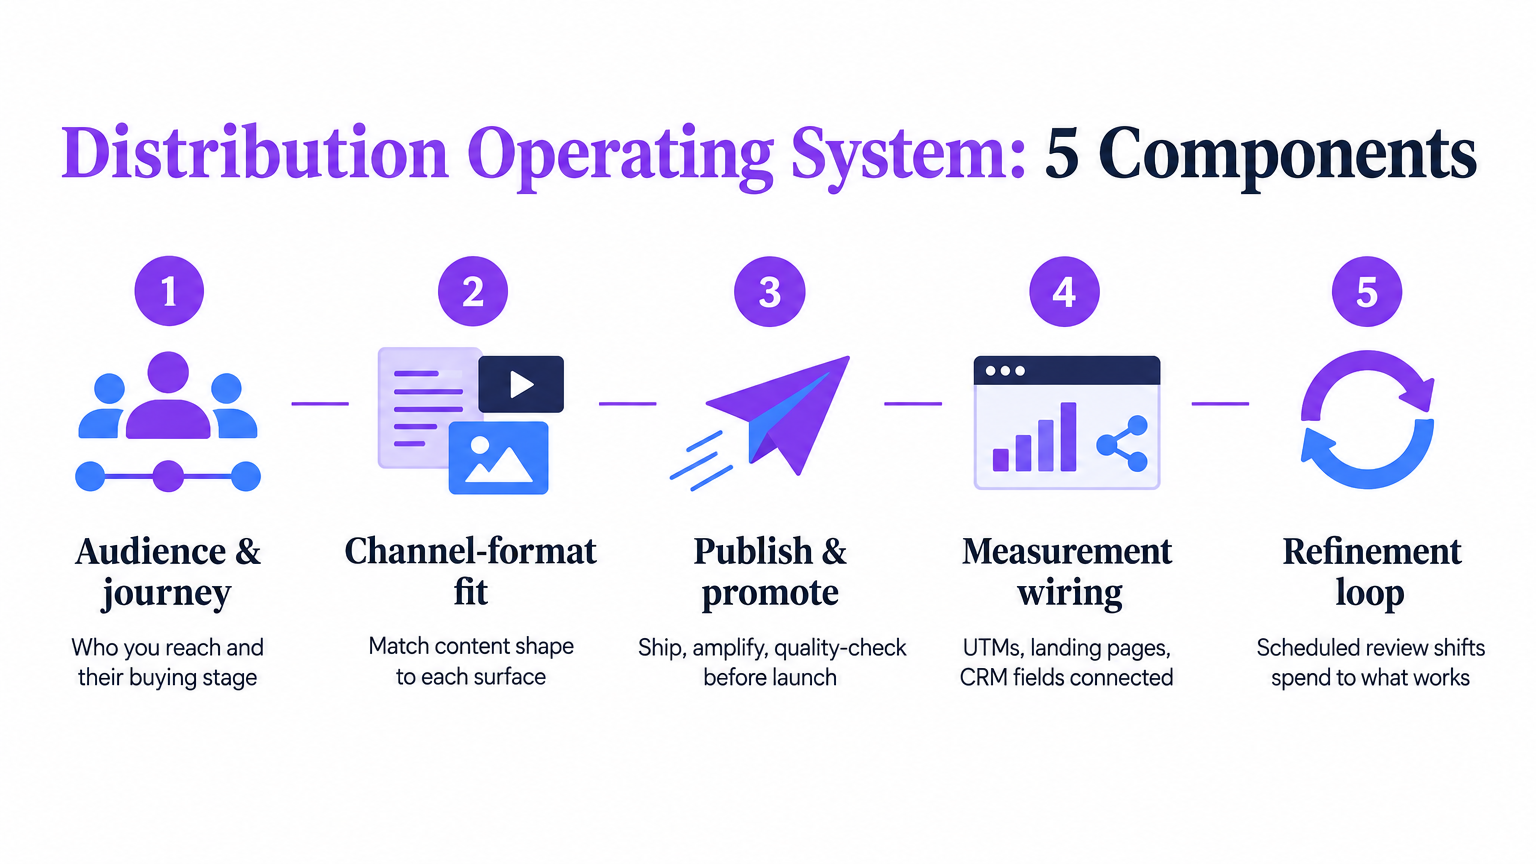 Five-step content distribution strategy framework: audience, channel fit, promote, measure, refine.
Mapping Your Audience to Journey Stages
Before you pick a channel or a format, you need to answer two questions: who is this asset for, and what are they trying to decide when they see it? Most teams skip both. They write for a persona document that lists job titles and favorite tools, then promote the piece to whoever is already following them. That audience is almost never the audience that will buy.
This section covers three decisions that shape every downstream channel and measurement choice: who you're actually targeting, where that person is in the buying process, and whether the asset belongs in the trust-building lane or the pipeline-capture lane. Get these three right and the rest of the operating system has something to work with.
Define the Buying Group, Not Just the Persona
A single persona rarely signs a contract. In most B2B purchases, several people weigh in — typically a mix of the user, the manager who owns the budget line, a technical reviewer, sometimes a compliance or finance gate, and an executive sponsor. If your distribution plan only targets one of them, the deal stalls on everyone else.
List the buying group for each product or service you sell. For every role, write one sentence on what they need to believe to say yes, and one sentence on where they already spend time professionally. That second sentence is your channel shortlist. The technical reviewer may read Hacker News comments and vendor documentation; the executive sponsor may only see what their team forwards to them. These are different distribution problems, and treating them as one audience is why generic promotion underperforms.
Assign Every Asset to a Journey Stage
Tag every asset — before it's written — with one of three stages: awareness, consideration, or decision. The tag drives channel selection, call-to-action, and the metric you'll grade it on.
Awareness assets introduce a problem or a point of view. They belong on social, in newsletters, in podcast guest spots, and in paid promotion to cold audiences. Grade them on reach and new-visitor behavior, not form fills. Consideration assets — comparison guides, product-led tutorials, webinars — belong on your site, in retargeting, and in sales-enablement sequences. Grade them on engaged sessions, return visits, and progression into email or CRM. Decision assets — case studies, pricing explanations, implementation guides — belong in sales email, late-funnel retargeting, and the solution pages themselves. Grade them on opportunity creation and win-rate contribution.
Aligning content with the buyer's journey was cited as a top challenge by 45% of B2B marketers in CMI's 2025 benchmark survey of roughly 980 B2B marketers 2. The fix starts with the tag.
Split the Thought-Leadership Lane from the Demand-Capture Lane
These two lanes look similar from a distance and behave nothing alike up close. Collapsing them into one plan is the single most expensive mapping error you can make.
- The thought-leadership lane targets people who are not shopping. They may become buyers in six months or eighteen; right now they're reading, watching, and forming opinions about who's credible. The content is evidence-led, opinionated, and useful whether or not the reader ever buys from you. Edelman and LinkedIn's 2024 study of nearly 3,500 management-level B2B professionals across seven countries found that 73% consider a company's thought leadership a more trustworthy basis for judging its capabilities than its marketing materials 5. That signal only works when the content doesn't read like marketing materials.
- The demand-capture lane targets people who are in-market right now — searching, comparing, pricing. The content is specific, product-adjacent, and conversion-tracked. Landing pages, comparison guides, pricing explanations, product demos.
Fund them separately. Measure them separately. The thought-leadership lane gets graded on audience growth, inbound mentions, sales-reported influence on first conversations, and share of voice among the buying group. The demand-capture lane gets graded on pipeline sourced, cost per opportunity, and win rate. If you grade a thought-leadership piece on form fills, you'll kill it before it does its job. If you grade a comparison page on reach, you'll scale the wrong thing.
Build and publish your distribution plan
Use seven days to turn researched content into published work across your channels.
Channel-Format Fit: Where Each Asset Actually Belongs
A format is a shape. A channel is a surface. Fit is the match between the two — and between both and the audience you mapped in the last step. Teams get this wrong when they decide a format first ("we need more video") and then look for places to put it. The decision runs the other way: the audience and journey stage pick the channel, and the channel picks the format.
The baseline shift in the B2B publishing mix is easy to see in the format data. In the 2024 outlook study, based on July 2023 data, short articles and posts rose from 89% to 94% of B2B marketers' content formats between 2023 and 2024, video jumped from 75% to 84%, and case studies and customer stories moved from 67% to 78% 3. More recent 2025 enterprise research shows short articles/posts at 92%, videos at 85%, and case studies/customer stories at 75% 1. Three different formats, three different growth rates, one takeaway: adoption is not the same thing as fit. If most of your competitors are shipping short posts, your short post is competing against a louder floor. The question is where each format earns its slot in your plan.
Use a simple decision rule. Short posts belong on social and in newsletters, where the surface is a feed and the audience is scanning. Video belongs where attention is sustained — on YouTube, inside webinars, on sales-enablement pages, and in paid pre-roll targeted at defined accounts. Case studies belong on your site, in sales email sequences, and in late-stage retargeting, where the reader is already evaluating and needs proof.
Then test the fit instead of assuming it. A machine-learning analysis of digital brand content found that rational and emotional content, format type, and platform all interact with engagement in ways that don't transfer cleanly from one channel to another 10. The same case study that converts on a solution page may underperform as a LinkedIn carousel. Treat each channel-format pairing as its own hypothesis: ship it, measure it against the metric that matches its journey stage, and keep or kill the pairing based on what you see — not based on what the industry adopted last year.
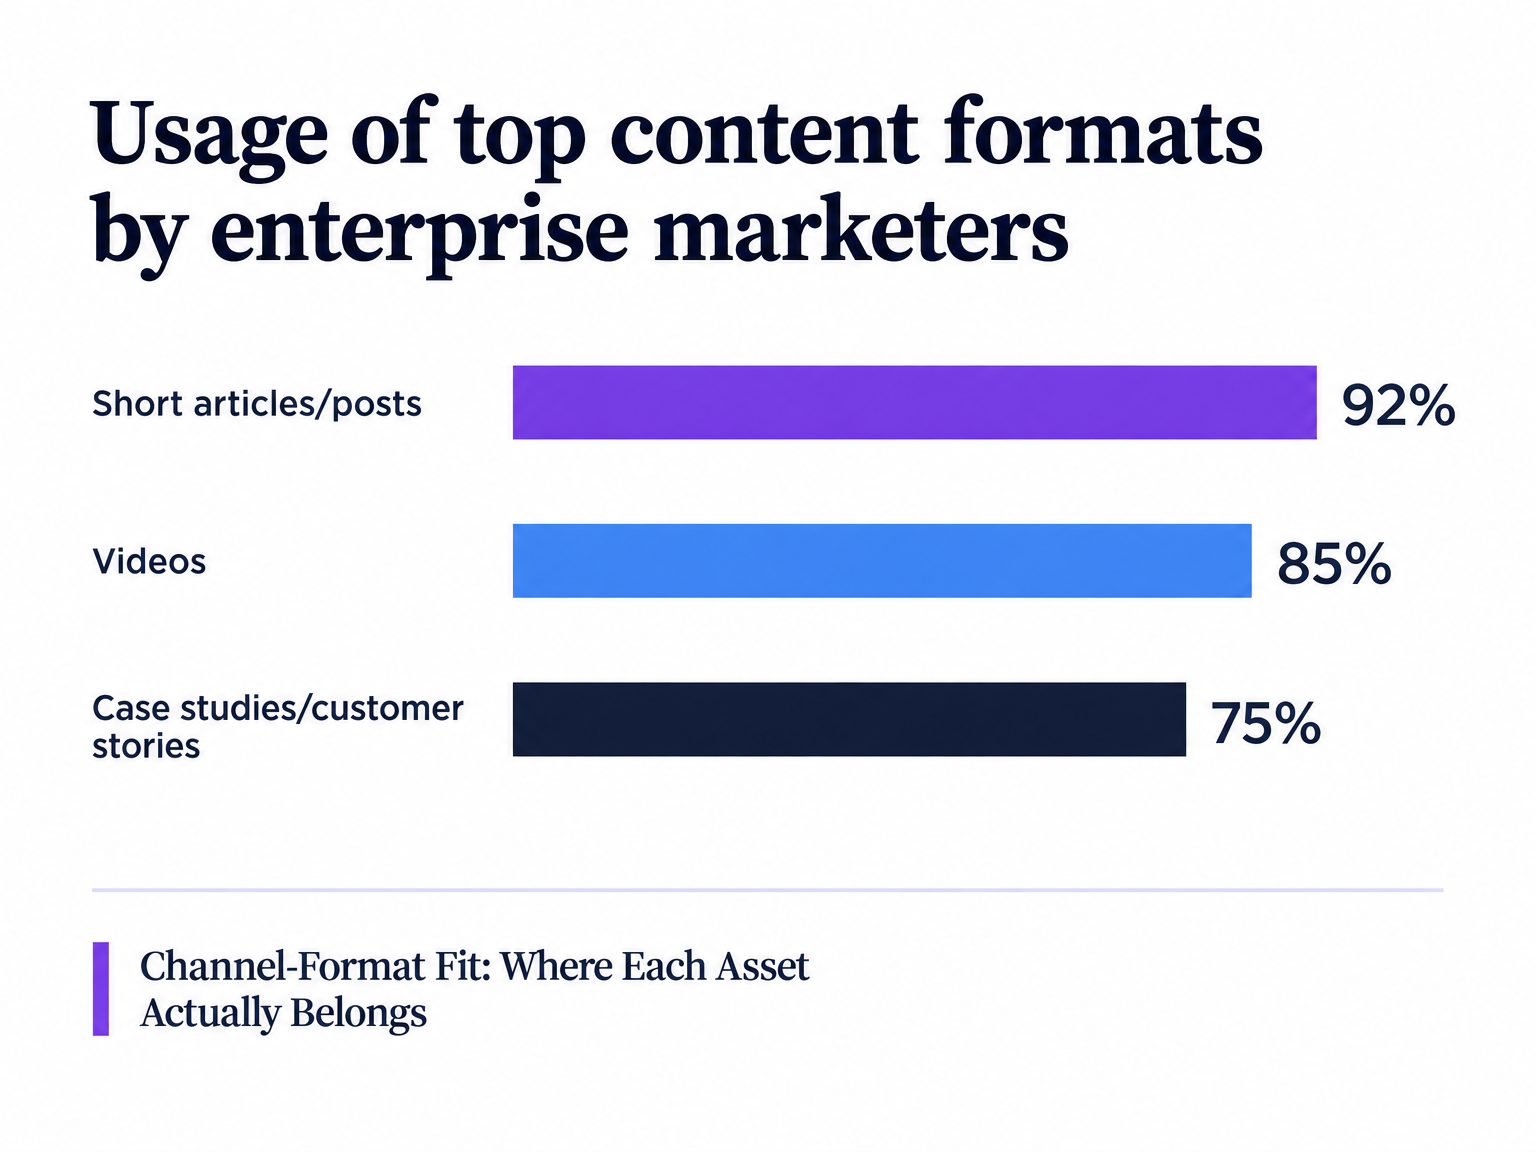 Bar chart of top B2B content formats informing content distribution strategy choices
Useful for a bar chart showing the most popular B2B content formats.
The Publishing and Promotion Workflow
An asset doesn't launch itself. Launch day is where strategy either becomes a shipped post with coordinated amplification, or a URL that got pushed live and quietly forwarded to one Slack channel. This section covers the three parts of the workflow that decide which one happens: who does what across your four channel types, the quality check that runs before anything publishes, and the disclosure rules that apply when other people distribute on your behalf.
Owned, Earned, Shared, and Paid: Who Does What on Launch Day
Every asset should move through four lanes on the day it ships, each with a named owner and a specific action.
- Owned is anything you control: the article on your site, the resource library, the email list, the product UI. On launch day, owned means the asset is published to its canonical URL, added to any relevant hub or pillar page, and queued into the next scheduled email send to the segment it was built for. One owner — usually the content lead — signs off that this step is complete before anything else fires.
- Shared is social and community distribution from your own handles and your team's. Launch day means the branded post goes live on the platforms that match the format you chose, and three to five team members with relevant audiences post their own take within 24 hours. These are not reshares of the brand post. Each person writes one or two sentences about why the piece matters to the audience they talk to.
- Earned is pickup you didn't pay for: mentions, backlinks, podcast invites, newsletter inclusions. Launch day means your PR or partnerships owner has already pitched the asset to three to five specific outlets or operators the week before, with the publish date in the subject line.
- Paid is promotion with a media budget attached — social ads, search, newsletter sponsorships, retargeting. Launch day means at least one paid push is live against a defined audience, with its own UTM so you can separate paid-sourced behavior from organic later.
The Quality Gate Before Anything Goes Live
Put one checkpoint between "draft is done" and "publish." The gate exists because scaled production and distribution now routinely include AI-assisted drafting, and the output needs a human review before it reaches an audience.
Google's guidance on AI-generated content is direct: focus on accuracy, quality, and relevance, and fact-check automatically generated content before publication 6. That is the floor, not the ceiling. The ceiling matters because production volume alone can work against you. A 2026 experimental study on generative AI and social media reported a dual effect — under the tools, platforms, prompts, and conditions tested, some AI tools raised engagement and output volume while also lowering perceived quality and authenticity, with negative spillover into the surrounding conversation; the authors caution these findings should not be generalized to every AI marketing workflow 11. More assets at lower perceived quality is a bad trade for distribution; it burns the audience you're trying to compound.
A workable gate has four checks and one owner. Facts and claims are verified against primary sources. Any statistic, quote, or named study is traced to the original. The piece reads in the brand's voice, not a model's default voice. And the call-to-action matches the journey stage the asset was tagged with. If any check fails, the asset goes back one step — not forward with a note to fix it later.
Disclosure Rules for Creators, Employees, and Affiliates
When other people distribute content for you — paid creators, employees posting on company time, affiliates earning a cut, customers who received free product — the FTC expects the material connection to be obvious to the audience seeing the post. Disclosure belongs with the endorsement message itself, not buried in a profile bio or a linked page 7.
Build the rule into the workflow instead of hoping each poster remembers. Supply approved disclosure language with every brief: "#ad" or "Paid partnership with [Brand]" for creators, a plain statement like "I work at [Brand]" for employee posts about company content, and "affiliate link" or similar for affiliates. Keep a log of who posted what, where, and with which disclosure. That log is also where legal review lives if a campaign ever gets questioned.
Measurement Wiring: From UTM to CRM
You can run a disciplined publishing and promotion workflow and still have no idea what worked. That happens when the data from distribution never reaches the systems where revenue is recorded. This section is about the plumbing that closes that gap — the single statistic that explains why most teams fail at it, the fields and conventions that make attribution readable, and the hierarchy of metrics that keeps you from grading every asset on form fills.
The 47% Problem and Why It Persists
Measuring content results was identified as a major challenge by 47% of B2B marketers in CMI's 2025 benchmark survey of roughly 980 B2B marketers 2. That number has moved very little across editions of the study, and the reason is structural: measurement is almost never a tooling problem on its own. It's a wiring problem.
The pattern looks the same across teams. The content calendar lives in one system. Social posts go out through another. Email runs in a third. Paid campaigns live in each ad platform's native UI. Each tool reports its own numbers in its own vocabulary. By the time someone tries to answer "did that asset produce pipeline," the trail has broken in four places. You can't fix that with a better dashboard. You fix it by deciding, before launch, what each channel will tag, where tagged traffic will land, and which CRM field will carry the campaign forward.
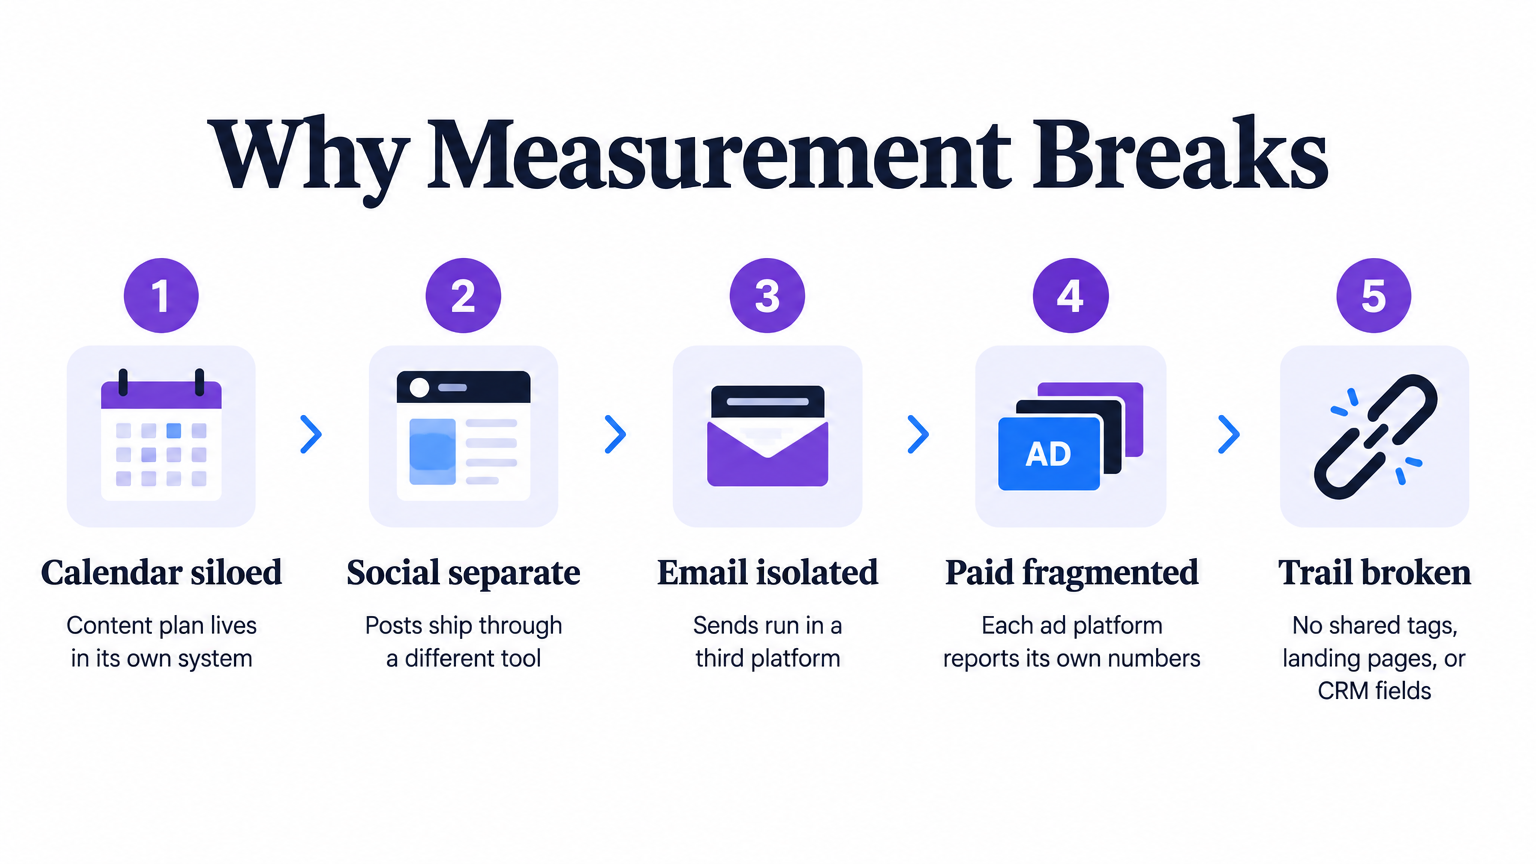 Five-step infographic showing siloed tools that break content distribution strategy measurement.
Wiring the Pipe: Campaign Naming, UTMs, Landing Pages, and CRM Fields
Start with a campaign naming convention and write it down. Every asset gets one campaign name, used everywhere it's promoted. A format like [year]-[quarter]-[asset-slug] is boring and that's the point — boring is readable six months later. Lock it in a shared document and refuse exceptions.
Next, tag every outbound link with UTM parameters: source (the channel, like linkedin or newsletter), medium (the type, like social-organic, social-paid, email), campaign (the name you just defined), and where relevant, content (which creative variant) and term (which audience segment). The American Marketing Association's guidance on this is explicit: route promotions for the same asset to a common landing page with distinct UTM values, and capture source, medium, campaign, keyword, and ad fields into CRM reporting 12. Common landing page, distinct UTMs. That combination lets you compare channels on an apples-to-apples destination.
Then wire the landing page to your CRM. Any form on that page should write the UTM values into dedicated CRM fields on the lead or contact record — not just the first touch, but every touch where a UTM is present. Marketing automation can carry those fields into opportunities so a sales rep closing a deal six weeks later still has the originating campaign attached.
If a channel can't carry a UTM — a podcast mention, a printed one-pager, a verbal referral — give it a vanity URL that redirects through a tagged link. If it still can't be tagged, add a "How did you hear about us?" field to the form. Imperfect self-reported data beats no data.
Building the Metric Hierarchy
Not every asset should be graded on the same metric. A hierarchy fixes that. Build it in four layers, and grade each asset at the layer that matches its journey stage.
- Layer 1 — Distribution indicators: impressions, reach, sends, placements. Answers whether the asset actually got in front of people. Awareness assets live here.
- Layer 2 — Engagement: website traffic, website engagement, email engagement, social analytics. CMI's outlook research found these are among the metrics B2B marketers most frequently use to evaluate content, with website traffic at 71%, website engagement at 69%, email engagement at 71%, and social-media analytics at 65% 4. Consideration assets live here.
- Layer 3 — Conversions: form fills, demo requests, trial starts, qualified leads. Reported as a frequently used metric by 73% of respondents in that same study 4. Decision-stage assets and demand-capture lane assets live here.
- Layer 4 — Revenue influence: opportunities created, pipeline sourced, closed-won deals with the campaign attached. This is where the CRM wiring from the last section earns its keep.
One caution before you build the dashboard. A preregistered experiment with 6,488 participants, using simulated recommendation conditions and news articles, found that recommendations tuned to users' actual clicking behavior produced more clicks, while recommendations tuned to users' ideal preferences made users feel better off about how they spent their time 9. The parallel for commercial distribution is directional rather than proven, but it's a useful warning: optimizing to the easiest-to-move metric can push you toward content the audience clicks but doesn't value. Grade each asset at its correct layer, and watch the top-of-funnel layers for traps where engagement rises but downstream conversion flattens.
Put Your Content Distribution Plan Into Motion
See how Vectoron can help your agency or enterprise team coordinate content research, approvals, and publishing across multiple websites.
The Refinement Loop: Testing Content-Channel Fit Instead of Guessing
The first four components get your distribution running. The refinement loop keeps it from drifting. Without a scheduled review, the same channel keeps getting the same budget quarter after quarter because nobody built a moment to challenge it.
Run the loop on a 30-60-90 cadence. Every 30 days, pull channel performance by UTM against the metric that matches each asset's journey stage. Every 60 days, review channel-format pairings — did the case study on LinkedIn earn its slot, or did it only perform on the solution page? Every 90 days, reallocate: shift budget and effort from pairings that underperformed twice in a row toward pairings that produced engaged sessions, qualified leads, or sourced pipeline above baseline.
Treat each pairing as a hypothesis, not a habit. The machine-learning analysis of digital brand content found that rational and emotional content interact with platform and format in ways that don't transfer cleanly between channels 10. The practical consequence: a format that works on one surface may fail on another, and the only way to know is to measure the pairing separately and act on what you see.
Watch for the engagement trap when you review. A preregistered experiment with 6,488 participants, run with simulated recommendations of news articles, found that recommendations tuned to clicking behavior produced more clicks, while recommendations tuned to users' ideal preferences left them feeling their time was better spent 9. The parallel to commercial distribution is directional, not proven — but the pattern is worth watching. If a channel keeps generating clicks but downstream conversion stays flat, that's the trap. Cut it or reposition the asset tagged against it — don't scale what isn't producing value past the first click.
Keep a simple decision log. For each refinement cycle, write down what changed, why, and what you expect to see next cycle. Six months in, that log becomes the artifact that distinguishes a distribution system from a pile of running campaigns.
If You Run Distribution Across Multiple Brands or Clients
A quick scope change before this section develops: the five components above assume one brand, one audience map, one measurement pipe. If you run distribution for an agency book, a holding-company portfolio, or multiple product lines under one roof, the operating model has to repeat without collapsing into one undifferentiated feed.
Keep the components identical and the inputs separate. Each brand gets its own audience and journey map, its own channel-format decisions, its own campaign naming convention, and its own CRM destination. Shared infrastructure — the UTM standard, the quality gate, the 30-60-90 refinement cadence — stays consistent so you can compare across accounts without re-learning each one.
Two portfolio-level traps to watch. First, cross-posting the same asset across unrelated brand handles reads as spam to the audience and dilutes each brand's signal; test content-channel pairings per brand instead of broadcasting 10. Second, if staff or partners distribute across multiple client accounts, the material connection disclosure still applies to each post individually 7.
Frequently Asked Questions
References
- 1.Enterprise Content Marketing Benchmarks, Budgets, and Trends: 2025 Research.
- 2.B2B Content Marketing: 2025 Benchmarks & Trends.
- 3.B2B Content Marketing Benchmarks, Budgets, and Trends: Outlook for 2024.
- 4.B2B Content and Marketing Trends: Outlook for 2024 Research.
- 5.2024 B2B Thought Leadership Impact Report.
- 6.Google Search's Guidance on Generative AI Content on Your Website.
- 7.Disclosures 101 for Social Media Influencers.
- 8.America's News Influencers.
- 9.Tailoring recommendation algorithms to ideal preferences makes users better off.
- 10.Comparing content marketing strategies of digital brands using machine learning.
- 11.The impact of generative AI on social media: an experimental study.
- 12.Stop Drowning in Marketing Data and Start Measuring Influence on Revenue.