
Key Takeaways
- Treat each blog post as a firm-initiated touchpoint measured by content-influenced revenue, not sessions or rankings, so assets earn credit for warming accounts that later generate pipeline 2, 7.
- Prioritize assets with a 40/30/20/10 weighting across revenue attributed, conversions influenced, lead quality, and engagement quality, which prevents vanity metrics from dominating the editorial calendar 7.
- Map posts to buyer stages with distinct metrics: engagement quality for problem-aware explainers, conversions influenced for solution-aware comparisons, and influenced pipeline dollars for decision-stage teardowns 7, 8, 11.
- Before scaling production, build the measurement spine, separate thought leadership from demand content scorecards, and route asset-level data into the CRM so fully loaded costs can be judged against influenced pipeline 1, 4, 10.
The Blog as a Firm-Initiated Touchpoint System
Most blog programs are managed as publishing operations, focusing on metrics like sessions, time on page, and keyword rankings. However, these numbers often fail to indicate whether the blog contributes to the sales pipeline.
A more effective approach is to treat each blog post as a firm-initiated touchpoint within the buyer's journey. A B2B SaaS analysis found that firm-initiated digital touchpoints converted to customers 28.3 percent more effectively than market-initiated touchpoints, leading to significantly higher forecasted sales value 2. Owned content, such as blog posts, falls into this firm-initiated category, offering a repeatable, indexable, and low-marginal-cost method for engagement.
This perspective redefines the blog's role. It shifts from being judged by output volume to being evaluated by its reliable production of tracked, attributable touches aligned with named buyer-stage hypotheses. The remainder of this article details the measurement framework, buyer-stage mapping, and production economics necessary to treat the blog as a touchpoint system 3.
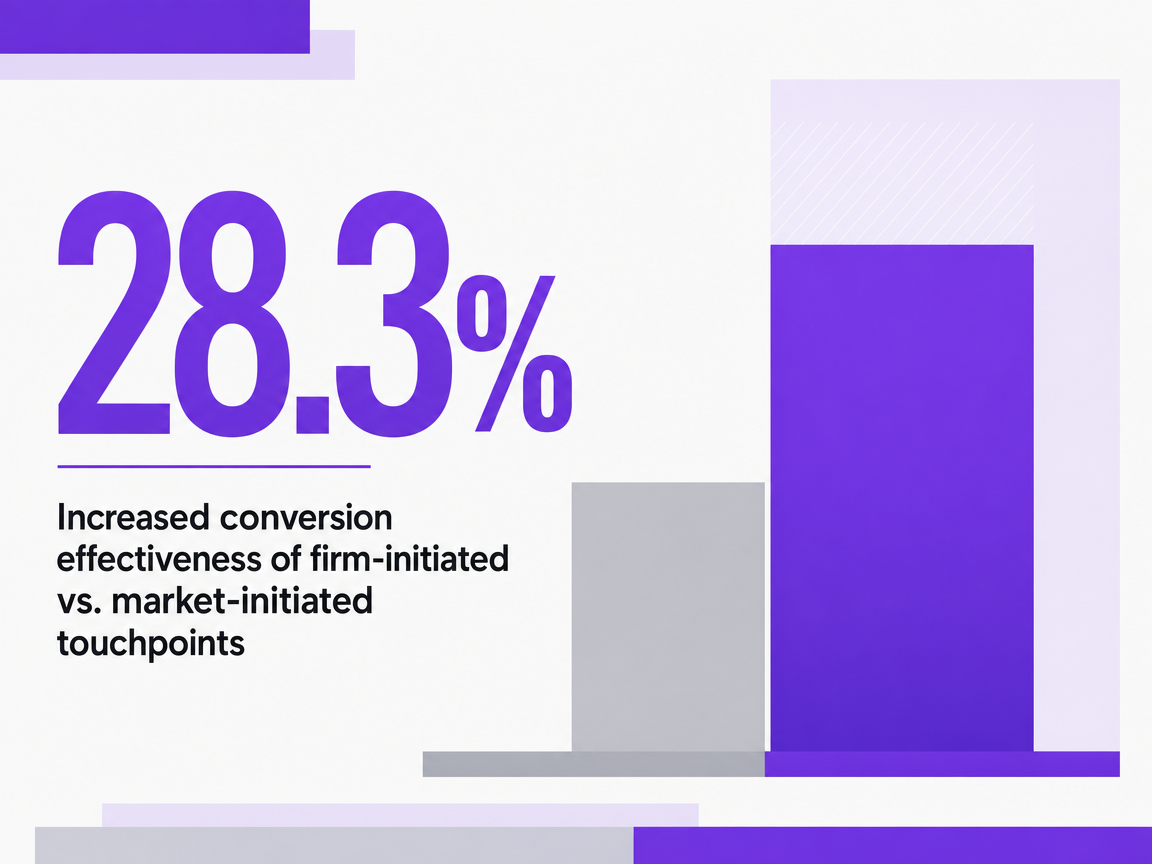 Increased conversion effectiveness of firm-initiated vs. market-initiated touchpoints
Increased conversion effectiveness of firm-initiated vs. market-initiated touchpoints
Why Most Blog Programs Stall Before Reaching Pipeline
A common issue for in-house content teams is that despite increased organic sessions and keyword rankings, the revenue team struggles to link blog activity to closed deals. This often stems from a lack of integrated measurement.
Research involving 263 organizations identified that content marketing effectiveness correlates with strategy clarity, commitment, performance measurement, and specialized operations 1. Programs often stall due to inadequate performance measurement, which is typically an afterthought rather than an integral part of content creation. This sequencing error means that without predefined conversion paths, lead capture logic, and CRM field mapping, analytics can only record basic metrics like sessions and bounces, failing to reconstruct the buyer's journey from initial read to opportunity. Consequently, content-influenced revenue cannot be retroactively calculated because touchpoint data was never captured at the asset level 7. B2B benchmark research consistently highlights proving content's revenue impact as a major operational challenge 5.
This leads to two additional problems: unfocused distribution across too many channels, despite evidence that an intermediate number of channels is more effective 1, and the mismeasurement of thought leadership and demand content against the same KPIs. This results in thought leadership appearing to underperform and demand content seeming to work in isolation. The solution lies in implementing a robust measurement framework.
Building the Measurement Spine Before Adding Posts
Content-Influenced Revenue as the Primary Metric
Content-influenced revenue represents the total revenue from customers who engaged with at least one piece of content before converting, as recorded in journey data 7. Unlike content-attributed revenue, which credits a single touchpoint, influenced revenue accounts for all interactions with the blog by accounts that eventually generate pipeline. This approach acknowledges the warming effect of early-stage content, giving credit to assets that contribute to the sales cycle even if they aren't the final touchpoint.
The program-level ROI can be calculated as: (revenue attributed to content - cost of content) / cost of content 8. It is crucial to segment metrics by funnel stage to avoid penalizing early-stage content for not producing immediate conversions. Without this segmentation, bottom-funnel topics might be overemphasized, despite their smaller addressable audience.
Implementing this requires journey data captured at the asset level. If the analytics system cannot identify which posts an account read before converting, content-influenced revenue can only be estimated, not precisely calculated.
The 40/30/20/10 Scoring Model for Blog Asset Prioritization
Once influenced revenue is established as the primary metric, a weighted scoring model can prioritize individual blog assets. A 2025 measurement framework suggests assigning 40 percent of an asset's score to revenue attributed, 30 percent to conversions influenced, 20 percent to lead quality, and 10 percent to engagement quality 7. This weighting emphasizes revenue and conversions (70%) over traffic-related signals (30%).
This model helps in editorial planning by valuing posts that contribute to opportunity creation, even with modest traffic, over those with high engagement but no influenced conversions. This corrects the bias towards vanity metrics.
Lead quality (20%) is typically defined by firmographic fit, ICP match, or a lead-scoring threshold in marketing automation. Engagement quality (10%) combines factors like scroll depth, return visits, and downstream content consumption. Neither weight is substantial enough to elevate a post that fails to generate conversions, preventing the editorial calendar from drifting towards superficial optimization.
Applied quarterly, this model identifies top-performing and underperforming assets, guiding decisions on content refresh, redirection, or retirement. The score serves as a comparative ranking to allocate production resources towards asset types that have demonstrated pipeline contribution.
When Engagement Quality Is a Legitimate Proxy
Many in-house content teams initially lack the infrastructure to calculate influenced revenue due to incomplete CRM fields, unintegrated marketing automation, or analytics that only report sessions. Building a full attribution pipeline can take several quarters.
During this interim period, engagement quality can serve as a defensible proxy. The recommendation is to track results back to influenced pipeline when possible, and use engagement metrics as a proxy while the attribution framework develops 11. This proxy is not merely scroll depth but engagement that correlates with eventual conversion, measured against accounts that converted in previous quarters.
The content team should identify engagement patterns observed in the journey data of accounts that became opportunities. These patterns, such as return visits within 30 days, multi-asset consumption, and high-intent page sequences, can then be used as leading indicators while the attribution stack matures.
This proxy has a limited lifespan. Once reliable journey data at the asset level is available, engagement quality reverts to its 10 percent weight, and influenced revenue becomes the primary metric. Continuing to rely on engagement after attribution is ready can understate the blog's pipeline contribution to stakeholders like the CFO.
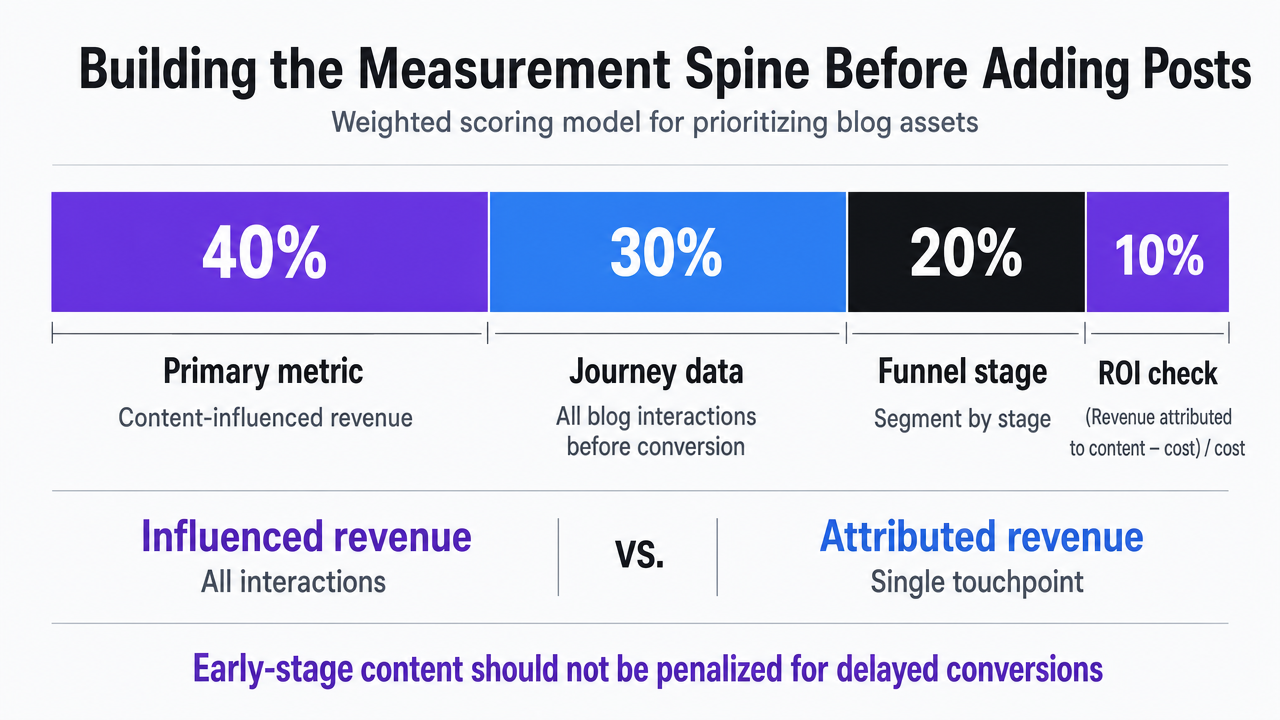 Visualize the 40/30/20/10 weighted scoring model cited in the section for prioritizing blog assets
Accelerate Pipeline With Data-Driven Content Workflows
Experience streamlined blog production that connects measurable content output directly to pipeline metrics during your trial.
Mapping Blog Assets to Buyer-Stage Hypotheses
Problem-Aware Explainers and the Engagement Signal
Problem-aware readers are in the early stages of identifying a need and are not yet evaluating vendors. Content for this stage should address diagnostic questions, such as why a metric is declining, the implications of a regulatory change, or inefficiencies in a workflow. These readers are not ready to convert, so forcing a conversion action is counterproductive.
The appropriate primary metric for these posts is engagement quality, segmented by funnel stage to ensure problem-aware content is not judged by bottom-funnel conversion expectations 8. Signals like return visits within a 30-day window, scroll completion on long-form content, and consumption of related posts indicate the asset's effectiveness. When journey data is reliable, these signals correlate with later opportunity creation, making them legitimate proxies under the 10 percent engagement-quality weight 7.
It is crucial to avoid gating problem-aware content behind forms. The conversion path should be low-friction, such as a newsletter subscription, a link to a related solution-aware post, or tagging for retargeting. Imposing decision-stage calls to action on problem-aware traffic can reduce engagement and lead to losing the account before the buyer-stage hypothesis can be tested 11.
Solution-Aware Comparison Posts and Conversions Influenced
Solution-aware readers have identified their problem and are exploring potential solutions. They seek information on available solutions, differing approaches, and relevant trade-offs. Blog assets for this stage include comparison posts, category overviews, build-versus-buy analyses, and approach-versus-approach comparisons with defined criteria.
The primary metric for these posts is conversions influenced, defined as the count of pipeline-relevant conversions where the asset appeared in the journey data before the conversion event 7. This includes conversions that result in an MQL or SQL record in the CRM, necessitating asset-level tracking integrated with marketing automation. Newsletter sign-ups from comparison posts are not equivalent to content-gated downloads that directly contribute to pipeline.
A key risk at this stage is editorial bias towards the company's own solution. Research indicates that B2B buyers cross-reference multiple sources before shortlisting. Therefore, a credible comparison post that honestly discusses competing approaches performs better in influenced-conversion data than one that ignores alternatives 8.
Decision-Stage Teardowns and Influenced Pipeline
Decision-stage readers have a shortlist and are in the process of validating claims, assessing fit, and identifying reasons to disqualify options before booking a call. Blog assets for this stage include implementation walkthroughs, objection-handling deep dives, case-study analyses with specific metrics, and detailed answers to questions commonly asked in late-stage sales calls.
The primary metric here is influenced pipeline, measured as the dollar value of opportunities where the asset appeared in the consumed-content set before the opportunity was created 11. While decision-stage posts may generate fewer total conversions than earlier-stage content, the conversions they influence typically have higher average deal values and shorter sales cycles. This justifies their production cost, even if traffic numbers are modest.
Operational alignment with sales is crucial. Decision-stage teardowns should address questions frequently heard by the sales team during stage-three and stage-four calls and then be integrated into sales enablement resources. Aligning content topics with business objectives and the specific information needs of late-stage buyers ensures these teardowns accelerate pipeline rather than remaining unread 11. Both blog posts and sales decks should address the same questions using consistent language.
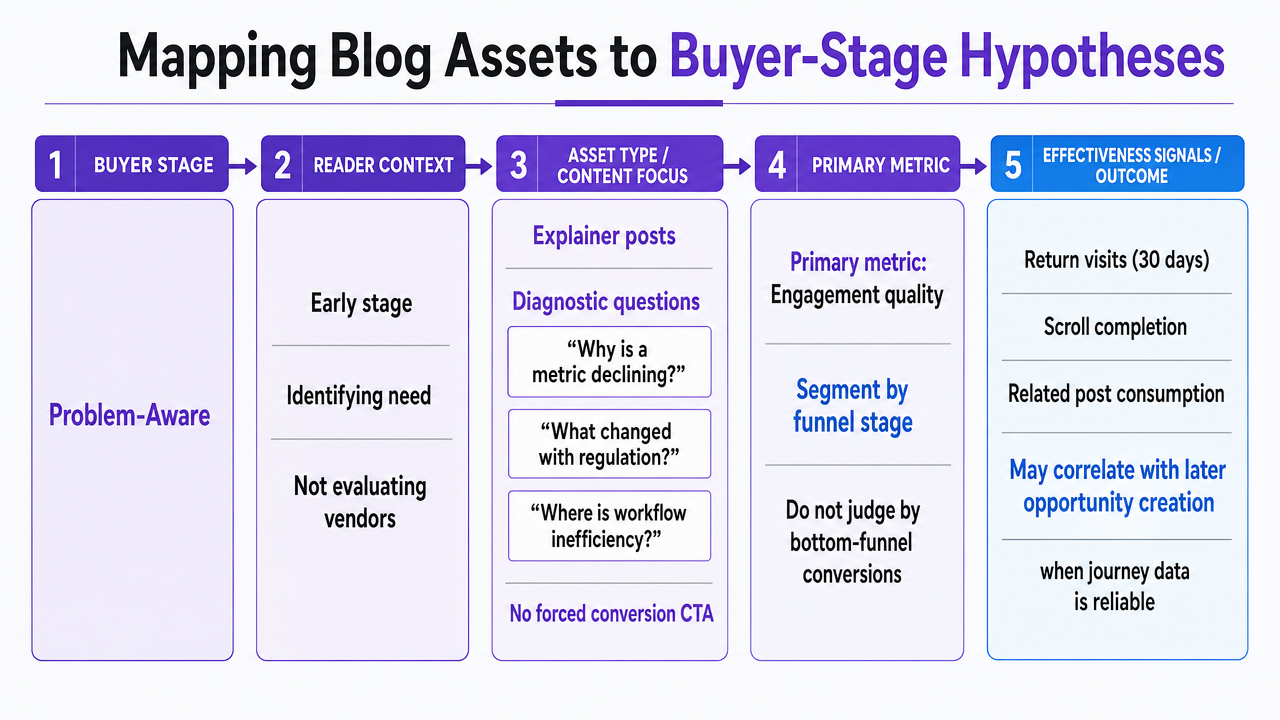 Process infographic visualizing the buyer-stage to asset-type to primary-metric mapping described across the three subsections
Separating Thought Leadership from Demand Content
Thought leadership and demand content serve distinct purposes and should not be measured by the same KPIs. Thought leadership aims to establish an organization as a credible voice through evidence-backed insights, focusing on authority and long-term influence rather than immediate leads or sales 10. Demand content, conversely, is designed to generate measurable conversion events within a defined timeframe.
This distinction impacts quarterly reporting. A thought leadership essay on a category shift may not show a direct link to influenced pipeline in the quarter it's published. Judging it solely by conversions influenced would deem it a failure. However, when evaluated by citations earned, executive-level account engagement, and its presence in late-stage sales conversations months later, its value becomes apparent.
Content teams that combine these categories under a single scoreboard often make two mistakes: authority pieces are prematurely dismissed for not meeting conversion targets they were never designed for, and demand content is diluted with abstract executive-level language, reducing its conversion effectiveness. Both content types suffer.
The solution is to use two separate scorecards. Demand content should be evaluated using the influenced revenue framework and the 40/30/20/10 weighting 7. Thought leadership should be measured against authority signals, such as account-level engagement from target firmographics, inbound earned mentions, and sales-reported influence in stage-three and stage-four conversations 11. Both contribute to the pipeline but on different timelines and require distinct measurement instruments.
Routing Blog Data Into CRM-Aligned Attribution
The measurement framework is effective only if blog data is accurately routed into the CRM where pipeline information resides. Most attribution maturity challenges are related to data plumbing rather than analytics.
Three critical connections are needed to calculate influenced revenue at the asset level. First, the web analytics layer must record which posts an account consumed and pass this "consumed-content set" to marketing automation. Second, marketing automation must link this set to a contact record and sync it into the CRM as a tracked field on the account and opportunity object. Third, the CRM needs to expose this field in pipeline reporting, allowing revenue operations to query influenced-revenue without manually reconstructing journeys each quarter 7.
A common pitfall is inconsistent naming conventions. Each blog asset requires a stable identifier that persists through URL changes, taxonomy refactors, and template migrations. Without this, the consumed-content set can become fragmented, with the same post appearing as multiple touchpoints. Assigning a permanent asset ID at publication and mapping it to buyer stage and topic cluster in a reference table provides an operational fix.
Sales-marketing alignment is also essential. Marketing and sales are linked activities 3, meaning agreement with the revenue team on which CRM stages constitute influenced-pipeline events and which fields the blog data populates is necessary. Without this agreement, discrepancies between marketing dashboards and sales forecasts can lead to skepticism from the CFO.
See How Leading Teams Turn Content Marketing Blogs into Measurable Pipeline
Request a walkthrough of AI-driven workflows that help enterprise brands and agencies scale content production, maintain brand voice, and connect blog performance directly to pipeline metrics.
Production Economics: What Scaling Output Actually Costs
Once the measurement framework and buyer-stage mapping are in place, the focus shifts to production volume and cost. The true cost begins with headcount, not per-post pricing.
The Bureau of Labor Statistics reports a median annual wage of $161,030 for advertising, promotions, and marketing managers, with senior content roles having similar ranges 4. Fully loaded costs, including benefits, payroll taxes, and equipment, typically range from 1.25 to 1.4 times the base salary. This places a senior content marketing manager's fully loaded cost in the low-to-mid $200,000 range annually, with each additional senior writer adding another six-figure cost. Scaling output quickly increases these costs.
Peer-reviewed research indicates that specialized content operations correlate with higher effectiveness 1. This implies that spreading production across generalist marketers is not the answer, and specialization comes with a cost.
Three primary production models exist, each with a distinct cost structure:
| Model | Primary cost driver | Scaling behavior |
|---|---|---|
| In-house headcount | Fully loaded salary per FTE 4 | Linear: more output requires more hires |
| Agency or freelance network | Per-project or retainer fees (varies by market) | Variable: capacity flexes, but briefing overhead grows |
| AI-assisted production with human approval | Platform fee plus editorial review hours | Sub-linear: output scales faster than review time |
Lead generation data supports continued investment in blog output, identifying blogs as one of the most efficient tactics for lead generation in 2026 benchmarks, though performance varies by industry and deal size 9. Efficiency, in this context, refers to cost per influenced conversion, not cost per post. Publishing more posts at a lower per-unit cost is ineffective if attribution does not improve. Therefore, establishing the measurement framework must precede the selection of a production model.
Operational Maturity Benchmarks Worth Tracking
Pipeline-driving programs share common operational characteristics. B2B benchmark research, surveying over 1,000 marketers, identifies regular performance measurement, documented strategy, and specialized roles as indicators of higher-maturity teams 5. Similarly, a study of 263 organizations found that strategy clarity, commitment, and performance measurement correlate with effectiveness 1.
Four key benchmarks should be tracked quarterly: First, the percentage of published posts with asset-level tracking integrated into the CRM at publication. Second, the percentage of opportunities that include at least one blog asset in their consumed-content set. Third, the ratio of influenced pipeline to fully loaded content production cost, calculated using BLS wage data 4. Fourth, the distribution channel count, maintained within an intermediate range, as research shows this outperforms both too few or too many channels 1.
Teams that report these four metrics quarterly can shift discussions from traffic numbers to which assets warrant inclusion in the next quarter's production plan and which should be retired.
Frequently Asked Questions
References
- 1.Determinants of content marketing effectiveness: Conceptual framework and empirical findings from a managerial perspective.
- 2.Marketing Analytics in the Digitized B2B Landscape: Insights into Lead Generation in Software-as-a-Service Firms.
- 3.Marketing and sales | U.S. Small Business Administration.
- 4.Advertising, Promotions, and Marketing Managers.
- 5.B2B Content and Marketing Trends: Insights for 2026.
- 6.2019 State of B2B Content Consumption and Demand Report for Marketers.
- 7.Content Marketing Metrics: Measuring Content That Drives Pipeline.
- 8.Content Marketing Metrics B2B Teams Need to Prove Revenue Impact.
- 9.40 Key Lead Generation Statistics You Should Know in 2026.
- 10.Thought Leadership Vs Content: The Ultimate Guide.
- 11.How to Accelerate Sales Pipeline With the Right Content Strategy.