
Key Takeaways
- B2B content programs are hitting an effectiveness ceiling because AI adoption has outpaced expert involvement and governance, with 89% of teams using AI for creation but only 39% reporting performance gains 1.
- Pipeline-producing content is built for the full buying committee, addressing procurement risk, finance payback math, and end-user workflow detail so champions can defend the decision internally 3.
- The operating model that compounds replaces editorial calendars with deal-stage signal prioritization, adds named approval gates at brief, draft, and final, and measures pipeline velocity rather than MQL volume 11.
- Focus next on auditing the content library against committee questions, instrumenting attribution across CRM and analytics before buying tools, and reallocating production hours toward SME-led assets that influence open opportunities.
The Adoption-Performance Gap Defining B2B Content in 2026
The defining question for B2B content marketing in 2026 is no longer whether teams are using AI. It is why so few are getting paid for it. In the Content Marketing Institute's 2026 survey of 1,015 B2B marketers, 95% report using AI-powered applications and 89% use AI specifically for content creation, yet only 39% say content performance has improved and 12% report that quality has actually declined 1. Tools are saturated. Outcomes are not.
That gap is the operating problem in front of every VP of Marketing carrying a pipeline number. Output has never been cheaper to produce, and pipeline contribution has rarely been harder to defend. The same CMI dataset shows that only 12% of B2B marketers say they exceeded their goals over the past twelve months, while 47% report merely meeting most of them 1. A majority of programs are running at adequate, not productive.
The teams closing the gap are not the ones with more tools. They are the ones treating content as a pipeline instrument: built around the buying committee, governed by approval workflows that catch the quality regressions AI introduces, and measured against opportunity influence and deal velocity rather than published volume. The rest of this article walks through how that operating model is built, and where the leverage actually sits.
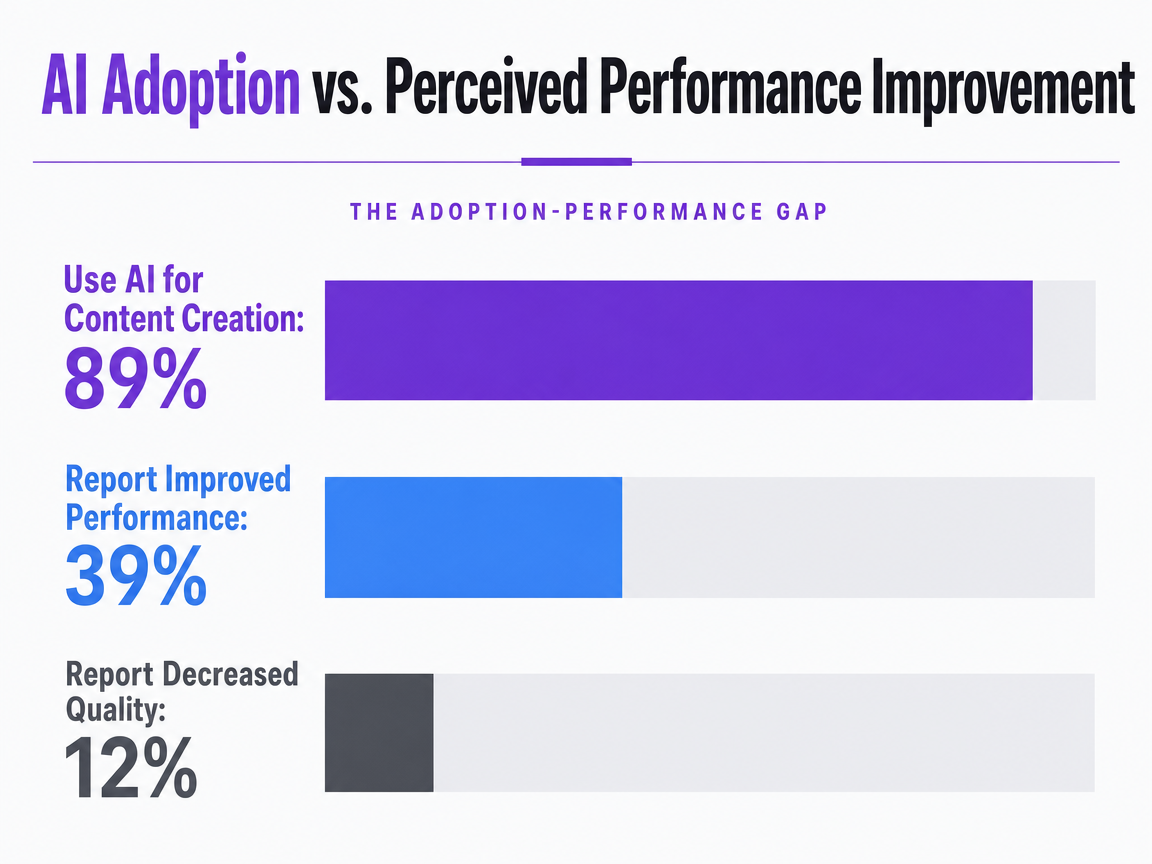 AI Adoption vs. Perceived Performance Improvement
Compares the high rate of AI adoption for content creation with the lower rate of perceived performance improvements, highlighting a gap between usage and results.
Why Volume Stopped Producing Pipeline
The Effectiveness Ceiling Most Programs Have Hit
Production capacity has outrun pipeline contribution. The Content Marketing Institute's 2026 survey of 1,015 B2B marketers reports that 96% of teams create thought leadership, but 37% of those teams say subject-matter experts contribute to less than 5% of that content 1. The result is an inventory of articles, posts, and gated assets that look like authority on paper and read like generic commentary to a buying committee.
That dynamic shows up in self-reported outcomes. The same survey finds 65% of practitioners using account-based marketing say their ABM campaigns outperform traditional marketing, while teams without that focus skew toward broader audiences and looser measurement 1. The split is not about effort. It is about whether content is built for a known set of accounts and stakeholders or pushed into a feed and hoped to convert someone.
For a VP of Marketing carrying a pipeline number, the implication is direct. Adding more pieces to a calendar does not move the ceiling. Removing pieces that lack expert input, tightening the account list, and reallocating production hours toward content the sales team can actually deploy in deals does.
Rising Budgets, Lagging Measurement
Spending is moving in one direction and accountability in another. The 2024 B2B Marketing Benchmark Report from Endeavor Business Media found that more than half of surveyed marketers planned to increase budget for content marketing, content development, and video that year 2. That intent has held into 2026 planning cycles, with content tools and AI investments now sharing the same budget lines.
The measurement infrastructure underneath that spend has not kept pace. Endeavor's report notes the risk explicitly: content budgets are rising faster than the sophistication of the systems used to attribute their impact 2. Teams are buying more capacity to produce, instrument, and distribute content while still reporting performance through traffic counts, MQL volumes, and engagement rates that no longer map cleanly to opportunity creation.
The practical consequence is a defensibility problem at budget review. A VP can show a year-over-year increase in published assets, sessions, and form fills, and still face a CFO asking which deals those numbers actually influenced. Closing that question requires measurement work that the next two sections of this article address directly.
Designing for the Buying Committee and Hidden Buyers
The Stakeholders Marketing Cannot See
The people who decide whether a B2B deal closes are rarely the ones filling out forms. A typical enterprise purchase now involves a procurement reviewer, a technical evaluator, a finance signer, an end-user champion, and at least one executive sponsor. Most of them never identify themselves to marketing. They consume content quietly, share it inside Slack threads and email forwards, and form opinions long before a sales conversation happens.
That invisibility has a price. The 2025 Edelman-LinkedIn B2B Thought Leadership Impact Report finds that more than 40% of B2B deals stall because of buyer indecision and lack of confidence inside the committee 3. Deals do not die from a lack of awareness. They die from a stakeholder no one in marketing knows about who cannot defend the choice internally.
This reframes the brief for a VP of Marketing. Content is not aimed at a persona reading alone. It is aimed at a group whose members have to persuade each other, often using the same article forwarded by a champion. The practical implication is to write for the skeptic in the room, not the enthusiast. Procurement needs risk language. Finance needs payback math. End users need workflow detail. A single asset that addresses all three reads as substantive rather than promotional, which is the only kind of content a hidden buyer will actually circulate.
Mapping Content to the Messy Middle
Most B2B buyers do their decisive work before sales ever picks up the phone. They loop between problem definition, vendor exploration, and internal validation in no fixed order, pulling in peer input and external commentary at each turn 9. The funnel diagram in the planning deck does not match what the buying committee is actually doing.
That has direct consequences for editorial planning. A content map organized by awareness, consideration, and decision stages will overproduce category-explainer assets and underproduce the artifacts buyers reach for mid-evaluation:
- implementation timelines
- integration specifics
- comparison criteria
- risk and rollback documentation
- procurement-ready summaries
McKinsey's B2B Pulse work documents that buyers now expect the same depth of self-service content in B2B that they receive as consumers, across every channel they touch 5.
The operational move is to audit the existing library against the questions a committee actually asks between first interest and signed contract. Anything that does not de-risk a specific decision should be cut or rewritten. Two well-instrumented mid-funnel assets, built with sales input and updated quarterly, tend to influence more opportunities than a dozen top-of-funnel posts written to a keyword brief alone.
Thought Leadership That Actually Influences RFPs
The bar for thought leadership has moved. The 2025 Edelman-LinkedIn report finds that high-quality thought leadership measurably increases the likelihood of being invited into an RFP and the willingness of buyers to pay a premium, while low-quality thought leadership actively damages brand perception with the same audiences 4. The asset is binary. It either earns a seat at the table or it costs one.
What separates the two is rarely format. It is the depth of original perspective and the visible involvement of someone who has done the work. CMI's 2026 survey of 1,015 B2B marketers found that 96% of teams create thought leadership, but 37% of those teams report that subject-matter experts contribute to less than 5% of the content 1. That ratio explains the quality complaint buyers report: the byline says expert, the substance does not.
For a VP carrying a pipeline number, the leverage point is the production model, not the publication schedule. Block recurring time on the calendars of the three to five senior practitioners whose opinions buyers would actually pay to hear, capture their reasoning in interviews, and structure the writing around their specific claims. One asset built that way outperforms a quarter of generic posts, and it travels through hidden-buyer networks in a way ghostwritten commentary never does.
Experience Predictable Pipeline Growth With Live Content
Test-drive data-driven content marketing and measure real pipeline impact in your own channels before you commit.
An Operating Model Built for Pipeline, Not Publishing
From Editorial Calendar to Signal-Driven Prioritization
The editorial calendar is the wrong artifact to run a B2B content program from. It rewards cadence over consequence: a slot gets filled because the slot exists, not because a deal in stage two needs a specific objection-handling brief by Friday. A signal-driven model inverts that order. Production is queued by what the pipeline is telling the team, not by what the calendar demands.
The signals are already in the stack:
- Win-loss notes flag the objections that close deals or kill them.
- Sales call recordings expose the questions a champion cannot answer when finance joins the room.
- Search behavior and intent data show which accounts are researching what, and when.
- CRM stage transitions reveal where deals stall and which assets, if any, were touched before they moved.
McKinsey's B2B Pulse work documents that high-growth B2B companies orchestrate content across channels in response to where buyers actually are, rather than pushing the same sequence at every account 5.
The practical change is procedural. Replace the weekly editorial meeting with a prioritization review that ranks open production requests against active opportunities, stalled deals, and target accounts. The brief that supports a six-figure deal in evaluation outranks the keyword post scheduled for next Tuesday.
Governance, Approval, and the AI Quality Problem
The quality decline reported in the CMI 2026 survey is not a mystery. When 89% of B2B teams use AI for content creation and 12% report that quality has decreased, the loss is usually traced to a missing checkpoint between generation and publication 1. Drafts ship that no expert read. Claims publish that no one verified. The volume goes up, the substantiation goes down, and the buying committee notices before the marketing team does.
Governance is the answer that most programs underbuild. An approval workflow that requires named human sign-off at three points - brief, draft, and final - catches the regressions AI introduces without slowing throughput to a crawl.
- The brief stage forces a clear claim and audience.
- The draft stage forces source verification.
- The final stage forces a sales or SME read on anything that will be quoted back in a deal.
The same survey shows only 9% of B2B teams are prioritizing investment in people and training in 2026, against 45% prioritizing AI tools 1. That ratio predicts the quality outcome. Tools without trained reviewers produce faster bad content. The fix is procedural before it is technological: define who approves what, what evidence each approver requires, and what gets rejected without negotiation.
Personalization as a Capability Stack, Not a Tactic
Personalization in B2B is often reduced to a first-name token in an email subject line. The McKinsey explainer treats it as something more demanding: a stack of capabilities including a unified customer data foundation, analytics that score propensity and intent, a decision engine that triggers the next action, and content playbooks built to be assembled in pieces rather than published as monoliths 6. Each layer depends on the one beneath it. Skipping any of them turns personalization into theater.
For a VP of Marketing, the operational question is which layer is actually missing. Most programs have data scattered across a marketing automation platform, a CRM, and a web analytics tool that do not reconcile. Without that reconciliation, the decision engine has nothing reliable to act on, and the content playbook collapses back into one-size-fits-all assets. McKinsey notes that poorly governed personalization can feel intrusive, which makes the trust cost real when the stack is half-built 6.
Build the data layer first. Tag content by stakeholder role, deal stage, and objection type before investing in the engine that routes it.
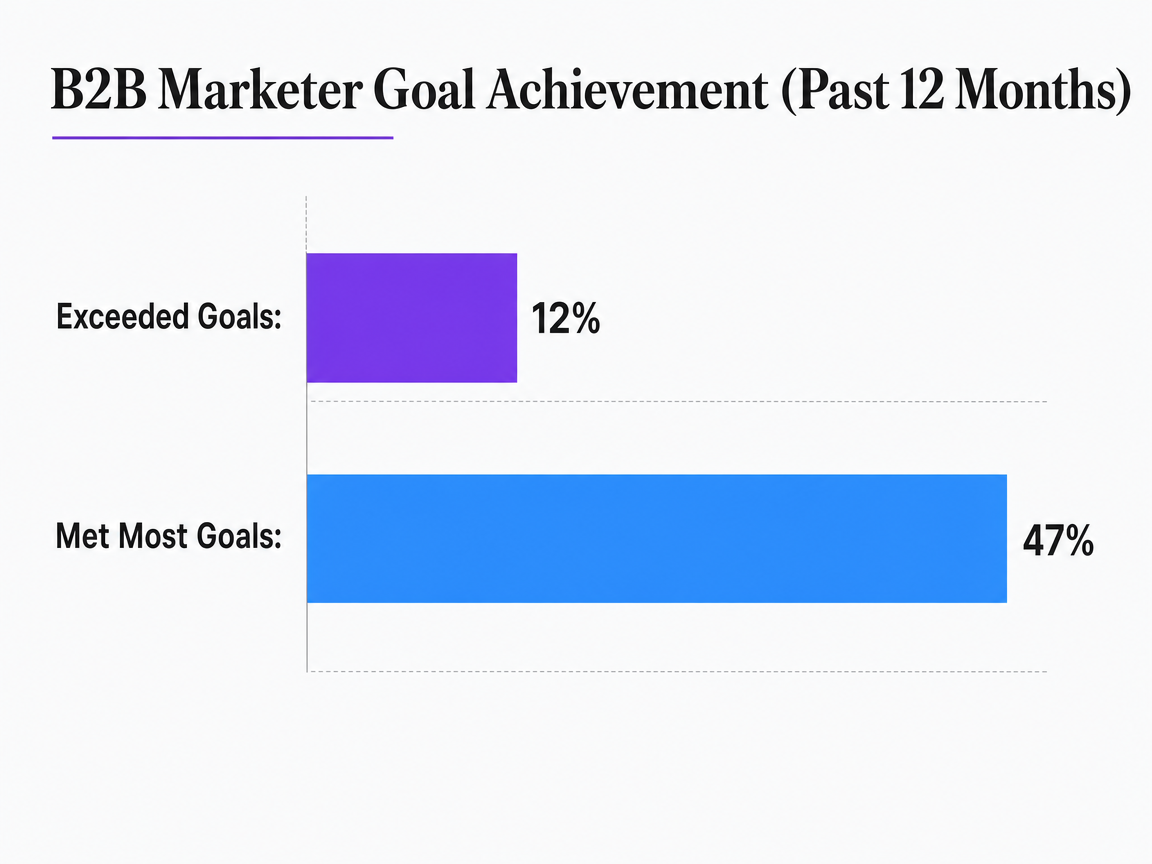 B2B Marketer Goal Achievement (Past 12 Months)
Comparison of self-reported goal achievement by B2B marketers, indicating a minority feel they are highly effective.
Measuring Content Against Opportunity Influence and Velocity
Replacing MQL Volume with Pipeline Velocity
The MQL number is the easiest report to produce and the hardest to defend. It counts hand-raises, not deals. A VP of Marketing presenting a 30% year-over-year lift in MQLs to a CFO who has watched closed-won revenue stay flat is making the wrong argument with the wrong data.
Pipeline velocity is the metric that maps content to revenue with fewer assumptions. The standard formulation is the number of qualified opportunities multiplied by average deal size and win rate, divided by sales cycle length 11. Every term in that equation is a place content either helps or fails to help. A mid-funnel asset that resolves a procurement objection compresses cycle length. A comparison brief that arms a champion increases win rate. A research-backed thought leadership piece that earns an RFP invitation expands opportunity count 4.
The operational shift is to instrument content against those four variables rather than against form fills. Tag each asset with the deal-stage objection it is built to resolve, then track whether opportunities that touched it move faster than opportunities that did not. That cohort comparison is the report a CFO will engage with, and it survives quarter after quarter in a way that MQL trendlines do not.
Multi-Touch Attribution Without the Vendor Theater
Multi-touch attribution gets sold as a software purchase. It is a data integration problem first. The work of connecting marketing automation, CRM, and analytics so that every touchpoint - ad view, page visit, asset download, sales email open - links back to an account and an opportunity is what makes any attribution model usable 7. Buying a tool before that plumbing is in place produces dashboards that look authoritative and trace nothing.
The model choice matters less than the discipline of using one consistently. First-touch overweights awareness. Last-touch overweights the closing motion. W-shaped and algorithmic models distribute credit across the journey, which is closer to how committee deals actually progress 7. None of them are correct in an absolute sense. They are lenses.
The useful discipline is to pick one model, run it for at least two full sales cycles, and look at which content types consistently appear in the touchpoint paths of closed-won deals versus closed-lost. That pattern recognition - not the percentage credit assigned to any single asset - is what tells a VP where to reallocate production hours next quarter.
Benchmarking Content ROI With Appropriate Skepticism
Public ROI benchmarks for content marketing should be read with the methodology section open. A widely cited SaaS benchmarks roundup reports that B2B SaaS companies see a 702% ROI from SEO and a 420% ROI from content marketing, with SEO breaking even in roughly seven months 8. The figures are directionally useful and structurally suspect. They are aggregated across vendors with different definitions of cost, attribution windows, and what counts as content-influenced revenue.
The number a VP of Marketing should care about is the one calculated against their own pipeline. That means defining fully loaded content cost - production hours, tooling, distribution spend, sales enablement time - and dividing influenced pipeline by that cost using the attribution model chosen in the previous step. The result will not match a 702% headline, and that is the point. It will match the deal book.
Use external benchmarks to challenge internal complacency, not to set targets. If an internal program is returning a fraction of what aggregated industry data suggests is possible, that is a prompt to audit measurement and production quality, not a verdict on the channel.
See How Leading B2B Teams Build Predictable Pipeline with Data-Driven Content
Request a walkthrough of AI-powered workflows proven to increase B2B content efficiency, conversion rates, and pipeline—without adding headcount or managing multiple vendors.
If You Operate Multiple Locations, Practices, or Branches
Why Localized Content Programs Break Under Coordination Load
A note on audience before this section develops: the operating problem here belongs to VPs of Marketing inside multi-location service organizations - dental support organizations, behavioral health groups, law firm networks, home services franchises, senior living portfolios. Single-location readers can skip ahead.
The content surface area in a multi-location business is not linear with location count. It is closer to quadratic. Each location needs its own landing page, localized keyword coverage, location-specific citations and backlinks, and reviews handled at the local level 10. Layer in service-line variation - a DSO with implant, ortho, and general practice content per office, or a law firm network with practice-area pages per state - and the production matrix gets unmanageable inside a normal editorial calendar.
The breakage shows up in coordination, not creativity. Briefing cycles multiply across regional managers, compliance reviewers, and local practitioners who need to approve clinical or legal language. CMI's 2026 survey of 1,015 B2B marketers found that only 9% of teams are prioritizing investment in people and training, against 45% prioritizing AI tools 1. In a multi-location context, that ratio guarantees a bottleneck: the tooling can generate fifty location pages in a day, the human approval path cannot clear them in a quarter.
A Directional Economics Comparison: Per-Location Agency vs. Consolidated Orchestration
The economics comparison below uses variables only. It is illustrative of how the cost structure decomposes, not a benchmark. Substitute the operator's own retainer, headcount, and license figures before drawing any conclusion.
| Cost Component | Per-Location Agency Model | Consolidated Orchestration Model |
|---|---|---|
| External fees | Agency retainer R × N locations | Single platform license L (largely fixed across N) |
| Internal coordination | Coordination FTE(s) C scaling with N briefing cycles | Reduced coordination overhead; one approval workflow across N |
| Localized output cadence | Variable per agency; uneven across locations | Templated localization at scale, approved centrally |
| Quality governance | Distributed across vendors; inconsistent SME review | Centralized approval gates at brief, draft, final |
| Attribution and reporting | Fragmented across N reporting formats | Unified instrumentation across locations |
The break-even logic is straightforward. Once N exceeds the point where R × N plus coordination FTE cost exceeds L plus reduced coordination overhead, consolidation pays back. The threshold is sensitive to two inputs operators routinely under-measure: the true time cost of briefing cycles across regional managers, and the quality penalty when SME participation drops below the 5% floor CMI identified in 37% of thought leadership programs 1. The Endeavor benchmark notes that content budgets continue to rise across B2B, which raises the stakes of getting the model right before scaling spend further 2. Run the numbers with the operator's actual N, R, and C before committing to either path.
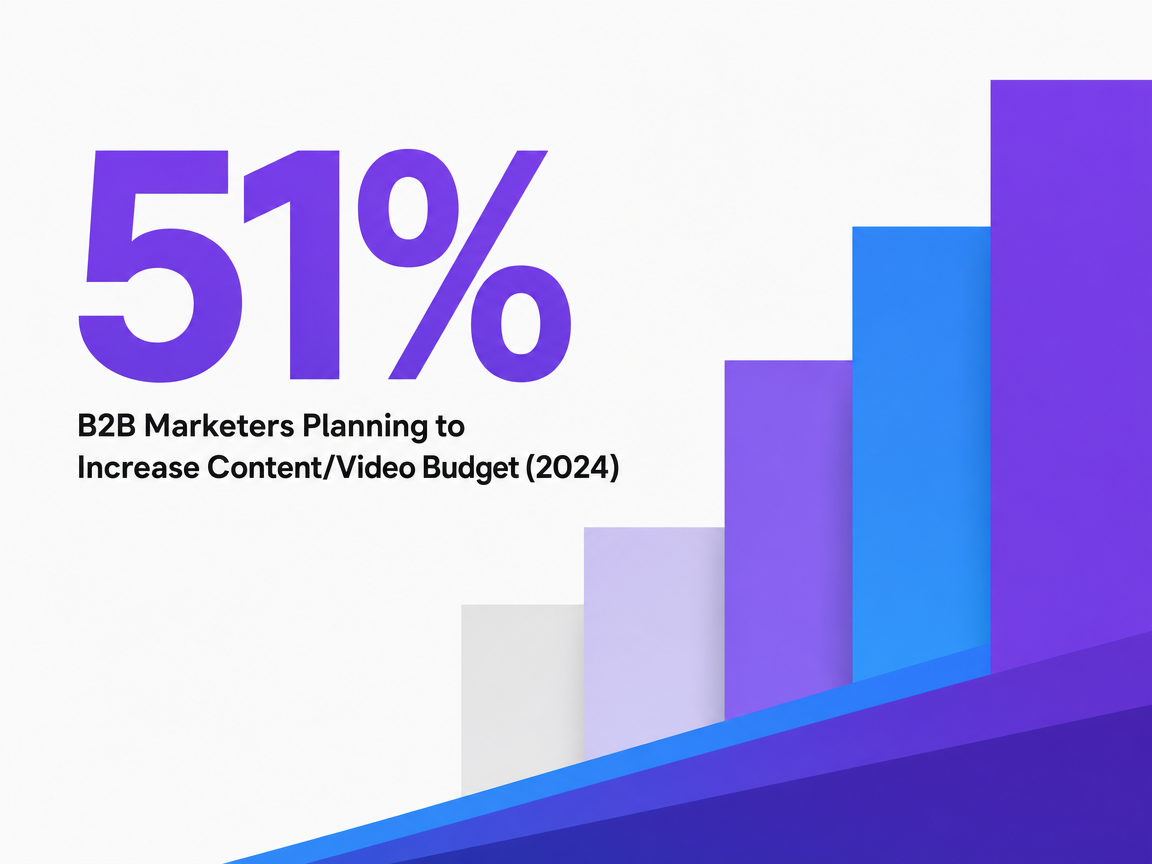 B2B Marketers Planning to Increase Content/Video Budget (2024)
B2B Marketers Planning to Increase Content/Video Budget (2024)
The Operator Decision in Front of You
The B2B content question facing a VP of Marketing in 2026 is not whether to invest more. Budgets are already rising, with more than half of B2B marketers planning to increase content and video spend 2. The question is whether the next dollar buys more output or more pipeline influence, and those are not the same purchase.
Three decisions separate programs that compound from programs that plateau:
- Whether content production is queued by editorial calendar or by deal-stage signal.
- Whether approval gates exist at brief, draft, and final, or whether AI-assisted drafts ship without an expert read.
- Whether reporting tracks MQL volume or pipeline velocity instrumented against the four variables in the equation: opportunity count, deal size, win rate, and cycle length 11.
None of these require more headcount. They require an operating model where research signals, prioritization, approval, execution, and attribution close into a single loop a small team can run. That loop is what platforms like Vectoron are built to coordinate. The decision in front of the operator is which loop the next budget cycle funds.
Frequently Asked Questions
References
- 1.B2B Content and Marketing Trends: Insights for 2026.
- 2.2024 B2B Marketing Benchmark Report (Endeavor Business Media).
- 3.How B2B Marketers Can Use Thought Leadership to Influence Hidden Buyers.
- 4.2025 Edelman - LinkedIn B2B Thought Leadership Impact Report.
- 5.McKinsey B2B Pulse 2024 (Five fundamental truths: How B2B winners keep growing).
- 6.What is personalization?.
- 7.The Essential Guide to Multi-Touch Attribution in B2B.
- 8.60+ SaaS Marketing Statistics & Benchmarks for 2026.
- 9.B2B Buyer Journey.
- 10.The Secrets to Successful Multi-location Business Marketing.
- 11.How to Measure Your B2B Marketing ROI.