
Key Takeaways
- Treat growth strategy as a continuous operating loop—signal, priority, approval, execution, measurement—rather than a static channel plan, since buyers now move across ten interaction channels per purchase 1.
- Gate every spend decision with a written ICP and engage multiple decision-makers per account early, a lever that can lift win rates by up to 45% 10.
- Instrument three measurement tiers with frozen definitions: Tier 3 engagement weekly, Tier 2 HIRO pipeline bi-weekly, and Tier 1 revenue monthly to close the perception-versus-impact gap 4.
- Diagnose spend against GTM motion using benchmarks of 13% product-led, 10% hybrid, 9% sales-led, then sequence organic before paid and events within honest capacity limits 9.
Why Channel Plans Stopped Producing Pipeline
The average B2B buyer now moves across ten interaction channels during a single purchase decision, up from five in 2016 1. This doubling of the channel surface marketing must coordinate, while in-house teams remain largely the same size, is the core issue behind recent flat pipeline reports.
A traditional channel plan assumes a linear buyer journey designed by the marketing team. In contrast, a growth strategy acknowledges that buyers are already navigating multiple channels independently. The team's role shifts to ensuring consistent, measurable presence at each touchpoint. The former approach yields campaigns; the latter drives pipeline.
This shift is critical because over half of B2B buyers expect an omnichannel experience and penalize fragmented journeys with lower satisfaction and slower deal progression 1. Simply adding another channel without integrating it into a cohesive strategy dilutes the marketing signal and overburdens already capacity-constrained teams.
This article frames marketing growth strategy as an operating system. It will sequentially build this system: starting with ICP definition, moving to a three-tier measurement stack, budget allocation based on go-to-market motion, channel orchestration, capacity planning, and finally, the marketing-to-sales handoff required by hybrid buying models.
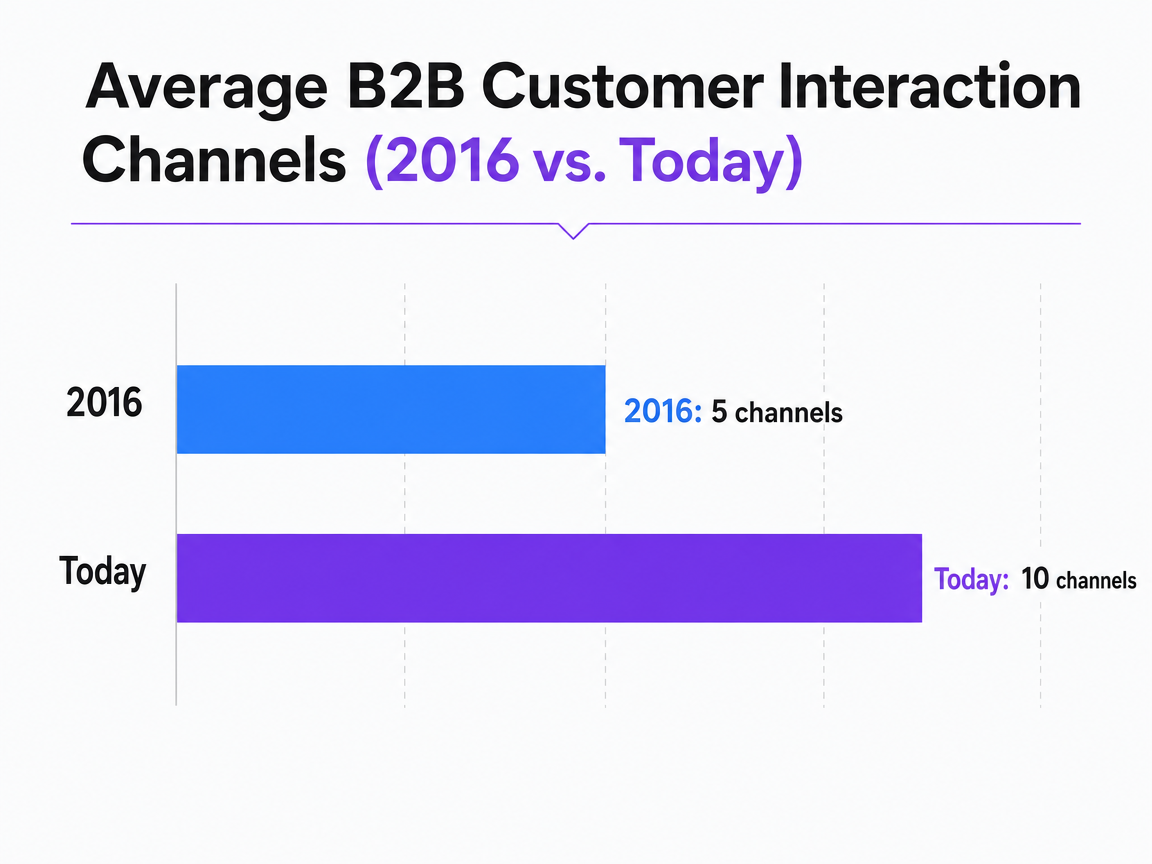 Average B2B Customer Interaction Channels (2016 vs. Today)
The average number of channels B2B customers use in their buying journey has doubled from five in 2016 to ten today.
The Growth Strategy as an Operating Loop
Signal, Priority, Approval, Execution, Measurement
A pipeline-producing growth strategy operates as a continuous loop, not a static document. It comprises five stages:
- Signal capture from buyers and the market
- Priority ranking aligned with pipeline goals
- Human approval
- Cross-channel execution
- Measurement that informs the next cycle's signals
Each stage is observable and has a clear owner.
Signal represents raw input, including keyword trends, paid auction shifts, sales call themes, review-site activity, and intent data from content engagement. Insight Partners identifies SEO, content, and B2B review sites as foundational organic channels because they generate dense, cost-effective signals about buyer intent before any form fill occurs 3. Without instrumenting these inputs, the operating loop runs blind.
Priority involves ranking these signals against finite capacity. For instance, a competitor's outage causing a spike in branded search might not warrant a campaign, but a 12% drop in MQL-to-SQL conversion almost certainly does. The B2B Playbook's third-tier framework formalizes this ranking by linking early engagement signals to HIRO (High-Intent, Ranked Opportunity) pipeline outcomes, ensuring priorities are set for opportunities with a 25% or higher likelihood of closing, rather than focusing on vanity metrics 4.
Approval gates the execution phase, which then ships the work. Measurement completes the loop by feeding pipeline velocity, CAC payback, and marketing-sourced revenue back into the signal layer, initiating the next cycle 10.
Where Most In-House Teams Break the Loop
The operating loop frequently breaks at predictable points. A common failure is the disconnect between signal and priority: data from various tools flows in, but it's not consistently ranked against pipeline targets. Priorities often get set by the loudest voice, not by the funnel's actual needs. The CMO Survey highlights a related issue: marketing leaders often perceive their impact higher than other executives, a gap that arises when the measurement stage fails to inform priority setting 6.
Another critical breakpoint is execution throughput. Even with accurate priority ranking, teams can ship late if the channel surface has outgrown their capacity. McKinsey's research indicates buyers interact with an average of ten channels per purchase 1. This means a five-person team is effectively responsible for producing content for two channels per person, every week, which is unsustainable for most in-house functions.
The third common issue is approval drift. This can manifest as approval becoming a bottleneck, causing delays and compounding opportunity costs, or as approvals being skipped, leading to work that deviates from strategic positioning. Both scenarios negatively impact the pipeline.
Identifying the broken seam is the initial operational task. The remainder of this article assumes the loop is the fundamental unit of work and builds each stage based on data.
ICP Definition as the First Pipeline Lever
Moving From Volume Goals to Quality Goals
Lead volume is easily inflated but often provides little value. Doubling MQLs without improving the close rate merely increases the sales team's triage burden, not the company's booked revenue. The 2025 Demand Generation Benchmark Survey confirms a trend: more B2B organizations are now prioritizing lead quality over raw volume, and adjusting attribution to track accounts that genuinely progress to opportunity 5.
A well-defined Ideal Customer Profile (ICP) makes quality goals actionable. Without a written ICP—detailing firmographic fit, technographic signals, trigger events, and a disqualification list—quality remains subjective. With one, every campaign brief includes a pass/fail test before launch, and every measurement tier uses the same definition of a qualified prospect.
The practical impact on the pipeline is evident in two areas. Conversion rates between stages improve due to a denser pool of qualified prospects. Additionally, CAC payback periods shorten because closed deals more closely align with the product's intended audience. Insight Partners emphasizes ICP understanding and alignment across marketing, sales, and customer success as foundational work, not a later refinement, before scaling channels 3.
A volume-focused team views the ICP as a presentation slide, while a quality-focused team treats it as the gating logic for every spending decision.
Engaging Multiple Decision-Makers Early
While a precise ICP narrows marketing's focus, the next lever is engaging multiple stakeholders within each target account before a sales conversation. B2B purchases now involve buying committees of five to ten individuals, and early engagement with multiple decision-makers can increase win rates by up to 45% 10. This is not a minor tactic but potentially the most significant variable most teams can influence within their existing pipeline.
This strategy directly impacts pipeline velocity. Velocity is calculated as opportunities multiplied by average deal value multiplied by win rate, divided by sales cycle length 10. ICP work enhances the numerator by improving opportunity quality and win rates. Multi-threading further boosts it by adding to the win-rate multiplier and shortening sales cycles, as deals are less likely to stall due to champion turnover or budget shifts.
Operationally, this changes campaign briefs. Instead of targeting a single persona per asset, marketing develops parallel content tracks for the economic buyer, technical evaluator, and end-user within the same account. Content is sequenced so each role receives relevant evidence within the first two weeks of engagement.
The direct measurement consequence is that account-level engagement breadth—the number of distinct roles from a target account that interacted with marketing in the last 30 days—becomes a leading indicator for Tier 2 pipeline metrics.
Test Pipeline-Driven Strategy Execution in Real Time
Experience data-backed pipeline growth with live, publishable content during your trial—no delays, no barriers.
The Three-Tier Measurement Stack
Tier 3 Engagement, Tier 2 HIRO Pipeline, Tier 1 Revenue
A robust, pipeline-grade measurement stack consists of three tiers. Confusing these tiers is a common reason marketing dashboards fail to impress during board reviews.
- Tier 3 focuses on engagement: ICP-fit traffic, content consumption depth, return visits, and account-level activity.
- Tier 2 tracks HIRO (High-Intent, Ranked Opportunity) pipeline—opportunities in stages with a historical close rate of 25% or higher.
- Tier 1 measures revenue impact: marketing-sourced and marketing-influenced revenue, pipeline velocity, and CAC payback 4.
These tiers are structured in a specific order for a reason. Tier 3 verifies that campaigns reach the correct audience before any pipeline conclusions are drawn. Tier 2 confirms that engagement translates into opportunities that the sales team values. Tier 1 reports the financial outcomes that concern the board. Bypassing these tiers and jumping directly to Tier 1, often due to revenue pressure, hinders the ability to diagnose why numbers fluctuate, as no upstream signals are recorded.
The benefit of instrumenting all three tiers is increased attribution confidence. The 2025 Demand Generation Benchmark Survey reports that 72% of companies saw a year-over-year revenue increase of up to 25% attributed to marketing-sourced leads, a claim that necessitates a full measurement stack to substantiate 5. Teams relying solely on engagement metrics cannot claim this contribution, and those focusing only on revenue cannot explain it.
Operationally, each tier has a distinct review cadence:
- Tier 3 is reviewed weekly due to its rapid changes and its role in informing the next sprint.
- Tier 2 is reviewed bi-weekly against pipeline targets and win-rate trends.
- Tier 1 is reviewed monthly with finance and quarterly with the board.
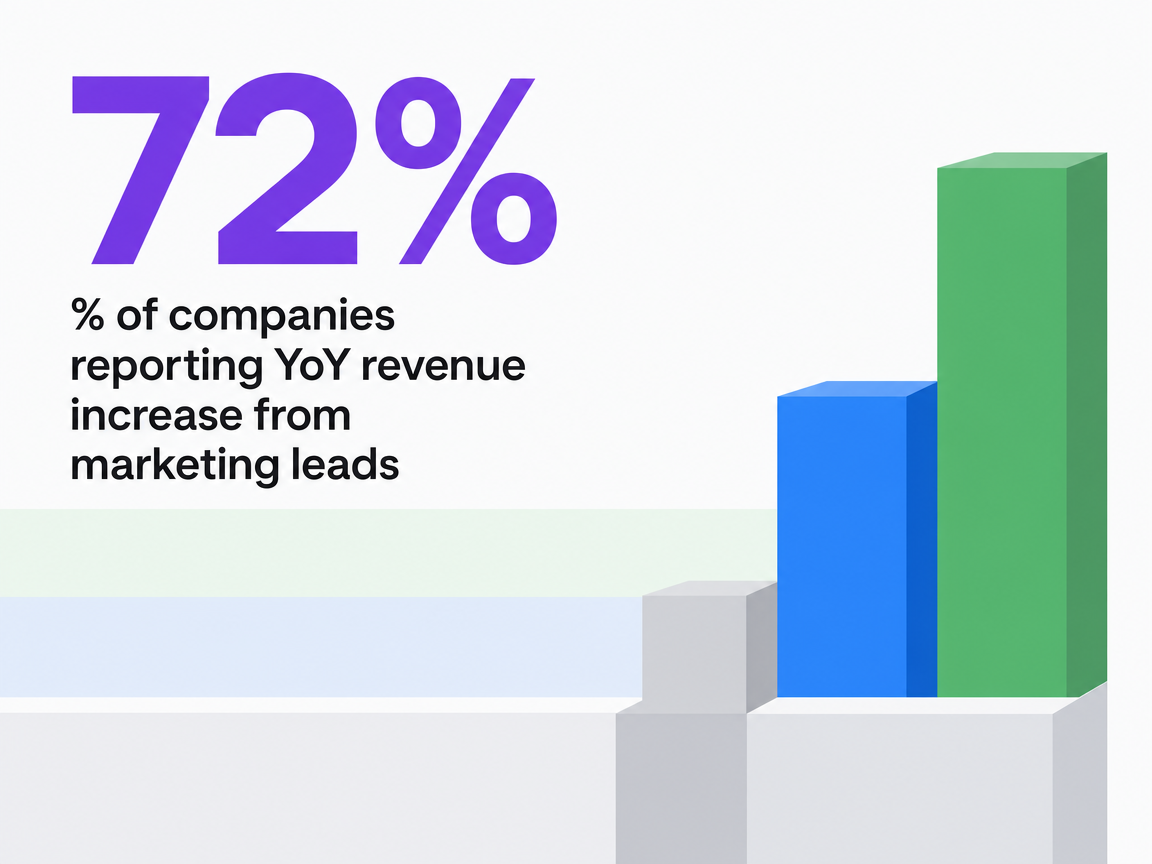 % of companies reporting YoY revenue increase from marketing leads
% of companies reporting YoY revenue increase from marketing leads
Closing the Perception-vs-Impact Gap
Even fully instrumented teams often face a credibility challenge. The CMO Survey has consistently shown that marketing leaders rate their contribution to firm performance higher than other executives, a gap that widens during periods of revenue softening and increased scrutiny on spending 6. The three-tier stack is designed to bridge this gap with auditable data for the CFO.
The final step is to clearly define and freeze each tier's metrics before the quarter begins. HIRO pipeline is defined by the historical close rate of included stages, not by marketing's desired credit. Marketing-sourced revenue uses a documented attribution rule—first-touch, multi-touch, or self-reported via an open-text source field—applied consistently across all campaigns 4. Pipeline velocity employs the same formula used by sales operations, avoiding marketing-specific variants.
Freezing these definitions eliminates quarterly debates about what counts. Once the rules are stable, the conversation shifts from whether marketing produced pipeline to which inputs influenced which tier, aligning with the purpose of the operating loop.
Budget Posture: Reading the Diagnostic
Spend as a Share of Revenue by GTM Motion
Marketing spend benchmarks become valuable when they serve as a diagnostic tool rather than mere trivia. The 2025 B2B SaaS Marketing Benchmarks report indicates median marketing spend at 13% of revenue for product-led companies, 10% for hybrid models, and 9% for sales-led models 9. These figures reflect actual spending by peer companies, not prescriptive targets. The diagnostic question is whether a team's current spend ratio aligns with its stated go-to-market motion.
A sales-led company spending 13% of revenue on marketing might be funding a motion it doesn't effectively execute or carrying program waste that a tighter ICP would expose. Conversely, a product-led company spending 9% is likely under-investing in the demand engine crucial for its self-serve conversion path 9. A hybrid company spending 7% is likely starving the function responsible for both inbound and field-supported pipeline.
This ratio also frames discussions with finance. Insight Partners suggests that in an environment of slower funding and rising CAC, sharper discipline is needed in marketing spend, with a deliberate shift towards retention and expansion alongside new acquisition 8. Analyzing the spend ratio against the GTM motion helps a VP determine whether the next dollar should be allocated to acquisition, expansion, or measurement infrastructure before being assigned to another channel.
Investment Posture for 2024-2025
The overall trend in B2B marketing budgets is more stable than headlines suggest. The 2024 B2B Marketing Benchmark Report shows 45% of marketers anticipate budget increases, 43% expect budgets to remain flat, and only 12% foresee cuts 7. This indicates a function under scrutiny but not in retreat. The focus has shifted from defending the budget line to justifying the output of each dollar spent.
For a VP interpreting this diagnostic, two operational steps follow:
- A flat budget should be treated as a directive to reallocate, moving spend from channels that cannot be linked to Tier 2 pipeline towards those that can.
- The next planning cycle should begin with a documented spend ratio, a clear GTM motion, and a frozen Tier 1 attribution rule. This ensures budget discussions are anchored to pipeline outputs rather than activity inputs.
The diagnostic is complete when the spend ratio, GTM motion, and measurement stack present a cohesive narrative. Discrepancies between these elements highlight areas requiring immediate attention.
Channel Orchestration: Sequencing Organic, Paid, and Events
Channel orchestration is an area where many teams simultaneously overspend and underperform. The common mistake is treating channels as independent bets rather than a sequence with dependencies. Insight Partners outlines a clear sequence: organic demand (SEO, content, and B2B review sites) forms the foundation, with paid digital and events layered on top once the organic base generates measurable intent signals 3. Bypassing this foundational step inverts the economics. Paid spend without organic groundwork means paying full price for clicks that could have been acquired for less, and events without nurturing content result in business cards that never progress beyond Tier 3 engagement.
This sequencing logic is operational, not philosophical. Organic channels provide intent data—keyword movement, content consumption depth, review activity—that guides paid campaigns on where to bid and events on whom to invite. Paid then accelerates the journey from intent to conversation for accounts identified by the organic layer. Events facilitate closing high-value accounts by adding the in-person interaction that remains valuable in hybrid buying models 2. Each layer enhances the efficiency of the subsequent one.
The quarterly decision for a VP is not which channels to run, but in what order to fund them. A growth team launching a paid program before its organic base generates ICP-fit traffic is acquiring volume it cannot qualify. A team adding events before its nurture sequence can effectively follow up is generating meetings it cannot convert. Proper sequencing protects CAC payback by ensuring each channel receives qualified inputs from the preceding one, rather than each channel independently sourcing its audience.
See How Leading Teams Build Predictable Pipeline with Data-Driven Execution
Request a walkthrough of unified AI-powered workflows designed to help agencies and enterprise brands drive measurable pipeline growth—without expanding headcount or managing multiple vendors.
Capacity Math: What a Team of N Can Actually Run
Strategy quality is rarely the primary bottleneck for in-house teams; throughput is. With buyers active across an average of ten channels per purchase 1 and growth teams expected to cover six core marketing surfaces—content, SEO, paid, backlinks, social, and call intelligence—the challenge isn't which channels to run, but how many a given headcount can operate at a production-grade level.
The following table uses team size as the explicit variable, assuming one senior leader plus generalists, no embedded engineering, and channels run at a cadence sufficient to feed Tier 2 HIRO pipeline, not just Tier 3 engagement 4.
| Team size | Channels at production grade | Practical posture |
|---|---|---|
| 3 people | 2 channels | Organic foundation only—SEO and content, with paid paused until the base produces ICP-fit traffic 3 |
| 6 people | 3 to 4 channels | Organic plus paid, with social or call intelligence added as a fourth once attribution holds 3 |
| 10 people | 5 to 6 channels | Full surface coverage possible, but only with a dedicated operations lead managing the loop |
A common scenario VPs encounter is a six-person team tasked with ten-channel coverage, then evaluated on Tier 1 revenue contribution despite this capacity gap. This gap cannot be closed by simply working harder. It requires either narrowing the channel set, increasing headcount, or shifting execution to an orchestration layer that can handle production volume while the team retains approval and judgment. The third option, leveraging AI-assisted execution platforms—including Vectoron—can change the capacity equation without expanding the organizational chart.
The Marketing-to-Sales Handoff in a Hybrid World
Hybrid selling is now the dominant B2B motion, with buyers viewing remote, digital, and in-person channels as equally valid for closing deals 2. The marketing-to-sales handoff must adapt to this reality. A lead form is no longer the sole handoff point; it's one of several signals a sales team considers alongside self-service activity, review-site visits, and direct buyer-initiated outreach.
The operational implication is that marketing's role extends beyond MQLs, continuing into the opportunity stage by providing multi-threaded content that keeps the buying committee engaged across various modes. The same multi-decision-maker engagement that can increase win rates by up to 45% requires marketing to continue producing assets for technical evaluators and end-users even after sales has engaged the economic buyer 10. Cutting off marketing at the opportunity line forfeits this potential lift.
The handoff also requires instrumentation. Pipeline velocity, CAC payback, and win rate are now joint metrics, not solely sales metrics, because marketing's nurturing activities within the opportunity influence all three 10. A growth strategy that concludes with lead delivery measures only half the loop. One that extends through the close measures the half that determines the value of the pipeline built.
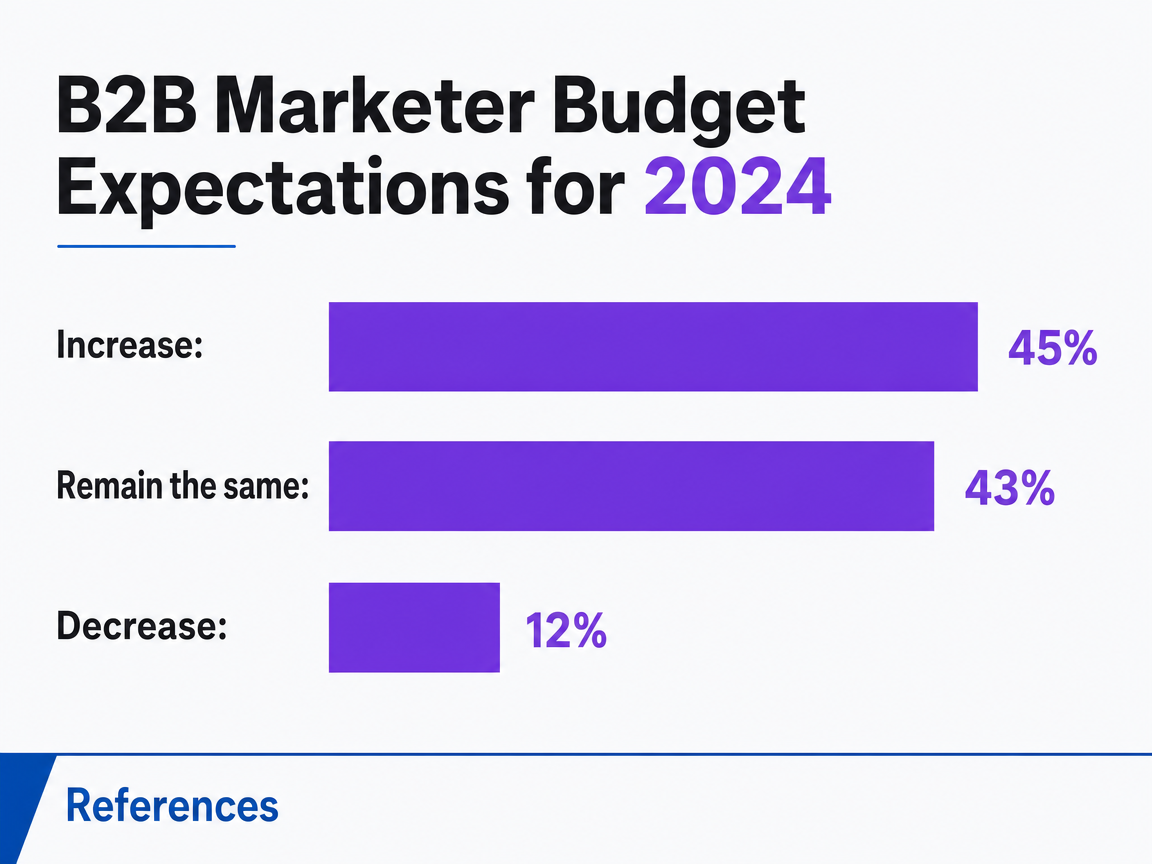 B2B Marketer Budget Expectations for 2024
Breakdown of B2B marketers' budget expectations for 2024: 45% expect an increase, 43% expect it to remain the same.
Frequently Asked Questions
References
- 1.Five fundamental truths: How B2B winners keep growing.
- 2.The future of B2B sales is hybrid.
- 3.The top 3 questions founders have about SaaS B2B demand gen.
- 4.Demand Generation KPIs: 3 Tiers of Metrics You Must Measure.
- 5.2025 Demand Generation Benchmark Survey.
- 6.The CMO Survey: March 2023 Topline Report.
- 7.2024 B2B Marketing Benchmark Report.
- 8.SaaS marketing benchmarks: 3 budgeting and strategy trends for 2024.
- 9.2025 B2B SaaS Marketing Benchmarks.
- 10.3 GTM Benchmarks That B2B SaaS Companies Must Track In 2026.