
Key Takeaways
- Forecast variance is a campaign design problem: treating launches as discrete events instead of a continuous signal-to-revenue loop lets pipeline swing on the timing of any single asset or channel.
- Journey mapping, scored lead prioritization paired with multi-touch attribution, and cross-channel orchestration built around asymmetric effects are the structural levers that narrow forecast bands 9, 11.
- Compliance belongs upstream in production, not post-launch review, because takedowns and disclosure fixes pull conversion assets out of rotation and register as variance long before they register as legal issues 1.
- Execution capability itself contributes to profitability beyond conventional inputs, so leaders should focus next on compressing the coordination layer—one queue, one decision log, one measurement surface—rather than raising budgets 8.
Why Forecast Variance Is a Campaign Design Problem
Missed forecasts rarely trace back to a bad quarter. They trace back to how campaigns were built in the first place. When each launch runs as a standalone event—brief, produce, ship, report—pipeline output swings on the timing of any single asset, channel, or vendor cycle. The CFO reads that swing as variance. The board reads it as risk.
Marketing leaders under pressure to hit a number quarter after quarter face a design question, not a spending question. Peer-reviewed work on digital marketing capability finds that execution capability itself contributes to firm profitability beyond conventional inputs 8. Spending more into a fragmented operating model widens the variance band; tightening the model narrows it.
Three design flaws recur inside teams that miss forecast:
- Campaigns are planned as discrete launches rather than a continuous loop.
- Channels are staffed and measured in silos, so cross-channel effects go unaccounted for.
- Lead handoffs happen on volume, not on scored intent, so sales capacity gets absorbed by contacts that will not close inside the forecast window.
The sections that follow treat campaigns as a governed system: signal capture, journey design, prioritized scoring, coordinated channels, and defensible attribution. Each component maps to a specific lever that compresses forecast variance rather than chasing a bigger top-line number.
The Signal-to-Revenue Loop Replaces the Launch Calendar
From Discrete Launches to a Continuous Operating Loop
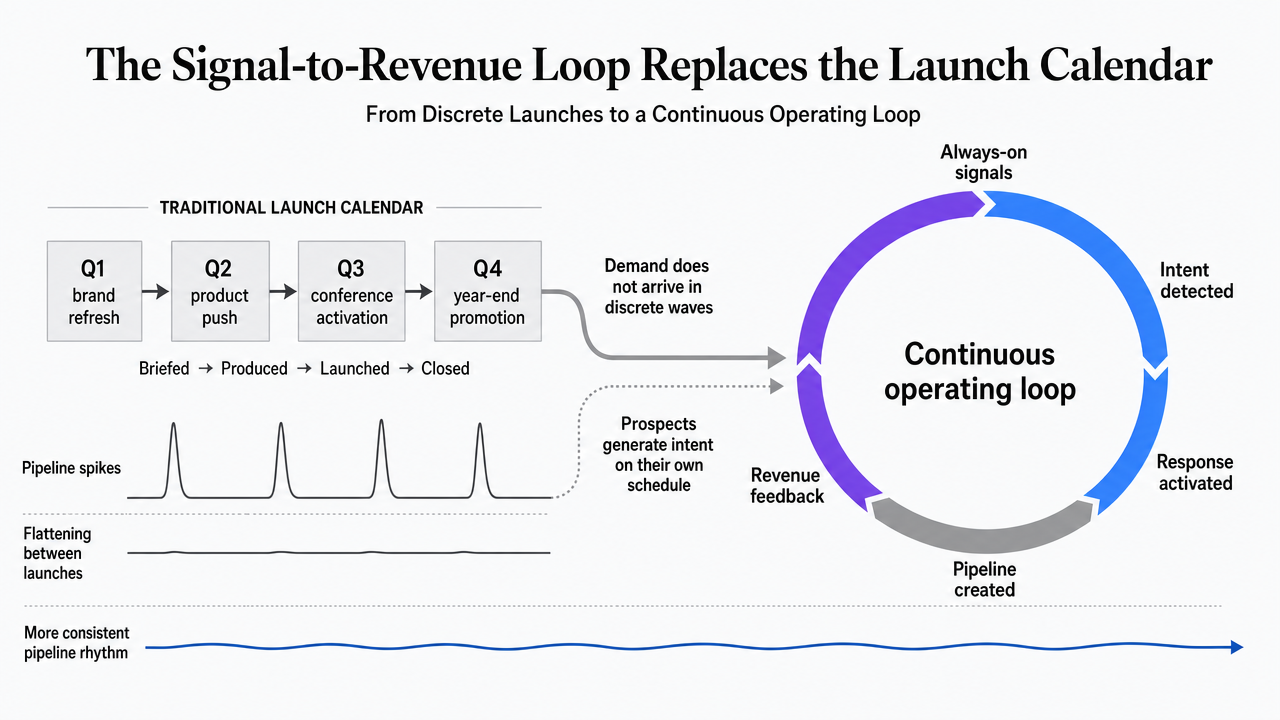
The traditional campaign calendar treats marketing as a sequence of events. Q1 brand refresh. Q2 product push. Q3 conference activation. Q4 year-end promotion. Each block gets briefed, produced, launched, and closed out before the next one begins. Pipeline follows the same rhythm, spiking around launches and flattening between them.
That rhythm is the source of the variance CFOs flag. Research on how digital technologies reshape marketing finds that the customer journey has been transformed because individuals are now constantly connected, which breaks the assumption that demand arrives in discrete waves matching internal production cycles 7. Prospects generate intent on their own schedule, not the marketing team's.
A signal-to-revenue loop treats campaigns as an always-on system with defined stages: detect signals, prioritize actions, produce assets, approve and publish, measure outcomes, feed results back into the next detection pass. The calendar still exists, but it governs cadence inside the loop rather than defining the shape of demand. Launches become checkpoints where the loop pushes a new emphasis, not events the pipeline depends on to move.
Signal Capture as the First Predictability Lever
Predictable pipeline starts with what a marketing org can see. Peer-reviewed work on consumer digital signals argues that the ability to detect and act on those signals is itself a source of competitive advantage 6. The teams that hit forecast tend to be the teams that have wired their stack to notice intent early and route it into a scored action, not the teams running the loudest launches.
Useful signals fall into three groups:
- Behavioral signals include search queries, page depth on high-intent pages, pricing-page returns, call transcripts, form abandonment, and review activity.
- Account signals cover firmographic changes, hiring patterns, and location expansion for portfolio operators.
- Channel signals show which paid keywords, organic queries, and referral paths produced qualified conversations last week, not last quarter.
Signal capture only lowers variance when three things happen. Signals reach a shared layer where content, PPC, SEO, and sales work from the same data. Ownership for acting on each signal type is assigned before the signal appears. And the loop closes: outcomes from acted-on signals get scored and fed back into what the next detection pass prioritizes. Detection without routing is a dashboard. Routing without feedback is guesswork.
 Visualize the continuous signal-to-revenue loop described in the section, replacing the linear launch calendar with a cyclical operating model
Journey Mapping as the Structural Foundation
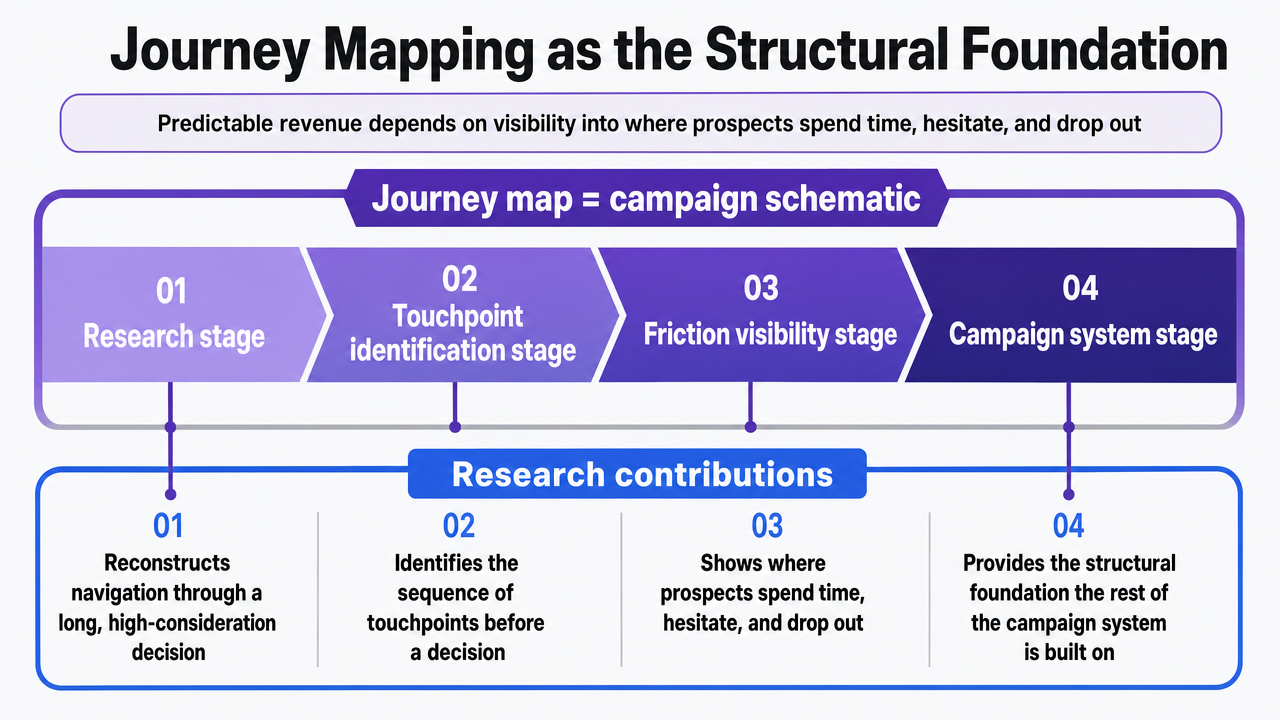
Predictable revenue depends on knowing where prospects actually spend time, hesitate, and drop out. Journey mapping is the research discipline that produces that visibility. It began as a market research technique for understanding how patients navigate complex health care systems and has since become a standard approach for reconstructing the sequence of touchpoints a buyer moves through before a decision 3. For marketing leaders trying to compress forecast variance, the map is the schematic the rest of the campaign system is built on.
Four distinct research contributions matter at four distinct campaign stages:
- At the research stage, journey mapping supplies the method for reconstructing how prospects navigate a long, high-consideration decision 3.
- At the touchpoint identification stage, journey maps function as a commercial-sector tool for cataloging every consumer interaction and linking those interactions to revenue outcomes 5.
- At the barrier detection stage, journey mapping visualizes the relationship between a consumer and a service as a narrative timeline, exposing where emotional friction and process breakdowns interrupt progress 4.
- At the attribution stage, the customer journey can be modeled as a directed graph of behavior and transitions toward purchase, producing an interpretable view of which actions moved the deal 10.
Most in-house teams have a journey slide. Fewer have a journey map wired into planning. The difference shows up in which touchpoints get content, which get paid support, and which get left to chance. When the map is treated as the schematic rather than a deck artifact, campaign investment lands on the segments of the journey where friction is measurable and removable, and forecast variance narrows because the loop is acting on structure rather than intuition.
 Map the four distinct research contributions of journey mapping to the four campaign stages they support, as explicitly cited in the section
Lead Prioritization and Multi-Touch Attribution
Volume-based handoffs are one of the most reliable ways to miss forecast. When every form fill routes to sales at the same weight, capacity gets absorbed by contacts that will not close inside the quarter, and pipeline coverage ratios stop meaning anything. Scored prioritization plus multi-touch attribution is what turns raw lead flow into a forecast-grade view.
Peer-reviewed work on B2B lead scoring frames the two disciplines as one operating system. Lead prioritization and multi-touch attribution together produce a holistic view of the customer journey, ranking which contacts deserve sales attention and which touches actually contributed to progression 11. Prioritization tells the team where to spend the next hour. Attribution tells the team which upstream investments produced the leads worth that hour.
A workable model runs in one loop. Scores build from three inputs:
- Fit signals such as firmographics or service line.
- Behavioral signals such as pricing-page depth and repeat visits.
- Channel signals such as which source and campaign delivered the contact.
Scored leads route to specific channel actions—direct sales outreach for the top band, nurture sequences for the middle, content re-engagement for the bottom. Closed-loop outcomes then feed back into which signals and touches earn more weight next cycle.
Without this loop, attribution reports become historical narratives that nobody acts on, and scoring becomes a static rules table that ages badly. With the loop closed, marketing leaders can defend a specific forecast band to the CFO because each dollar in a channel connects to a scored contact, an action taken on that score, and a measured outcome. That is the difference between reporting on the past quarter and shaping the next one.
Run Data-Driven Campaigns With Full Approval Control
Test real-time campaign execution and see measurable pipeline impact before committing.
Cross-Channel Orchestration Beats Single-Channel Planning
Single-channel campaign planning is one of the last respectable ways to miss forecast. Paid search runs against paid search benchmarks. Content runs against content benchmarks. Email runs against email benchmarks. Each channel looks healthy in isolation, and the pipeline still comes in short because nobody owns the interaction between channels.
Omnichannel research on cross-channel effects finds those effects are asymmetric: channels do not contribute to each other in equal or predictable ways, and the greater opportunity comes from interacting with customers across multiple channels rather than optimizing each in isolation 9. A paid search click on a branded term after three organic content visits is a different economic event than the same click cold. An email open following a call transcript flagged as high-intent behaves differently than a batch send to the same list. The asymmetry is where forecast-grade planning lives.
Orchestration turns that asymmetry into a lever. Three practices make it work:
- Shared audience definitions across channels replace channel-specific segments, so a mid-funnel prospect looks the same to PPC, SEO, social, and email teams.
- Sequenced touchpoint plans specify which channel leads, which channels reinforce, and which channel closes—rather than each team optimizing its own last-touch conversion.
- Coordinated measurement rolls up channel contributions into a single view of pipeline movement, so trade-offs between channels get made on evidence rather than budget politics.
The operational cost of single-channel thinking is duplicated targeting, contradictory creative, and attribution fights at the end of the quarter. The cost of orchestration is a coordination layer that most in-house teams still handle through weekly meetings and shared spreadsheets. When that layer is governed—one queue, one approval flow, one measurement surface—cross-channel effects become something the plan uses rather than something the plan absorbs as noise.
Compliance as a Revenue Predictability Factor
Compliance is usually filed under legal review, not forecast planning. That filing decision is part of why regulated verticals miss forecast. Ad takedowns, revised disclosures, and disputed testimonials all pull conversion assets out of rotation mid-quarter, which shows up as a variance problem long before it shows up as a legal one.
The FTC's disclosure guidance is direct: required disclosures must be clear and conspicuous, and they should sit close to the claim they qualify, not buried in a footer or a second screen 1. When a landing page fails that standard, the fix is rarely a small edit. Creative gets pulled, paid spend pauses, and the pipeline downstream of that asset stalls until a compliant version is approved and republished. Every one of those pauses is a variance event.
Endorsements and revenue claims carry the same operational risk. FTC endorsement guidance requires that testimonials be honest and that material connections between an endorser and the advertiser be disclosed 12. Separate FTC guidance on revenue-oriented advertising states that revenue and expense claims must be clearly, prominently, and unavoidably presented and substantiated 13. Case studies, before-and-after numbers, and creator-driven content all sit inside that rule set. The broader FTC framing treats advertising as a market-efficiency mechanism only when it remains truthful and non-deceptive 14, which is a useful reminder that conversion lift built on unsubstantiated claims is borrowed pipeline.
Inside a governed loop, compliance moves upstream. Disclosure standards, testimonial documentation, and substantiation files get attached to the asset at production, not chased down after launch. Approval routes include a compliance checkpoint on the same queue as creative and channel review. The result is fewer mid-quarter takedowns and a tighter variance band, because the assets driving pipeline stay in market for the full window they were budgeted to run.
The Campaign Readiness Scorecard
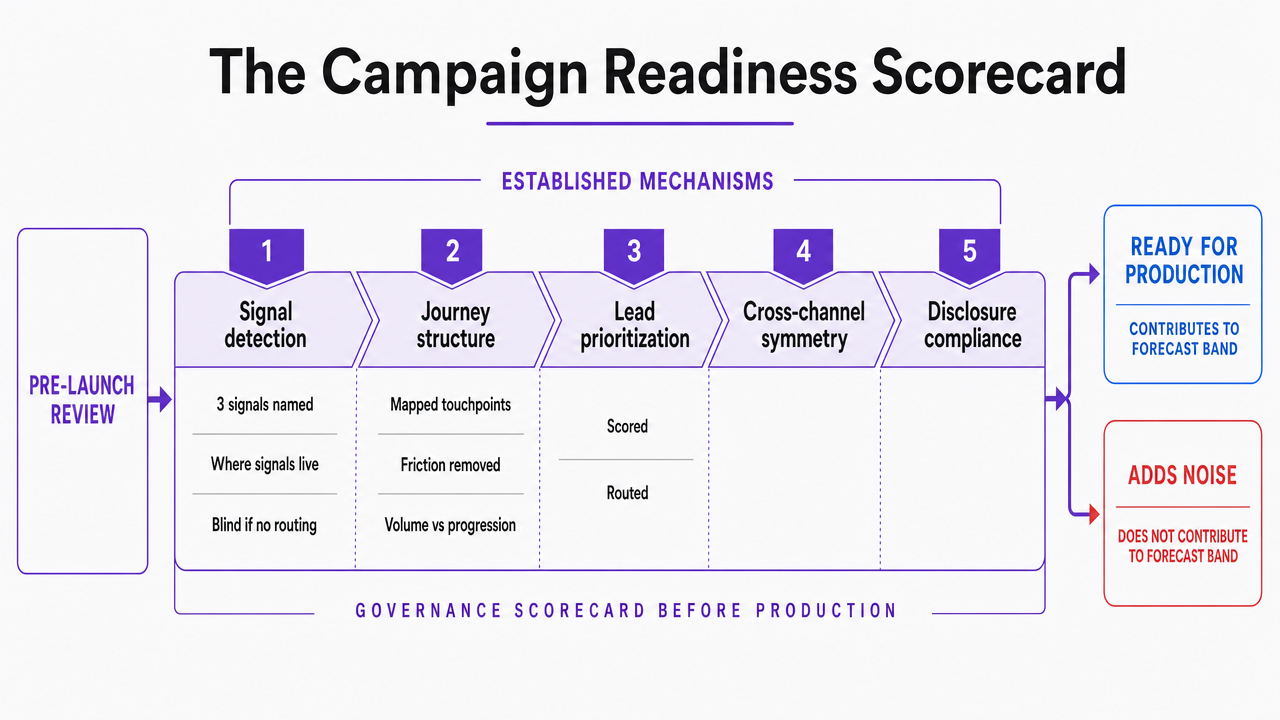
Before a campaign enters production, five checkpoints determine whether it will contribute to a forecast band or add noise to it. Each maps to a specific mechanism already established: signal detection, journey structure, lead prioritization, cross-channel symmetry, and disclosure compliance.
- Signal detection asks whether the team can name the three behavioral, account, or channel signals this campaign is designed to act on, and where those signals live once captured. If the answer is a dashboard nobody routes from, the campaign is running blind 6.
- Journey structure asks which touchpoints on the mapped journey this campaign covers and which it leaves to chance. A campaign that cannot point to specific friction it removes is producing volume, not progression 4.
- Lead prioritization asks how outputs will be scored and routed. If every conversion routes to sales at equal weight, the campaign will absorb capacity without moving forecast 11.
- Cross-channel symmetry asks which channel leads, which reinforce, and which closes. Campaigns designed around a single channel's benchmarks will underperform coordinated plans because channel effects are asymmetric 9.
- Disclosure compliance asks whether every claim, testimonial, and substantiation file is attached at production. Assets that cannot survive review will not stay in market long enough to hit forecast 1.
 Visualize the five pre-launch checkpoints described in the section as a governance scorecard that determines campaign readiness
If You Manage Multiple Locations: Consolidation Economics
Where Per-Location Execution Costs Compound
The rest of this article addresses in-house teams operating at a single P&L. This section shifts to multi-location operators: dental groups and DSOs, senior living portfolios, behavioral health networks, and multi-branch home services. The economics work differently because execution costs compound across locations rather than aggregate.
Four variables absorb the compounding:
- Per-location content production hours climb because each market wants localized landing pages, service descriptions, and review responses that a national template cannot cover without losing local relevance.
- Briefing and review cycle time expands because each location director wants input on creative that mentions their market, which multiplies the number of approval rounds by the number of locations.
- Vendor coordination overhead grows because paid, SEO, content, and reputation vendors each require separate reporting cadences per market.
- Attribution reconciliation across locations breaks down because call tracking, form routing, and CRM instances rarely share a common schema.
These costs do not scale linearly. A portfolio at fifty locations does not pay ten times what a portfolio at five locations pays for the same coordination work; it pays substantially more per location because each new market adds new coordination edges to an already stretched operating model.
Variable-Based View of Governed Automation
The instinct in most portfolio reviews is to cut per-location spend. That approach lowers output before it lowers coordination cost, which usually widens forecast variance instead of narrowing it. The research on digital marketing capability points in a different direction: capabilities themselves contribute to profitability beyond conventional inputs, meaning better execution can improve outcomes without a matching spend cut 8. For portfolio operators, that translates into compressing the coordination layer rather than the production layer.
A variable-based view makes the compression targets specific. Production hours per location drop when a governed system reuses market research, journey structure, and creative frameworks across locations while localizing the surface layer. Review cycle time drops when approvals route through one queue with one decision log rather than parallel email threads per market. Vendor coordination overhead drops when strategy, production, and publishing sit in one loop instead of being distributed across specialist agencies for each channel. Attribution reconciliation drops when scored leads and multi-touch data flow into a shared measurement surface.
The pattern is consistent: capability compression, not spend reduction, is what improves per-location profitability inside a portfolio.
See How AI-Driven Campaigns Deliver Consistent Pipeline Without Team Expansion
Connect to learn how leading brands coordinate multi-channel campaigns that increase qualified pipeline by up to 38%—all without new hires or complex vendor management.
Regulated Verticals: Healthcare-Adjacent and Senior Living
A second audience shift belongs here. Marketing leaders inside Medicare-adjacent plans, rural health systems, and senior living portfolios operate under review rules that reshape the campaign loop in ways the general model does not fully capture.
For Medicare Advantage and Part D-adjacent communications, CMS treats marketing materials as an interpretation of requirements under 42 CFR Parts 422 and 423, which means creative, disclosures, and channel choices sit inside a specific regulatory frame before they hit market 2. Campaign timelines have to absorb plan-year submission windows and material review cycles as fixed inputs, not variables. Teams that model those windows into the loop hit forecast; teams that treat them as legal's problem miss.
Rural health-adjacent campaigns face a different signal. CMS is directing $50 billion from fiscal year 2026 through 2030 into the Rural Health Transformation Program, with emphasis on digital access and measurable outcomes 15. That funding trajectory changes which service lines can be marketed against real capacity gains, and it raises the bar on outcome-linked messaging.
Senior living occupancy campaigns depend on a demographic whose digital behavior has shifted. Increased smartphone and communication technology use among seniors is pushing providers toward digital-first channels tied to tour requests and move-in metrics 16. Journey maps for this audience should account for adult-child influencers as a parallel decision path, not a secondary one.
Execution Capability as the Profitability Hinge
Marketing budgets rarely decide who hits forecast. Execution capability does. The peer-reviewed evidence on this point is direct: digital marketing capabilities significantly contribute to firm profitability beyond conventional capabilities, meaning the way a team plans, produces, approves, publishes, and measures work has its own P&L impact separate from what the team spends 8.
That finding reframes where variance actually gets created. Two organizations with identical budgets and identical channel mixes can produce different pipeline outcomes because one runs a governed loop and the other runs a briefing chain. The briefing chain absorbs weeks between signal and asset, loses fidelity at each handoff, and reconciles measurement after the quarter closes. The governed loop compresses the distance between detection and publication, keeps the decision log intact, and reports outcomes back into the next prioritization pass.
For a VP accountable to a CFO, this is the argument that reshapes the conversation. Requests for larger budgets get scrutinized on marginal return. Requests to compress the coordination layer—fewer handoffs, one approval queue, one measurement surface—get scrutinized on operating leverage. The second conversation is the one that moves forecast variance, because it acts on the capability layer where profitability is actually made.
Closing: The Governed Loop as the Operating Model
Predictable revenue is a design outcome. The teams that hit forecast quarter after quarter share a common shape: signal capture wired to a shared layer, journey structure treated as a schematic, scored leads routed to specific channel actions, cross-channel plans built around asymmetric effects, and compliance attached to assets at production. The launch calendar becomes a cadence input, not the shape of demand.
What that requires operationally is one queue, one decision log, one measurement surface—strategy, production, publishing, and reporting inside a single governed loop rather than distributed across briefing chains. For marketing leaders evaluating how to compress the coordination layer without adding headcount, platforms like Vectoron are built for that model: AI specialist strategists surfacing ranked recommendations, human approval before anything ships, and outcomes fed back into the next prioritization pass.
Frequently Asked Questions
References
- 1.com Disclosures - Federal Trade Commission.
- 2.Medicare Marketing Guidelines - CMS.
- 3.an exploratory study using patient journey mapping - PMC - NIH.
- 4.Journey mapping as a novel approach to healthcare - PMC - NIH.
- 5.Findings from a mixed-methods journey map study of barriers ... - PMC.
- 6.How consumer digital signals are reshaping the customer journey.
- 7.How digital technologies reshape marketing: evidence from a ... - PMC.
- 8.The value relevance of digital marketing capabilities to firm ... - PMC.
- 9.Omnichannel marketing: Are cross-channel effects symmetric? - PMC.
- 10.Explainable Model Fusion for Customer Journey Mapping - PMC.
- 11.The relevance of lead prioritization: a B2B lead scoring model based ... - PMC.
- 12.FTC's Endorsement Guides: What People Are Asking.
- 13.Business Guidance Concerning Multi-Level Marketing.
- 14.The Consumer Protection Pyramid: Education, Self-Regulation, and ....
- 15.Rural Health Transformation (RHT) Program - CMS.
- 16.Digital Marketing Strategies in the Senior Housing Industry: New Ways to Reach Prospective Residents.