
Key Takeaways
- Content collaboration behaves as a nonbillable cost that erodes leverage, utilization, and realized rate — the three arithmetic levers professional service profitability actually rests on 14.
- Communication quality outperforms communication frequency: structured briefs, revision requests, and handoff notes move more information per exchange than adding standups or check-ins 17.
- Codifying senior staff knowledge into workflow-embedded assets converts synchronous conversations into lookups, with knowledge sharing showing a 0.59 path coefficient to team effectiveness 12.
- Retire activity dashboards in favor of four margin-linked metrics — coordination hours per deliverable, revision rounds, producer-to-lead ratio, and monthly realized rate per retainer 15.
The Coordination Tax Hiding in Your P&L
Agency owners keep hiring producers, editors, and account leads to protect margin, and margin keeps compressing anyway. The reason is not talent quality or tool selection. It is that content collaboration, treated as a cultural good, functions inside the P&L as a cost center — one that scales faster than headcount.
Professional service profitability rests on three arithmetic levers: leverage, utilization, and realized rate 14. Every hour an account lead spends chasing context for a rewrite, every revision round triggered by an incomplete brief, and every status meeting that replaces asynchronous decision-making pulls hours out of those levers. Coordination is not free time. It is nonbillable labor deducted from utilization and, when it delays delivery, from realized rate.
The awkward part is that the research does not support the assumption that more collaboration produces proportionally more output. A meta-analysis of 1,390 teams across 31 studies found teamwork's effect on performance sits at r ≈ 0.28 — a medium-sized correlation, measured in healthcare settings, not a multiplier 18. Communication behaviors show a similar pattern: quality of communication predicts performance more strongly than frequency of communication 17. Adding meetings does not add margin. Adding structure to fewer, better exchanges can.
McKinsey estimates that streamlining operational processes produces a 5–15% performance impact 22. For an agency running on 15–25% net margins, that range is not incremental — it is the difference between reinvesting and cutting.
What follows treats collaboration as an operating expense to be priced, redesigned, and governed. The goal is not more teamwork. It is fewer handoffs per deliverable and more billable output per production hour.
Reading Collaboration Through the Profitability Spine
Leverage, Utilization, Realized Rate: The Three Levers Collaboration Actually Touches
Professional service firms make money on three arithmetic inputs: leverage (the ratio of production staff to senior owners), utilization (billable hours divided by available hours), and realized rate (what the client actually pays per hour after write-downs and scope creep) 14. Every collaboration decision inside an agency either feeds these levers or drains them. Nothing sits outside the equation.
Leverage breaks when senior staff get pulled into work that should live one or two tiers below them. An account lead rewriting a producer's draft because the brief was thin is not collaboration — it is a leverage failure priced at the account lead's hourly cost. Utilization breaks when producers and editors sit through standups, kickoffs, and internal alignment sessions that do not convert into billable output. Realized rate breaks when review cycles stretch delivery past the point where the retainer's implied hours are exceeded, forcing either a write-down or a discount on the next renewal.
The failure modes are specific and repeatable:
- Unclear roles push work upward, compressing leverage.
- Excess meetings and context-switching cut into utilization.
- Rework driven by incomplete briefs or shifting client feedback erodes realized rate.
Each of these shows up as a P&L drag, not a culture problem.
Framing matters here. McKinsey's operating-model guidance is blunt on this point: transformations succeed when metrics tie to margin and quantified business outcomes rather than to activity indicators like meeting counts or ticket volume 15. An agency measuring collaboration by Slack response time or standup attendance is measuring the wrong denominator.
The productive question is not "how do we collaborate better." It is "which lever is this collaboration protecting, and at what cost per hour." Answer that on a workflow-by-workflow basis and the redesign choices stop feeling cultural and start feeling arithmetic.
What the Evidence Actually Says About Teamwork and Output
The industry talks about collaboration as if it multiplies output. The evidence describes something more modest.
A systematic review and meta-analysis covering 31 studies and 1,390 teams put the correlation between teamwork and performance at r ≈ 0.28 — a medium-sized effect, not a step change 18. The teams studied were clinical, and the outcomes measured were clinical and process metrics, so the number does not transfer cleanly onto content production. But the direction and magnitude are useful: teamwork helps, and it helps a bounded amount. It does not, on its own, double throughput.
That framing matters because the operating assumption in most agencies is the opposite. Adding a producer, an editor, or a coordinator gets treated as if the added coordination will unlock proportional output. It does not. The meta-analytic ceiling is medium, not large. And the same review notes that team and task characteristics did not significantly moderate the effect, meaning the collaboration-as-multiplier story is not rescued by picking better team compositions 18.
There is a second finding that agencies underweight: collaboration and focused work trade off against each other. Research on knowledge workers finds that aspects of teamwork can actively degrade information sharing, team identity, and cohesion when they crowd out concentrated individual work 4. Producers writing between three meetings do not produce three-meetings-worth less. They produce measurably less than that, because context reset has its own cost.
The strategic read is not anti-collaboration. It is anti-inflation. Collaboration is a real input with a real effect size and a real opportunity cost. Treating it as free is what compresses margin. Pricing it — hour by hour, handoff by handoff — is what restores it.
Where Margin Actually Leaks in Content Production
The Nonbillable Hours Nobody Tracks
Most agencies track billable hours with precision and coordination hours with none. That asymmetry is where the P&L quietly bleeds.
A single deliverable — say, a mid-funnel article for a legal client — rarely fails on the writing. It fails on the surrounding labor. A kickoff call to align on angle. An internal Slack thread to resolve tone questions the brief did not answer. A producer waiting on the account lead for a source contact. A revision round triggered because the client's subject-matter expert weighed in after draft one instead of during scoping. Each of these events consumes production hours that were priced into the retainer as if they did not exist.
The pattern is not random. Research on knowledge work shows that teamwork and focused work compete for the same cognitive budget, with information sharing, team identity, and cohesion all measurably degraded when collaboration crowds out concentrated work 4. In an agency, that shows up as producers who look busy in Asana but ship less per week than they did six months ago. The hours are being spent. They are just being spent on context restoration rather than output.
Hybrid production models complicate the accounting further. A study of distributed teams found that team performance declines as more coworkers work remotely, driven by higher coordination costs and thinner informal information exchange 5. That does not mean remote work fails — it means the coordination overhead has to be designed for, not assumed away.
The first move is instrumentation. Agencies that cannot see nonbillable coordination hours cannot price them, and agencies that cannot price them cannot cut them. Everything downstream — workflow redesign, staffing ratios, retainer scoping — depends on making that hidden labor visible.
Operator Economics Table: Pricing the Coordination Load
The table below maps the workflow stages where coordination hours accumulate against the profitability lever each stage attacks. Hour counts are left as variables because they vary by agency, client mix, and retainer structure — the point is to force the accounting, not to import someone else's numbers.
Where Agency Margin Actually Leaks in Content Production
| Workflow Stage | Nonbillable Hours per Deliverable | Profitability Lever Affected | Redesign Move |
|---|---|---|---|
| Kickoff briefing | H₁ | Utilization (senior + producer time) | Standing brief templates with client-supplied inputs pre-collected |
| Internal strategy alignment | H₂ | Leverage (pulls senior staff into producer-tier work) | Async decision logs; senior involvement only on exceptions |
| Draft handoff & context transfer | H₃ | Utilization (producer-to-editor friction) | Codified style, source, and voice assets that travel with the brief |
| Client revision rounds | H₄ | Realized rate (write-downs when scope exceeds retainer) | Scoped revision limits; SME review moved before draft one |
| Status meetings | H₅ | Utilization (whole-team hours, not just leads) | Written weekly status; live meetings reserved for blockers |
| Vendor/freelancer coordination | H₆ | Leverage (account leads managing execution) | Direct-to-producer briefs; approval-gated handoffs |
| Final QA & publishing | H₇ | Utilization (last-mile rework) | Checklist-based publishing with single-owner sign-off |
The three levers in the middle column trace back to the same profitability arithmetic: leverage, utilization, and realized rate 14. Every row is a place where hours leave those levers without generating billable output.
Sizing the total opportunity is the next question. McKinsey's operations research puts the impact of streamlining processes and tasks at 5–15% 22. Applied to a $10M agency running a 20% net margin, the low end of that range is roughly a full percentage point of margin recovered; the high end is closer to three. Neither figure requires new revenue, new headcount, or new client wins. It requires making the hidden row totals — H₁ through H₇ — visible enough to attack one at a time.
The redesign moves in the right column are not tool choices. They are operating-model choices, and they compound.
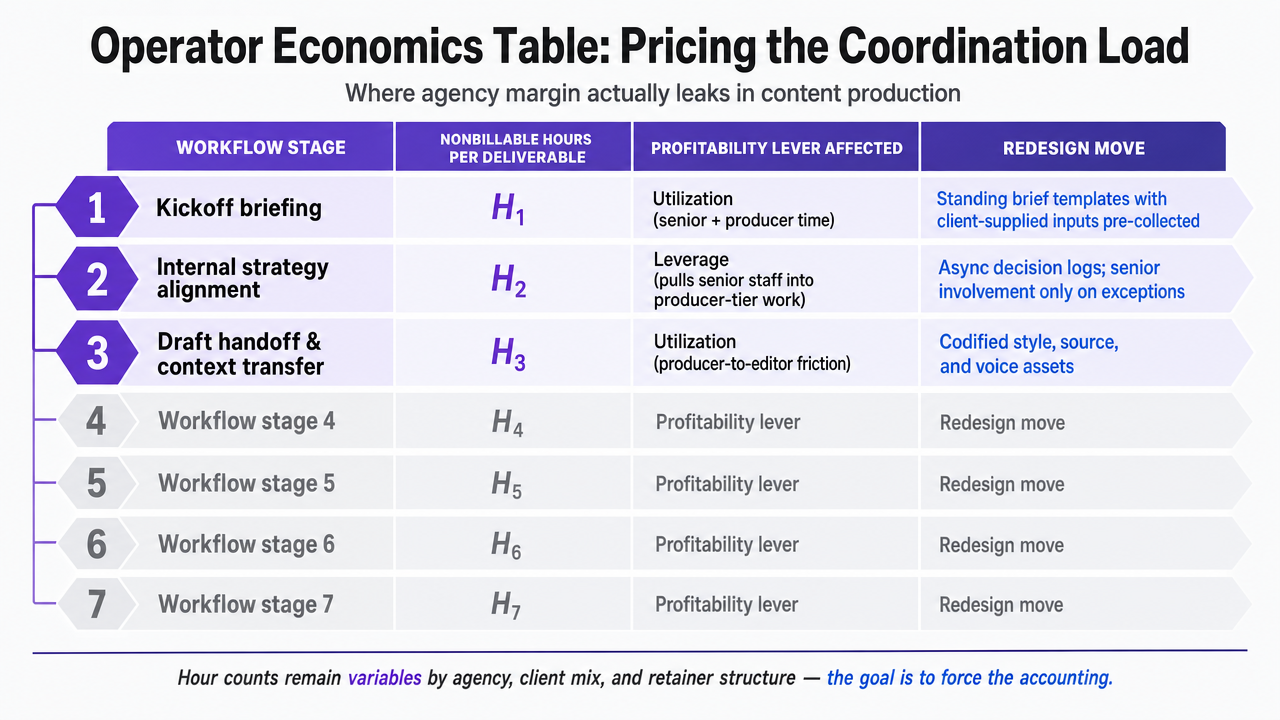 Visualize the seven workflow stages where nonbillable coordination hours accumulate and which profitability lever each attacks, directly mirroring the section's table
Test Seamless Content Collaboration With Live Publishing
Experience streamlined content workflows and deliver real client-ready assets before you commit.
Communication Quality Beats Communication Frequency
The instinct when a deliverable slips is to add a touchpoint. Another standup. A midweek check-in. A dedicated Slack channel per account. The instinct is wrong, and the evidence is unusually direct on the point.
A meta-analysis of team communication and performance found that communication quality shows a stronger relationship with team outcomes than communication frequency 17. Structured behaviors — closed-loop confirmation, briefing before work starts, debriefing after it ships — produced better results than volume of exchange. Teams that talked more did not outperform teams that talked more precisely. The operational read for agencies is that the fix is rarely another meeting. It is a better-shaped version of the exchange already happening.
What quality looks like in a content workflow is specific. A brief that answers the questions a producer will actually ask on draft one, rather than the questions the account lead thinks are important. A revision request that names the paragraph and the reason, not "can we tighten this." A handoff note from writer to editor that flags the two decisions the editor needs to make, not a full recap of the piece. Each of these takes longer to compose and saves multiples of that time downstream.
Frequency, by contrast, is cheap to add and expensive to run. A recurring 30-minute standup with six people costs three production hours every day it convenes. Over a year, that is more than 700 hours — often the equivalent of a full producer's billable capacity — spent on synchronous status alignment that a written update would cover in ten minutes.
Shared understanding of goals, roles, and expectations is what makes fewer exchanges work. Team effectiveness research consistently identifies clarity on those three dimensions as the substrate that lets communication carry more information per unit of time 2. When roles are ambiguous, every exchange has to re-establish context before it can transmit anything new. When roles are clear, a two-line message can move a project forward.
The redesign move is not to talk less for its own sake. It is to raise the information density of each exchange so that fewer exchanges are needed. Templates for briefs, revision requests, and handoffs are the mechanical version of this. Written weekly status replacing live standups is the calendar version. Both compress hours out of coordination and back into billable production.
Codified Knowledge as a Margin Asset
Every senior producer at an agency carries a private library — voice preferences per client, subject-matter expert contacts, the phrasing a legal client's compliance reviewer will and will not accept, the two headline formulas that outperform for a healthcare account. When that library lives only in one person's head, every deliverable that touches an adjacent producer requires re-briefing, and every re-brief is billed to leverage and utilization.
The research on this is unambiguous. Knowledge sharing shows a path coefficient of 0.59 with team effectiveness — a strong relationship, not a marginal one, and notably larger than the correlation typically reported between teamwork and performance 12. Codifying what senior staff know is one of the highest-return moves available inside a production workflow.
The mechanism is intellectual capital. Tacit knowledge sharing feeds human, structural, and relational capital; explicit knowledge sharing primarily strengthens human and structural capital; both forms of capital then improve operational and financial performance at the firm level 19. Translated to agency terms:
- The client brand voice document is structural capital.
- The annotated example library is human capital.
- The SME contact map is relational capital.
All three reduce the marginal cost of the next deliverable.
What this looks like in practice is not a wiki. Wikis fail because they are optional. It looks like assets that sit inside the workflow itself — a brief template a producer cannot skip, a style card that loads with every draft, a revision-precedent file that answers "has this client accepted this treatment before." Each artifact converts a synchronous conversation into a lookup, and each lookup returns hours to billable capacity.
The compounding effect matters more than any single artifact. A codified brand voice document written once serves every future deliverable for that account, spreading its production cost across dozens of pieces. The economics resemble software more than services: fixed cost up front, near-zero marginal cost thereafter. That is the shape agencies want more of their production to take.
Redesigning the Workflow: From Briefing Cycles to Approval Gates
The default agency workflow is synchronous by habit. A brief triggers a call, the call triggers a follow-up thread, the thread triggers a revision, and the revision triggers another call. Each step waits on a person to become available, and the wait itself is billed to utilization even though nothing is being produced during it.
The alternative is not asynchronous chaos. It is a governed asynchronous workflow with explicit approval gates. Work moves forward on its own between gates. At each gate, a named owner reviews, decides, and releases the work to the next stage. No standing meeting is required to advance a deliverable; a meeting is only called when a gate surfaces an actual blocker.
The mechanism this rests on is team cognition — shared understanding of who does what, what "done" looks like at each stage, and which decisions belong to which role. Research on high-functioning teams identifies team cognition as an essential indicator of performance, precisely because it lets work move between people without a full context reset at every handoff 10. When cognition is shared, an approval gate can be a two-minute review. When it is not, the same gate becomes a thirty-minute meeting to reconstruct context that should already exist.
Psychological safety matters here in a specific, non-decorative way. The gate model only works if reviewers say no early and producers surface problems before draft three. Research links psychological safety to team effectiveness through this exact channel: it lets issues appear when they are cheap to fix, not after they have compounded 11. An approval workflow without safety produces silent approvals and expensive rework.
McKinsey's operating-model research is direct on the sequencing. Transformations that stick tie their metrics to margin outcomes — faster launches, better realized rate — rather than to activity indicators, and they assign clear KPI ownership at each decision point 15. Applied to content production, that means every approval gate has one owner, one decision criterion, and one measurable output. Not a committee. Not a channel. A person and a rule.
The redesign is less dramatic than it sounds:
- Kickoffs become written intake with a completeness checklist.
- Strategy alignment becomes an async decision log, escalated only when a producer flags an exception.
- Client revisions run against a scoped round count agreed at retainer signing, with SME review front-loaded into the brief.
- Status meetings shrink to a written weekly digest, with live time reserved for blockers a written update cannot resolve.
Each move converts a synchronous cost into an asynchronous one, and asynchronous costs are the ones that scale without adding headcount.
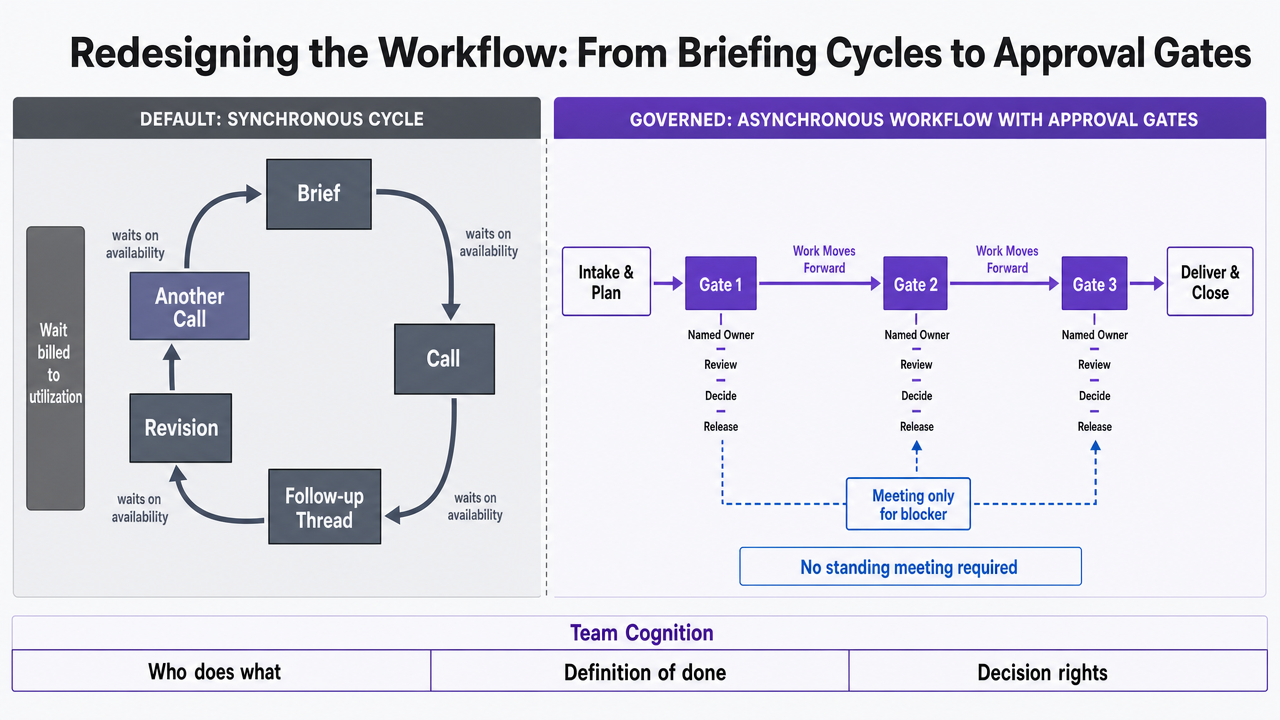 Show the shift from synchronous briefing cycles to a governed asynchronous approval-gate workflow described in the section
See How AI-Driven Content Collaboration Eliminates Production Bottlenecks
Request a walkthrough to evaluate how unified content workflows with AI specialists can streamline approvals, enhance output quality, and increase delivery capacity—without expanding your team or losing margin control.
If You Manage a Multi-Account Portfolio
The arithmetic changes when an account lead is not running one client but seven. At the portfolio level, coordination costs stop behaving like a line item and start behaving like a tax that compounds across accounts. A brief template that saves twenty minutes on one deliverable saves those twenty minutes on every deliverable that account produces for the life of the retainer — and again for every adjacent account the same producer touches.
That compounding cuts both ways. Faultlines between accounts — different tone guides, different SME contacts, different revision conventions — force producers to reset context every time they switch. Research on team faultlines finds that these subgroup divisions complicate communication and coordination in measurable ways 13. The producer who works across three verticals does not carry three separate mental models efficiently. She carries one, and she pays a switching cost each time she loads a different client's rules.
The portfolio-level move is standardization of the workflow, not the output. Briefs, revision protocols, handoff notes, and approval gates should look identical across accounts even when the deliverables differ wildly. Standardized process, differentiated product. That is what lets a single account lead cover more retainers without the coordination load rising linearly with account count.
Knowledge sharing across accounts is where the real leverage lives. Tacit knowledge sharing feeds structural and relational capital, and both improve firm-level financial performance 19. An agency that captures what worked on one legal account and makes it retrievable for the next one is converting one-off learning into a durable asset. Portfolios that do not do this pay for the same lesson repeatedly.
Metrics That Tie to Margin, Not to Activity
The metrics most agencies track for content collaboration measure motion, not money. Standup attendance. Slack response time. Tickets closed. Meetings held. Each of these can rise without a single billable hour improving, and each can be gamed without touching the P&L.
McKinsey's operating-model research is direct about the fix: transformations that hold their gains present a combination of operating-model metrics — efficiency and speed — alongside quantified business benefits like margin improvement and faster launches 15. Activity indicators without margin outcomes are decoration.
The rule for an agency owner is simpler than it sounds: if a metric cannot be traced back to leverage, utilization, or realized rate, it is not a profitability metric 14.
Four numbers do the traceable work:
- Nonbillable coordination hours per deliverable — the H₁ through H₇ totals from the earlier table — measure the coordination tax directly.
- Revision rounds per deliverable measure how well the brief and SME review are front-loaded.
- Producer-to-account-lead ratio measures whether leverage is holding as the book grows.
- Realized rate per retainer, tracked monthly rather than at renewal, measures whether scope creep is quietly discounting the work.
Each of these has an owner and a decision criterion attached. That is the piece most measurement systems skip. A number without a named owner produces reports; a number with an owner and a threshold produces decisions.
The move is to retire the activity dashboard and build a four-line margin dashboard in its place. Every collaboration change the agency makes should show up on one of those four lines within a quarter, or the change was not worth making.
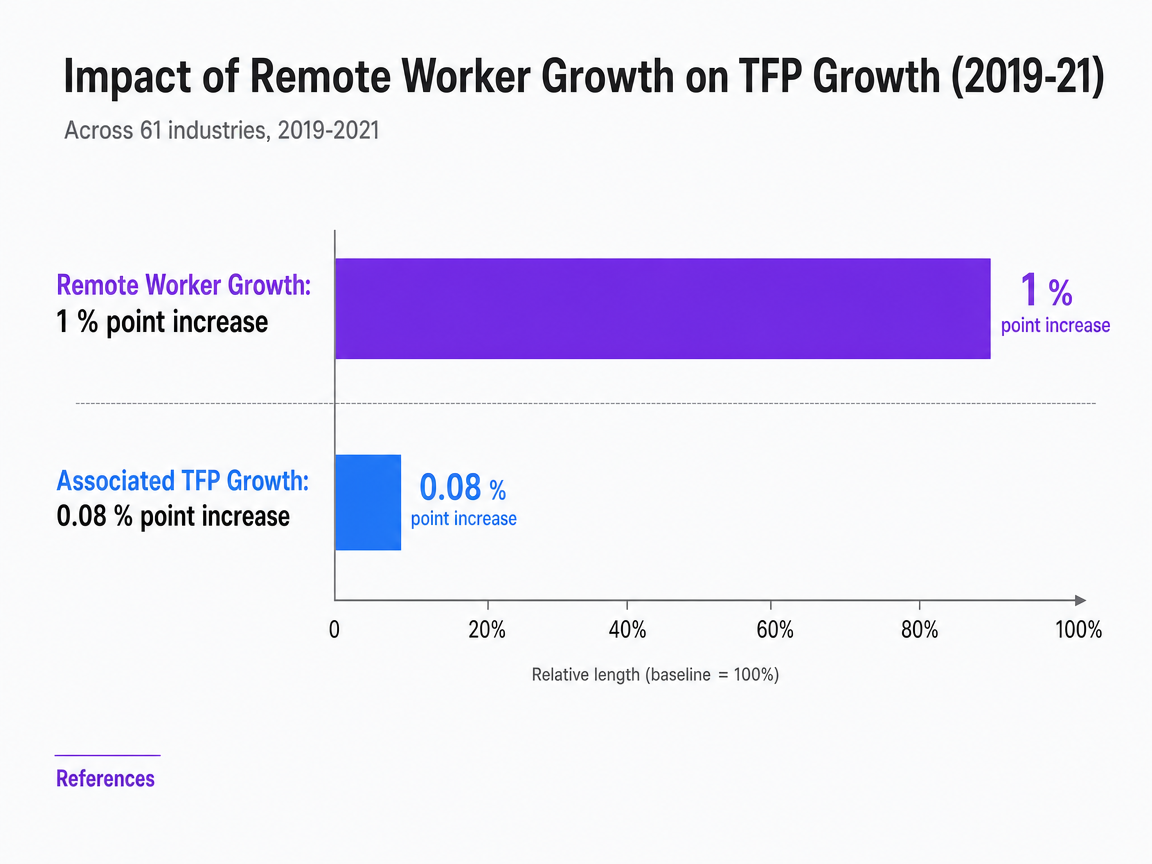 Impact of Remote Worker Growth on TFP Growth (2019-21)
A comparison showing the relationship between a 1 percentage-point increase in remote worker growth and the associated 0.08 percentage-point increase in total factor productivity (TFP) growth across 61 industries from 2019-2021.
Frequently Asked Questions
References
- 1.The rise in remote work since the pandemic and its impact on productivity.
- 2.Overview of the Research on Team Effectiveness.
- 3.Interventions to improve team effectiveness within health care.
- 4.Differential perceptions of teamwork, focused work and perceived productivity in organisations.
- 5.Co-workers working from home and individual and team performance.
- 6.Workplace Mental Health & Well-Being.
- 7.Soft Skills: The Competitive Edge.
- 8.Are They Really Ready To Work?.
- 9.TeamSTEPPS™: Team Strategies and Tools to Enhance Performance and Patient Safety.
- 10.High-Functioning Science Teams.
- 11.The Relationship between Psychological Safety and Management Team Effectiveness.
- 12.The relationships between perceived individual and team learning activities, knowledge sharing, and team effectiveness.
- 13.Primary health care team faultlines and team performance.
- 14.Profitability Drivers in Professional Service Firms.
- 15.How to get your operating model transformation back on track.
- 16.How effective is teamwork really? The relationship between teamwork and performance in healthcare teams: a systematic review and meta-analysis.
- 17.Marlow et al. (2018) – Meta-analysis of team communication and performance.
- 18.How effective is teamwork really? The relationship between teamwork and performance in healthcare teams: a systematic review and meta-analysis.
- 19.Knowledge sharing, intellectual capital and firm performance.
- 20.How effective is teamwork really? The relationship between teamwork and performance in healthcare teams.
- 21.Coordination and Collaboration with Other Statistical Agencies.
- 22.Have you fully cracked the efficiency code?.