
Key Takeaways
- Treat the funnel as a measurement system rather than a content taxonomy — define stage transitions and KPIs first, then produce content engineered to move those specific metrics.
- Draw stage boundaries from observable buyer behavior, not content format, so every transition can be tracked in analytics, correlated to revenue, and stable across quarters.
- Assign one conversion metric and one velocity metric per stage, and quantify a dark-funnel adjustment through self-reported attribution to give the CFO a defensible forecast 4.
- When pipeline misses, repair the transition with the widest quarter-over-quarter variance rather than rebuilding the funnel, and scale volume through tooling while keeping strategic judgment centralized.
Why Pipeline Predictability Breaks at the Funnel Design Layer
Pipeline forecasts miss for a specific reason: the funnel underneath them was built as a content taxonomy rather than a measurement system. When marketing leaders describe their funnel in terms of blog posts, ebooks, and demo pages, they are cataloging assets. When they describe it in terms of stage-conversion rates, velocity between stages, and attribution confidence at each transition, they are running a pipeline engine. The two produce very different forecast accuracy.
The pressure to close that gap is intensifying. In a 2024 survey of B2B marketers, 69% of respondents said they plan to increase lead generation budgets in the next 12 months, with parallel movement in content development and email marketing budgets 6. Larger budgets sharpen the CFO's question from "what did we publish?" to "what will this produce, and when?" A funnel designed as an editorial calendar cannot answer that. A funnel designed as a measurement system can.
Heinz Marketing defines predictable pipeline as an integrated strategy that aligns sales and marketing to find, reach, and convert prospects across the buyer journey 3. The operative word is integrated. Stage boundaries, KPIs, and attribution logic must be defined together, before content production begins. Teams that skip that design step end up with high-output content operations and low-confidence forecasts — activity without predictability.
The sections that follow treat the funnel as three connected layers: stage architecture tied to buyer behavior, KPIs tied to revenue rather than traffic, and an attribution model that accounts for both tracked and untracked touchpoints. Each layer is a design decision. Get them right, and pipeline becomes a function marketing leaders can forecast. Get them wrong, and additional headcount or spend only produces more noise at the top of the same broken system.
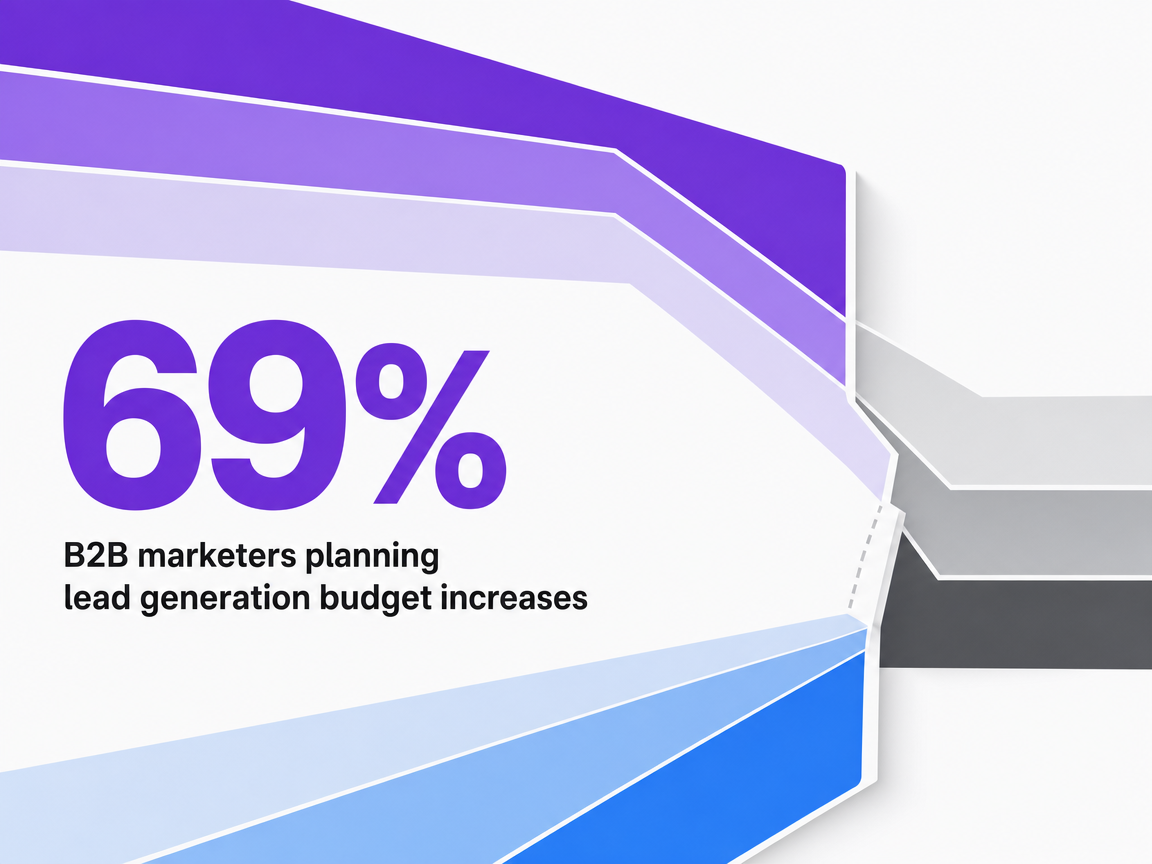 B2B marketers planning lead generation budget increases
B2B marketers planning lead generation budget increases
The Funnel as Measurement System, Not Content Taxonomy
Most funnel diagrams in marketing decks are inventories. They list what exists — blog posts at the top, webinars in the middle, case studies at the bottom — and imply that mapping content to stages is the strategic work. It is not. The strategic work is deciding what each stage will measure, and using those measurements to forecast what the funnel will produce next quarter.
A content taxonomy answers the question "where does this asset belong?" A measurement system answers a harder question: "what does this stage tell the business about the health of pipeline?" The WordPress VIP B2B funnel guide frames the distinction bluntly, arguing that mature funnels focus on value creation by using content conversions and attribution to understand the true impact of content and refine strategy accordingly 2. Assets are inputs. Conversions between stages are the signal.
The practical difference shows up in reporting cadence. A taxonomy-based funnel produces monthly reports full of output metrics — pieces published, sessions, impressions, downloads. A measurement-based funnel produces reports built around three numbers: how many entered each stage, how many advanced, and how long the transition took. Those three numbers, tracked over rolling quarters, are what convert a marketing function into a forecasting function. Rankdots describes the same shift when it defines a content funnel as a structure that maps specific digital assets to distinct stages of awareness and evaluation for the purpose of driving revenue, not audience growth 10.
Reframing the funnel this way changes the first design decision a marketing leader makes. Instead of starting with an editorial calendar and back-filling stages, the sequence inverts: define stage transitions the business needs to see, define the KPI that proves each transition, then produce content specifically engineered to move that KPI. Content becomes downstream of measurement, not the other way around. The next section takes the first step in that inverted sequence — drawing stage boundaries from actual buyer behavior rather than from format convenience.
Stage Architecture: Defining Boundaries by Buyer Behavior
Stage boundaries in most funnels are drawn by content format. Awareness is where the blog posts live. Middle-funnel is where the ebooks and webinars sit. Bottom-funnel is the case study shelf. The problem with format-based boundaries is that they describe what marketing produces, not what buyers do. A prospect reading a case study on a Tuesday afternoon is not necessarily in a late-stage evaluation; a prospect skimming a glossary page may already be shortlisting vendors. Format tells the marketer nothing reliable about intent.
Behavior-based boundaries invert that logic. Instead of asking "what type of content is this?", they ask "what did the buyer just do, and what does that action reveal about where they sit in the purchase decision?" Lucid's four-phase model — awareness, evaluation, purchase, and delight — is useful precisely because each phase is named for a buyer state rather than a content bucket 1. Awareness is a state of problem recognition. Evaluation is a state of active comparison. Purchase is a state of commitment. Delight is a state of retention and referral behavior. Content follows those states; it does not define them.
The practical exercise is to write down the observable action that marks entry into each stage, and the observable action that marks exit. For a dental service organization, entry into evaluation might be a specific query pattern — "clear aligners cost near me" rather than "do clear aligners hurt." For a law firm, evaluation entry might be a return visit to an attorney bio page after an initial blog session. For a home services group, it might be a pricing-calculator interaction rather than a maintenance-tips read. Rankdots frames this as aligning topics with buyer questions and pain points at each stage, treating those questions as the boundary markers 10.
Three tests separate a behavior-based stage from a format-based one:
- Can the transition be observed in analytics or CRM data without a human interpreting intent?
- Does the transition correlate with a downstream revenue event — a demo, a consultation, a signed agreement?
- Is the transition stable across quarters, so that a rate calculated in Q1 remains meaningful in Q3?
If a stage boundary fails any of the three, it is a taxonomy label, not a measurement point.
Behavior-based architecture also resolves a chronic reporting problem: content that appears to underperform because it sits in the "wrong" stage. A comparison page tagged as bottom-funnel may actually be doing awareness work for a category-unaware buyer. Once stages are defined by what the visitor does next rather than by what the asset looks like, that comparison page gets credit for the transition it actually produces. The funnel starts reporting on the business, not on the content library.
Test a complete content funnel in real time
Validate your pipeline strategy by publishing and measuring actual funnel content in a live environment for seven days.
Stage KPIs Tied to the Question the CFO Actually Asks
A CFO does not ask marketing what it published. A CFO asks three questions: how much pipeline will this produce, when will it convert, and what did it cost per dollar of revenue. Every stage KPI in the funnel exists to answer some part of that triad. If a metric on the marketing dashboard cannot be traced back to one of those questions, it is a hobby, not a KPI.
The mistake most funnel scorecards make is measuring intensity at the top and outcomes at the bottom, with nothing measurable in between. Sessions, impressions, and time-on-page describe intensity. Sourced revenue describes outcome. The middle — the actual conversion mechanics — goes unmeasured, which is exactly where forecasts break. FirstPageSage's 2026 B2B content benchmarks argue for metrics that indicate whether efforts are on track toward lead generation and revenue, not vanity indicators of activity 7.
A workable stage KPI set assigns one primary conversion metric to each transition and one supporting velocity metric:
- At awareness, the primary is qualified session-to-known-visitor conversion; the supporting metric is time from first visit to identification.
- At evaluation, the primary is known-visitor-to-marketing-qualified-lead rate; the supporting metric is days-in-stage.
- At the bottom, the primary is MQL-to-opportunity conversion, with sales-cycle length as the velocity signal.
Each of those five numbers maps directly to a CFO question about volume, timing, or cost.
Benchmarks anchor the target-setting conversation. The 2025–2026 B2B benchmark compilation from Kliq Interactive reports an average B2B PPC conversion rate of 7.52% and an average cost per lead of $70.11 across the B2B set it studied, alongside CPL, CAC, pipeline velocity, and ROAS as the metrics that matter most for pipeline economics 5. Those figures are paid-channel averages, not universal targets, but they give a marketing leader a defensible reference point when a CFO asks whether a 4% stage-conversion rate on a comparison page is good, bad, or ordinary. Below 7.52% on a high-intent asset is a signal to investigate; well above it is a signal that the stage boundary may be drawn too late in the buyer journey.
The WordPress VIP funnel guide frames the discipline as fine-tuning strategy through content conversions and attribution rather than through output counts 2. Practically, that means the monthly marketing report leads with stage-conversion rates and velocity, not with content-piece counts. When a rate drops, the team investigates the specific transition — not the entire funnel — and the conversation with finance shifts from defending activity to diagnosing mechanics. That is the reporting posture the CFO has been waiting for.
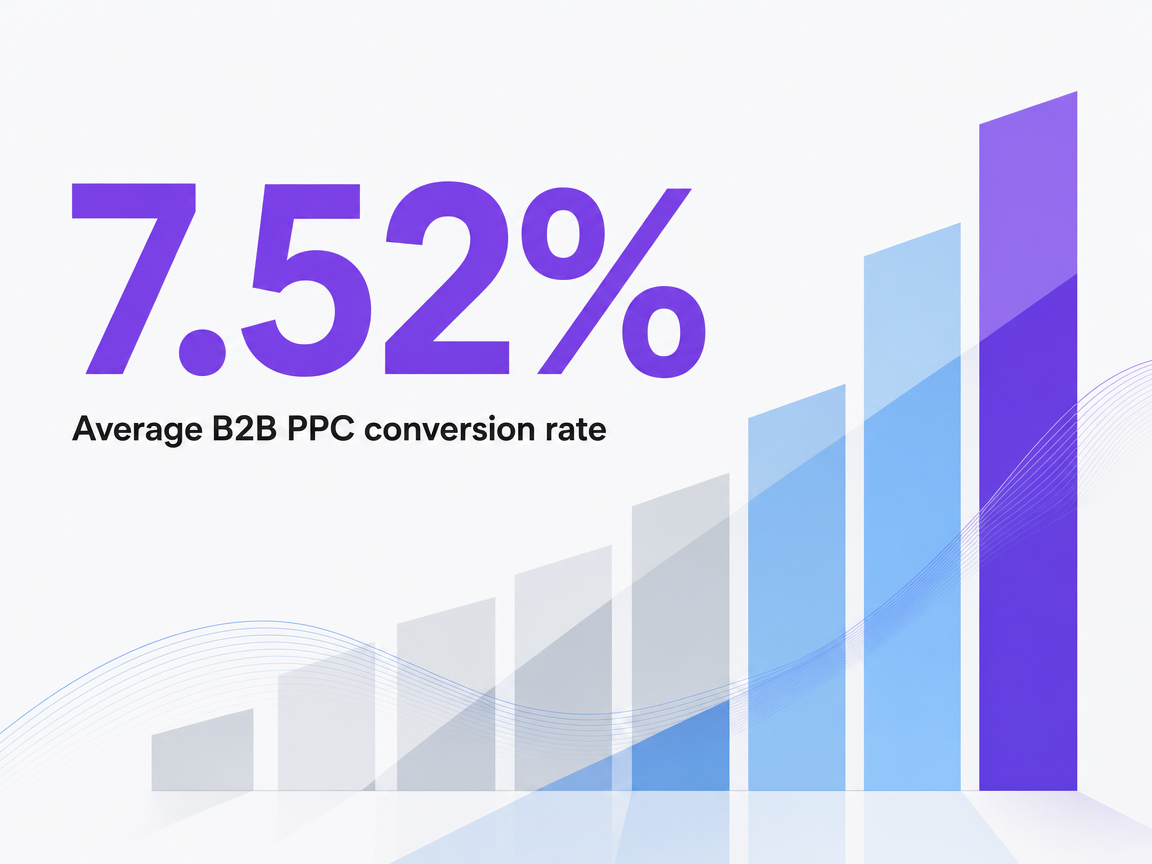 Average B2B PPC conversion rate
Average B2B PPC conversion rate
Attribution Confidence and the Dark Funnel Problem
Every attribution model is a confession. It states, in the form of a report, which touchpoints the marketing team can see and which ones it is guessing at. The gap between those two categories is the dark funnel — the set of interactions where buyers research, discuss, and shortlist without leaving a trackable signal. Peer conversations on Slack communities, podcast mentions, LinkedIn comment threads, executive dinners, and forwarded PDFs all shape opinion before the first form fill. None of them show up in a session-level report.
The Predictable Profits framing of the dark funnel is direct: buyers engage, research, and make decisions across touchpoints outside the typical sales funnel, both online and offline, and marketing teams that ignore those interactions build attribution models that misprice channels 4. The consequence is not academic. When a comparison page appears to convert at 12% and a podcast sponsorship appears to convert at 0.4%, the second number is almost certainly wrong — the podcast likely fed the comparison page visit weeks earlier, and last-touch attribution assigned all the credit to the page.
Two design choices raise attribution confidence without pretending the dark funnel can be fully instrumented:
- Self-reported attribution at the point of conversion — a required "how did you first hear about us?" field on demo and consultation forms, with responses tagged in the CRM and reconciled monthly against digital attribution. The gap between the two data sets is the dark-funnel adjustment.
- Cohort analysis on branded search volume, direct traffic, and organic homepage sessions. Sustained increases in those three lagging indicators, following unattributed campaigns like a podcast tour or an executive LinkedIn push, are the fingerprint of dark-funnel activity.
MarketingSherpa's benchmark work with 1,745 B2B marketers found that proving ROI and aligning marketing with sales rank among the most persistent challenges in the function, a finding that has held across years of the survey 8. Attribution confidence sits underneath both problems. A marketing leader who can quantify the dark-funnel adjustment — even as a rough percentage overlay on last-touch data — walks into the CFO conversation with a defensible forecast. One who cannot is negotiating from a scorecard the CFO already suspects is incomplete.
The Diagnostic: Finding Which Stage Is Actually Broken
When pipeline misses forecast, the instinct is to fix everything at once. That instinct is expensive and usually wrong. A funnel breaks at a specific transition, and diagnosing which one is a matter of comparing observed stage rates against a defensible benchmark set, then following the drop.
The mechanics are straightforward. Pull the last four rolling quarters of stage-conversion data. For each transition — anonymous session to known visitor, known visitor to marketing-qualified lead, MQL to opportunity — calculate the median rate and the variance. Then pair each rate with a single business question it answers:
- Awareness-to-known conversion answers whether the top of the funnel is attracting buyers who match the ideal customer profile, tracked through organic traffic growth against the 2026 B2B content benchmarks 7.
- Known-to-MQL conversion answers whether middle-funnel content is qualifying intent or just entertaining browsers.
- MQL-to-opportunity conversion answers whether sales-influenced revenue is materializing from the pipeline marketing sources 7.
The stage with the widest variance across quarters is the broken one — not the stage with the lowest rate. Low but stable conversion is a design constraint the team can plan around. Volatile conversion is a signal that the stage boundary, the content mix feeding it, or the qualification logic behind it is misaligned with buyer behavior. A marketing team hunting for the fix should start there, not at the stage that looks worst on a single monthly snapshot.
Once the volatile transition is isolated, the diagnostic narrows to three causes: the entry criteria are wrong, meaning buyers are being classified into a stage they have not actually entered; the content at that stage is not engineered to move the primary KPI; or the exit criteria are wrong, meaning qualified prospects are being held back or passed through prematurely. Each cause has a different fix, and each fix is measurable within one quarter. The funnel does not need to be rebuilt. One transition needs to be repaired, and the forecast confidence recovers with it.
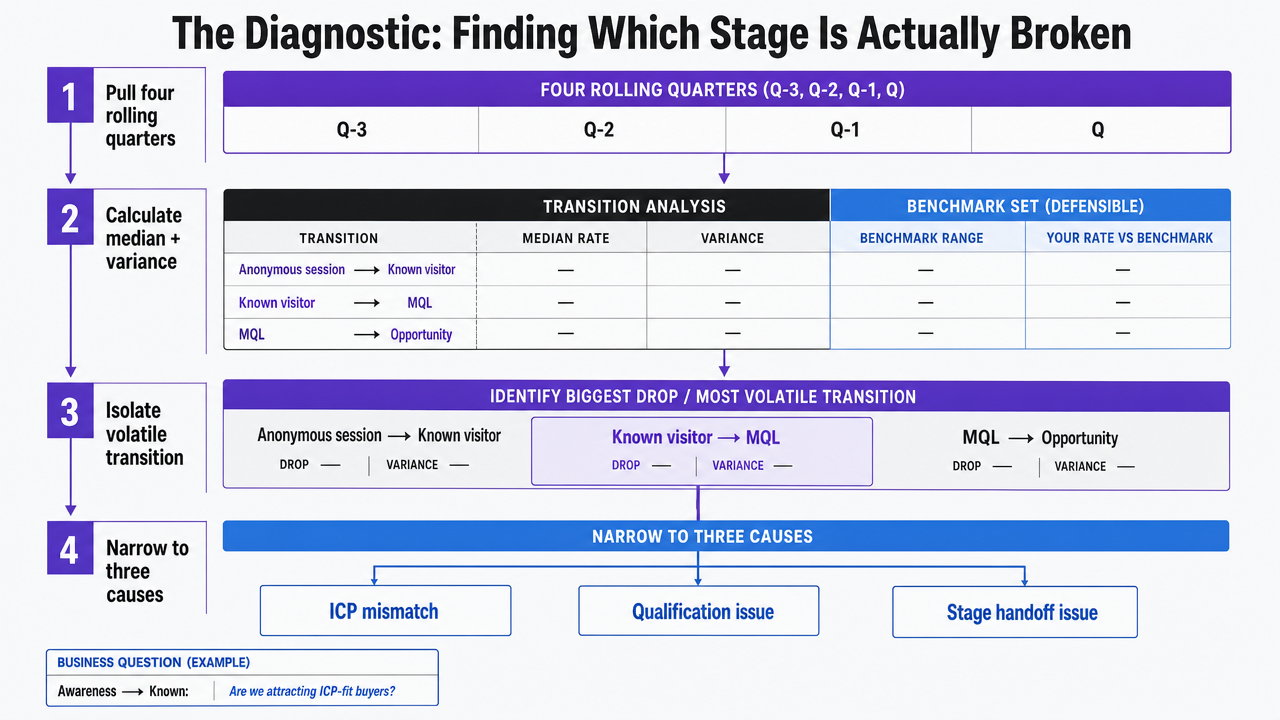 Map the section's four-step diagnostic workflow (pull four quarters, calculate variance, isolate volatile transition, narrow to three causes) into a process infographic that mirrors the prose exactly
See How Leading Teams Build Forecastable Content Pipelines
Request a walkthrough of AI-driven content funnel orchestration—designed for agencies and enterprises seeking predictable, conversion-focused pipeline expansion without increasing team size or vendor overhead.
Scaling Stage-Specific Velocity Without Adding Headcount
A stage-mapped funnel only forecasts reliably when each stage produces enough new content to keep conversion rates stable across quarters. That volume requirement is where most lean marketing teams stall. A team of five cannot hand-produce enough behavior-matched assets to sustain velocity across three or four stages simultaneously, especially when middle-funnel content requires the deepest subject-matter fluency and the tightest alignment with sales conversations.
The escape from that constraint is not more headcount. It is separating the two kinds of work a funnel actually requires:
- Strategic work — defining stage boundaries, setting KPIs, deciding which buyer questions each stage must answer, approving positioning — is judgment work that belongs with the marketing leader and her senior team.
- Production work — drafting stage-specific assets against a defined brief, updating comparison pages, refreshing evaluation-stage explainers when benchmark data shifts — is execution work that scales through tooling rather than through hiring.
The 2026 B2B benchmark reporting summarized on LinkedIn notes that rising marketing budgets are being paired with accelerating AI adoption across demand generation and content operations 9. The underlying pattern is straightforward. Marketing leaders are using AI-assisted production to increase asset velocity at specific stages — typically middle-funnel comparison and evaluation content, where volume needs are highest and format is most repeatable — while keeping strategic decisions inside the team. The lever is stage-specific throughput, not blanket automation.
Two operating rules keep that model honest: every asset ships through a named human approver who owns the KPI it is engineered to move, and every asset is tagged to the stage transition it is expected to influence so post-publication measurement is possible. Without those rules, higher velocity produces more content and worse forecasts. With them, a five-person team can sustain the conversion rates a fifteen-person team used to require — and the marketing leader retains the judgment layer the CFO is actually paying her for.
If You Manage Multiple Locations: Portfolio Funnel Economics
A note on audience: this section is written for marketing leaders running a portfolio — a DSO with 40 practices, a home services group with 12 branches, a senior living operator with 18 communities, or a multi-market law firm. Single-location operators can skip ahead. The funnel design principles above hold, but the economics compound differently when the same stage architecture has to run in parallel across dozens of local markets.
The core problem is that each location is its own funnel. Local search behavior, referral density, competitive intensity, and buyer intent language vary by market, which means a stage boundary calibrated in Phoenix will not calibrate identically in Cleveland. Portfolio marketing leaders face a choice that single-location teams do not: whether to run one centralized funnel with location-tagged content, or a full funnel instance per location. That choice determines the cost curve.
Three operating models sit on that curve:
- In-house team expansion assigns dedicated headcount per region or cluster.
- Agency retainers assign a fixed monthly fee per location, typically bundling content, paid, and reporting.
- Centralized AI-assisted execution runs one strategic team over a production layer that generates location-tagged assets at throughput the headcount model cannot match.
The comparison is not about which is cheapest per asset — it is about which produces defensible stage-conversion rates at portfolio scale.
Expected opportunity math is the honest way to compare them. Using the 2025–2026 B2B benchmark figures — an average PPC conversion rate of 7.52% and an average cost per lead of $70.11 5— a portfolio's expected monthly opportunity yield can be expressed as: Locations × Leads per Location × Stage-Conversion Rate. The cost side is the model's monthly operating cost divided by that opportunity count.
| Model | Cost Structure | Velocity Constraint | Stage-Conversion Risk |
|---|---|---|---|
| In-house expansion | Fixed headcount per region | Hiring cycle, ~1 FTE per 4–6 locations | Consistent judgment, uneven output |
| Agency retainer per location | Recurring fee × locations | Briefing cycles, vendor coordination | Variable quality across markets |
| Centralized AI-assisted execution | Platform cost + core team | Approval throughput of core team | Consistent output, judgment centralized |
The variable that decides the winner is throughput per stage per location. A portfolio marketing leader who can sustain behavior-matched middle-funnel content across every market — comparison pages tuned to local competitor sets, evaluation content referencing local pricing norms, proof assets citing local outcomes — holds stage-conversion rates steady across the portfolio. One who cannot watches variance widen quarter over quarter, and the forecast confidence the CFO expected from a stage-mapped funnel erodes location by location.
Frequently Asked Questions
References
- 1.4 Phases of a Winning Content Marketing Funnel - Lucid Software.
- 2.B2B Content Marketing Funnel Guide - WordPress VIP.
- 3.What is Predictable Pipeline and How Does the Sales Funnel Play a Role?.
- 4.What is the Dark Funnel (And What Does it Have to Do With My ...).
- 5.Ultimate B2B Marketing Reports & Benchmarks 2025–2026.
- 6.B2B Marketing Benchmark Report.
- 7.B2B Content Marketing Benchmarks: Your Guide for 2026.
- 8.MarketingSherpa B2B Marketing Benchmark Report.
- 9.B2B Marketing Benchmark Report 2026: Budgets Rise, AI Adoption ....
- 10.How to Build a Content Marketing Funnel That Drives Revenue.